DOI: https://doi.org/10.7473/EC.2021.56.2.92
Change of Crystalline Properties of Poly(ethylene- co-vinyl acetate) according to the Microstructures
Sung-Seen Choi † and Yu Yeon Chung
Department of Chemistry, Sejong University, 209 Neungdong-ro, Gwangjin-gu, Seoul 05006, Republic of Korea (Received June 16, 2021, Revised June 28, 2021, Accepted June 30, 2021)
Abstract: Microstructure-dependent changes in the crystalline properties of poly(ethylene-co-vinyl acetate) (EVA) was investigated using various EVAs at different VA contents via X-ray diffraction (XRD). The parameters analyzed herein were percentage crystallinity (X
c), interplanar crystal spacing (d
hkl), crystal stack size (D
hkl), and the number of crystal plane piles (N
hkl). The X
cs of [110] and [200] crystals were 21.0-4.1 and 6.7-1.4%, respectively, and they decreased by approximately 2.3 and 0.7% for every mol% of the VA content, respectively. The X
cratios of the [110] and [200] crystals were approx- imately 3. The d
110s and d
200s values were 0.41-0.42 and 0.37-0.38 nm, respectively. The D
110s and D
200s values were 9.56 -21.92 and 7.00-16.42 nm, respectively. The d
hkls increased with an increase in the VA content, whereas the D
hkls decreased.
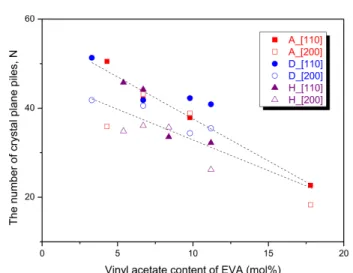
The N
110s and N
200s were 22.7-51.3 and 18.3-43.2, respectively, and they decreased by increasing the VA content. EVA with the same VA content showed different crystalline properties as per the suppliers, and some EVAs deviated from the average trends. This could be explained by the difference in their microstructures such as the sizes and distribution uniformity of the ethylene sequences in EVA chains.
Keywords: poly(ethylene-co-vinyl acetate), crystalline properties, microstructures, X-ray diffraction
Introduction
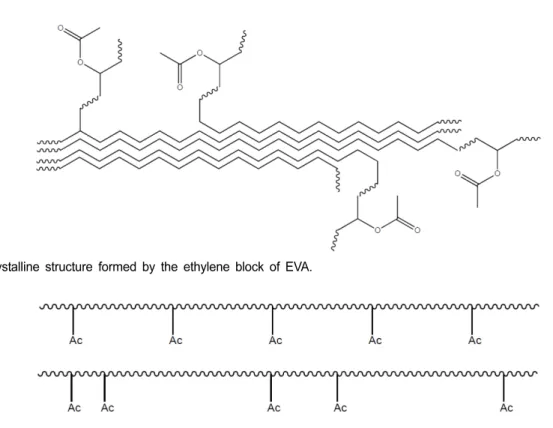
Poly(ethylene-co-vinyl acetate) (EVA) is a copolymer of ethylene and vinyl acetate (VA), and the VA units are ran- domly distributed throughout the ethylene polymer back- bone. EVA is a transparent thermoplastic copolymer, and it becomes more flexible and transparent by increasing the VA content. EVA has crystalline structures due to the ethylene sequences, and its properties and application fields are mainly depending on the VA content. 1-6 The crystalline struc- tures are influenced by the VA units (Scheme 1). Crystallinity and melting points of EVA decrease with increase in the VA content. 7 X-ray diffraction (XRD) and differential scanning calorimetry (DSC) are common analysis techniques to inves- tigate crystalline properties of polymeric materials. 8-22 It is well known that degree of crystallinity influences on prop- erties of polymers, and XRD is widely used for analysis of the crystallinity of polymeric materials.
Length of the ethylene sequence of EVA is restricted by positions of the VA units as shown in Scheme 2. Paraffin wax has stacked lamella crystals due to relatively short methylene
sequence, while polyethylene (PE) has chain-folding crys- talline structures due to long methylene sequence. 23-27 EVA should have stacked lamella crystals like paraffin wax because of relatively small ethylene block size. In general, EVAs have two crystalline structures of [110] and [200].
Crystalline structure and ethylene block size of an EVA should be influenced not only by the VA content but also by positions of the VA units in an EVA chain. Thus, crystalline structures and ethylene block sizes of EVAs with the same VA content may be different each other if the distribution pat- terns (or uniformities) of the VA units are different as described in Scheme 2.
In this study, crystalline properties of various EVAs with the VA contents of 3.3-17.8 mol% (9.5-40 wt%) were ana- lyzed using XRD and influence of microstructures of the EVAs on the crystalline properties was investigated. Per- centage crystallinity (X c ), interplanar crystal spacing (d hkl ), and crystal stack size (D hkl ) were compared as the crystalline properties. Three sets of EVAs having the same VA contents were employed to examine the influence of microstructures on the crystalline properties in detail. Relative superiority for the percentage crystallinity and the number of crystal plane
†
![Figure 2. Variation of the total, [110], and [200] crystallinities of EVA with the vinyl acetate content](https://thumb-ap.123doks.com/thumbv2/123dokinfo/4811341.279640/3.892.66.428.829.1093/figure-variation-total-crystallinities-eva-vinyl-acetate-content.webp)
![Figure 3. Variations of the crystallinity ratio of [110]/[200] of EVA with the vinyl acetate content.](https://thumb-ap.123doks.com/thumbv2/123dokinfo/4811341.279640/4.892.470.817.774.1029/figure-variations-crystallinity-ratio-eva-vinyl-acetate-content.webp)