DOI : 10.5369/JSST. 2011.20.2.71 pISSN 1225-5475/eISSN 2093-7563
Bioimpedance Changes in Rats with CCl
4-Induced Liver Fibrosis
Jeong Heo1and Dong Keun Jung2,+
Abstract
To characterize the relationship between the stage of hepatic fibrosis and bioimpedance, several electric parameters were estimated in rats with CCl4-induced liver fibrosis. Thirty three Sprague-Dawley rats were intraperitoneally injected with a CCl4-mineral oil mixture (1:1, 0.2 mL/100 g) twice a week for 8 weeks. The resistance(R), reactance(X), impedance(Z), and dissipation factor(D) between 1 kHz and 100 kHz were then evaluated in the livers of the rats under pentobarbital anesthesia using an HP4294A Impedance Analyzer. The rats were killed 2, 4, 6, and 8 weeks later, and their livers were classified in accordance with Ishak’s scoring system. R, X, and Z changed in accordance with the progression of hepatic fibrosis and the changes were greater at lower frequencies than at higher frequencies. In comparison, the D spectrum was biphasic; D increased initially then decreased with increasing frequency. All of the parameters(R, X, Z, and D) changed in accordance with the stage of fibrosis in the livers, but D changed specifically with the progression of fibrosis. These results indicate that hepatic fibrosis may be evaluated by determining the changes in D.
Keywords : Bioimpedance, Dissipation factor, Hepatic fibrosis stage, Rat liver
1. INTRODUCTION
The principal objective of treatment in patients suffering from chronic hepatitis B and C is to eliminate the virus, control the progression of the disease, and prevent liver cirrhosis or cancer. Liver cirrhosis occurs as a result of several etiologic factors known to cause progressive injury in hepatocytes, and the accumulation of extracellular proteins induces irreversible liver fibrosis[1, 2]. Measuring the extent of inflammation and fibrosis in cases of chronic viral hepatitis is therefore crucial in monitoring the progression of the disease and evaluating the treatment stages and effects. However, the most commonly employed liver function tests do not reflect the tissue activities of hepatitis. Several studies have utilized biochemical, serological, or imaging approaches that can be used to gauge the extent of inflammation and fibrosis, and these techniques may eventually replace liver biopsy as the method of choice[3-7]. However, no diagnostic technique is currently known that can accurately predict the progression of pathologic fibrosis in cases of chronic hepatitis or liver cirrhosis.
The histological changes resulting from inflammation
and fibrosis not only cause alterations in the liver morphology, but can also alter the cellular distributions and extracellular space. In a sense, a biological tissue’s operation resembles that of a semiconductor; specifically, it may show conductivity or non-conductivity, depending on its unique histological features[8]. Pathologic changes therefore may influence the electrical properties of tissues, which suggests that by measuring them, one may gain valuable information regarding pathologic alterations and evaluate the processes occurring in the host.
Each organ in the body has its own unique electrical flow properties at specific frequencies, depending on the prevailing cellular arrangement. Such unique electrical characteristics have been observed in the brain[9], muscle, adipose tissue, skin[10], and blood[11]. In the spleen, liver, kidneys, muscle, and heart, the impedance(Z) differs in magnitude depending on the frequency, and this property has been shown to differ from one species to another, even for the same organ[12]. Each tissue in the body also shows changes in its electrical nature depending on the degree of inflammation[13, 14]. The liver is composed of small lobules that are evenly arranged in three dimensions with no structural variation depending on the direction. This renders the entire structure electrically isotropic; thus, its electrical nature should be evenly distributed when measured at two randomly selected points.
Measuring the dissipation factor(D) rather than the absolute values of the resistance(R) and reactance(X) may
1Department of Internal Medicine, Medical School, Pusan National University, Busan 602-739, Korea
2Department of Medical Engineering, College of Medicine, Dong-A University, Busan 602-714, Korea
+Corresponding author: [email protected] (Received : Dec. 15, 2010, Accepted : Feb. 24, 2011)
prove to be more useful, especially in cases in which the measured locations are variable. D represents the ratio between the components of Z(R/X); thus, it is unit less.
Increasing the value of D indicates that power is being consumed at an increased rate. D may differ at similar Z values, and a tissue’s electric nature or degree of resistance to an indirect electric current can be evaluated in detail via the use of D as a measure of its electrical properties.
When two electric rods(or poles) are inserted into a tissue to measure its electric nature, Z varies with the distance between the electric rods. However, the tissue°Øs intrinsic electrical properties(R and X) are unique, because they are measured per unit volume. Therefore, D has little to do with the distance between the rods(or poles); hence, it can be used as the sole indicator of the electrical properties in many studies of Z. As cells expand during inflammation, changes occur in both their intra- and extracellular compartments, and these alterations induce changes in Z.
The selection of the frequency range for monitoring the bioimpedance is very important. The impedance is highly dependent on the specifictissue involved. In a previous study, it was shown that the bioimpedance between two sites of the skin could be used for monitoring the arousal state in humans[15].
Carbon tetrachloride(CCl4) is frequently used in the study of liver injury and is converted to the trichloromethyl radical via the P450 enzyme system in the liver. It also functions as a reactive oxygen species in the peroxidation of unsaturated fatty acids and induces the destruction of the cell membrane, resulting in cell death, which may cause liver diseases such as acute hepatitis, fatty liver, hepatic fibrosis, and liver cirrhosis depending on the method of administration, the route, and the frequency[16].
In this study, we analyzed the relationship between the stage of hepatic fibrosis and changes in Z based on several electrical parameters measured in rats with CCl4-induced liver fibrosis.
2. MATERIALS AND METHODS 2.1 Subjects
Thirty three Sprague-Dawley rats(fetal age of 8 weeks, 180-210 g each) were employed in this study. The animals were obtained from Pusan National University’s Medical Research Center after 1 week of observation. During the medical examination and experimental period, groups of
three rats were housed in cages and provided with solid food for experimental animals(Shinchon Animal Food Inc., Seoul, Korea) and distilled water. The experiment was conducted over a 9-week period, with the first week being strictly observational and the second through ninth weeks involving intraperitoneal injections of a mixture of 0.1 mL of CCl4 and mineral oil(Sigma Chemical Co., St. Louis, MO) per 100 g twice a week at 16:00 h. After the injection of CCl4, 20 mg/kg of pentobarbital(Western Medical Supply Co., Arcadia, CA) was injected into the abdominal cavities of 5, 4, 11, and 10 rats on weeks 2, 4, 6, and 8, respectively, under general anesthesia. The abdomens of the rats were then opened and electric rods were inserted to a depth of 3 mm from the liver surface to measure their electrical properties; afterward, the liver tissues were dissected for histological examination. Three rats in the control group were given 0.2 mL of mineral oil and treated identically to the rats in the CCl4group during week 9.
Among the rats subjected to these procedures, three rats died during the experiment, including one in the control group.
2.2 Methods
2.2.1 Design of the electronic probes
The electric probes used to measure Z were constructed from two disposable unipolar needles(Oxford Instruments, Oxon, UK) attached to wooden sticks using epoxy material, with an 8-mm gap between them. The electrical properties of the livers were measured after allowing the electric current to flow only to the exposed areas of the probes.
2.2.2 Measurement of the electrical properties of the liver tissues
To determine the value of Z in the tissues, we used an HP4294A Impedance Analyzer(Agilent Technologies, Palo Alto, CA). A constant voltage of 0.5 V was applied via the fixed voltage method in the frequency range of 1 kHz to 100 kHz. The impedance was measured at 100 individual frequencies. Five different locations on the surface of each liver were selected randomly for measuring the electrical parameters; the mean values for the five locations were used in our analysis.
2.2.3 Handling of the tissue samples and scoring of liver fibrosis
At the end of the experiment, the rats were killed via dissection of the right and left lobes, which were fixed separately in 10 % buffered neutral formalin. After embedding in paraffin(EG1140C; Leica, Wetzlar,
Germany), the samples were sliced to a thickness of 4 μm with a rotary microtome(RM2135; Leica), after which the slices were stained with Masson’s Trichrome stain. The central veins and periportal fibrosis were observed under a light microscope, and the degree of liver fibrosis was classified in accordance with Ishak’s fibrosis staging system(Table 1)[17].
2.3 Data analysis
Statistical analyses were conducted using ExcelTM‚ 2002 (Microsoft, Redmond, WA) and SPSS Version 11.0(SPSS Inc., Chicago, IL); the electrical parameters R, X, Z, and D were expressed in terms of the means and standard deviations. Differences in the mean values of the electrical measurements were analyzed via Dunnett’s test, while Spearman’s correlation coefficient was used to evaluate the relationships between the CCl4injection period and fibrosis stage and between the fibrosis stage and electrical parameters. The difference in each electrical parameter according to the changes in frequency was assessed via comparison using one-way ANOVA; the outcome was considered significant at P<0.05.
3. RESULTS
3.1 Degree of liver fibrosis according to the CCl4 injection period
Table 2 shows the distribution of fibrosis scores according to the duration of CCl4injections in the rat liver over an 8-week period. Fibrosis was evident at stages 2-5.
We noted a significant increase depending on the duration of the injections(rs=0.773, P<0.05).
The infiltration of inflammatory cells into the liver tissue and swelling of the fat and liver cells were detected to a degree that was proportional to the duration of the injections. In this study, however, the subjects were classified in accordance with the degree of fibrosis(Fig. 1).
As the degree of fibrosis increased, the rearrangement of the hepatic lobules and ductal growth due to connective tissue proliferation were observed.
Fig. 1. The histopathologic manifestation(Masson’s Trichrome stain,
×40) was classified using Ishak’s scoring system in rat livers treated intraperitoneally with CCl4. (a) No fibrosis(stage 0), (b) Portal and periportal fibrosis(stage 2), and (c) Numerous bridges or septa(stage 4).
(a)
(b)
(c) Table 1. Implantation and related process conditions of the
PPD for typical cases
0 1 2 3 4 5 6
None Portal (few)
Portal (most), periportal +/- rare portal-portal septa Few bridges or septa
Numerous bridges or septa Incomplete cirrhosis Cirrhosis, definite or probable
Score Stage of Fibrosis
Table 2. Distribution of fibrosis scores according to the duration of CCl4injection in rat liver
Control 2 4 6 8 Total
3 5 4 11 10 33 0
3
3 1
0 2
4 2 5
11 3
1 1 2 1 5
4
1 4 6 11
5
3 3
6
0 Duration
(weeks) Stage Total
3.2 Changes in electrical impedance
Fig. 2 shows the changes in each of the electrical parameters according to the frequency. In all groups, R and X decreased as the frequency increased from 1 kHz to 100 kHz. At stages 2 and 4, significant increases of R, X and Z were observed in the frequency range below 12 kHz compared with stage 0(i.e., the control group; P<0.05). In contrast, D, the ratio of R to X, exhibited a biphasic pattern, increasing in the low-frequency range and decreasing in the high-frequency range within the measured range of frequencies(Fig. 2d). According to the progression of fibrosis in the tissues, the peak value of D decreased compared with that in the control tissues. However, in the high-frequency range, the value of D for the higher-degree fibrosis tissue was greater than that for the lower-degree fibrosis tissue. The crossing point of D(i.e., the same value of D in all groups) occurred at a frequency of approximately 12 kHz(Fig. 2d).
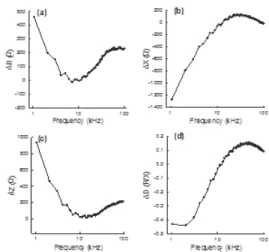
The difference between fibrosis stage 4 and the control group was assessed further to distinguish the electrical features associated with liver fibrosis. Fig. 3 shows the differences in R, X, Z, and D between fibrosis stage 4 and the control group(stage 4 - stage 0). The differences in R, X, and Z were most prominent at low frequencies and tended to decrease at higher frequencies. The difference in D between fibrosis stage 4 and stage 0 was less than zero at lower frequencies and greater than zero at higher frequencies.
4. DISCUSSION
Although several studies have been conducted to devise biochemical, serologic, and imaging methods of diagnosis to evaluate the stages of liver fibrosis without resorting to a liver biopsy[3-7], no accurate methods have yet been established for predicting the progression of fibrosis over the course of chronic hepatitis and liver cirrhosis. Using various electric parameters estimated in rats with CCl4- induced liver fibrosis, we investigated the relationship between the stage of fibrosis and attendant changes in the electrical parameters. Tissue changes in response to CCl4 have been investigated in previous research, but no studies have yet reported on the changes in the electrical properties of liver cells in response to CCl4induced inflammation.
O’Rouke et al. studied the dielectric properties of human cirrhotic liver tissue, but no differences(were found) between the normal and cirrhotic tissues[18]. Rat liver cells exhibit fat denaturation within 24 h of the administration of CCl4into the abdomen. Twenty-four to 48 hours later, severe central lobular necrosis arises as a result of the prominent proliferation and ballooning of the endoplasmic reticulum[16]. In response to CCl4, hepatocytes exhibit early large-scale fatty degeneration and abnormalities in the central lobule. After several weeks, fibrosis and regenerative nodules may be observed. The severity of the lesions is proportional to the length of the exposure period, but the tissue changes have been shown to vary depending on the species. In this study, the changes in the electrical properties of the liver were observed along a variable- length CCl4administration period and at different stages of fibrosis.
The progression of fibrosis may be evaluated in accordance with several different staging systems;
however, we used Ishak’s classification system, which recognizes six stages[17]. In general, pathologic
Fig. 2. Changes in the electric parameters according to the frequency in vivo in rat liver. (a) Resistance, (b) Reactance, (c) Impedance, and (d) Dissipation factor.
Fig. 3. Differences in the electric parameters between stages 4 and 0 (stage 4 - stage 0) according to the frequency In vivo in rat liver.
classifications are considered to be reliable predictors of fibrotic progression, but they are based principally on individual assessments and do not provide a quantitative means of analyzing fibrotic progression. Therefore, the degree of fibrosis and the electrical features were not believed to show an unambiguous linear relationship. In this study, the values of R, X and Z in the experimental group differed significantly from those in the control group.
D showed consistent changes relative to the degree of fibrosis. At 12 kHz, all of the D values were the same;
moreover, the order of the D values was reversed in the high-frequency range as compared to that in the low- frequency range. This indicates that the degree of fibrosis is closely related to D, an electrical feature. In addition, D is more important than R or X for the prediction or diagnosis of liver fibrosis.
The duration of the CCl4treatment period and the degree of fibrosis showed a linear relationship with each other, but differences were detected between subjects. With regard to the changes in the electrical parameters according to the injection period, at week 8, the values of R, X, and Z in the experimental group were significantly different from those in the control group; however, no constant changes were observed. In summarizing all of the outcomes, the changes in the electrical features of the hepatic lesions were suggested to be more closely related to the degree of fibrosis than to the injection period.
The presence of a large membrane in an organ has a major impact on the electrical flow in that it increases Z.
Biological tissues are composed of cells and each shows unique characteristics of Z that may vary according to the tissue type, frequency, and pathophysiological changes[8].
D, the ratio of R to X, is unaffected by the geometric features of and distance between the electric poles. The organization of the liver is relatively uniform, but the location of the vasculature and intrahepatic ducts may contribute to its aforementioned electrical features.
In conclusion, liver fibrosis as a result of CCl4 administration was found to influence the electric features of the rat liver(R, X, Z, and D) and the changes in D may be useful as an electrical parameter reflective of the degree of liver fibrosis.
ACKNOWLEDGEMENT
This study was supported by a Medical Research
Institute Grant(2004-16) from Pusan National University Hospital.
REFERENCES
[1] S.L. Friedman, “Molecular regulation of hepatic fibrosis, an integrated cellular response to tissue injury”, J. Biol. Chem., vol. 275, pp. 2247-2250, 2000.
[2] M. Pinzani, R.G. Romanelli, and S. Magli,
“Progression of fibrosis in chronic liver diseases: time to tally the score”, J. Hepatol., vol. 34, pp. 764-767, 2001.
[3] A. Hayasaka, and H. Saisho, “Serum markers as tools to monitor liver fibrosis”, Digestion, vol. 59, pp. 381- 384, 1998.
[4] D.K. George, G.A. Ramm, N.I. Walker, L.W. Powell, and D.H. Crawford, “Elevated serum type IV collagen:
a sensitive indicator of the presence of cirrhosis in haemochromatosis”, J. Hepatol., vol. 31, pp. 47-52, 1999.
[5] C. Aube, F. Oberti, N. Korali, M.A. Namour, D. Loisel, J.Y. Tanguy, E. Valsesia, C. Pilette, M. C. Rousselet, P.
Bedossa, H. Rifflet, M.Y. Maiga, D. Penneau- Fontbonne, C. Caron, and P. Cales, “Ultrasonographic diagnosis of hepatic fibrosis or cirrhosis”, J. Hepatol., vol. 30, pp. 472-478, 1999.
[6] T. Bernatik, D. Strobel, E.G. Hahn, and D. Becker,
“Doppler measurements: a surrogate marker of liver fibrosis?”, Eur. J. Gastroenterol. Hepatol., vol. 14, pp.
383-287, 2002.
[7] L.G. Lu, M.D. Zeng, M.B. Wan, C.Z. Li, Y.M. Mao, J.Q. Li, D.K. Qiu, A.P. Cao, J. Ye, X. Cai, C.W. Chen, J.Y. Wang, S.M. Wu, J.S. Zhu, and X.Q. Zhou,
“Grading and staging of hepatic fibrosis, and its relationship with noninvasive diagnostic parameters”, World J. Gastroenterol., vol. 9, pp. 2574-2578, 2003.
[8] S. Grimnes, and O.G. Martinsen, Bioimpedance and bioelectricity basic, (London: Academic Press) pp. 99- 101, 2000.
[9] K.R. Foster, J.L. Schepps, R.D. Stoy, and H.P. Schwan,
“Dielectric properties of brain tissue between 0.01 and 10 GHz”, Phys. Med. Biol., vol. 24, pp. 1177-1187, 1979.
[10] S. Gabriel, R.W. Lau, and C. Gabriel, “The dielectric properties of biological tissues: II. Measurements in the frequency range 10 Hz to 20 GHz”, Phys. Med.
Biol., vol. 41, pp. 2251-2269, 1996.
[11] K.R. Foster, and H.P. Schwan, “Dielectric properties of tissues and biological materials: a critical review”, Crit. Rev. Biomed. Eng., vol. 17, pp. 25-104, 1989.
[12] P. Heroux, and M. Bourdages, “Monitoring living tissues by electrical impedance spectroscopy”, Ann.
Biomed. Eng., vol. 22, pp. 328-337, 1994.
[13] G. Gabbiani, and M.C. Badonnel, “Early changes of endothelial clefts after thermal injury”, Microvasc.
Res., vol. 10, pp. 65-75, 1975.
[14] W.C. Quinby, J.F. Burke, R.L. Trelstad, and J.
Caulfield, “The use of microscopy as a guide to primary excision of high-tension electrical burns”, J.
Trauma., vol. 18, pp. 423-431, 1978.
[15] H.W. Ko, and W.K. Lee, “Arousal monitoring system using the change of skin impedance”, J. Kor. Sensors.
Soc., vol. 4, pp. 30-36, 1995.
[16] J.L. Faber, Xenobiotics: drug metabolism and liver injury, Pathogenesis of liver disease ed J.C. Farber and E. Farber(Baltimore: Williams and Wilkins), pp.43-53, 1987.
[17] K. Ishak, A. Baptista, L. Bianchi, F. Callea, J. De Groote, F. Gudat, H. Denk, V. Desmet, G. Korb, R.N.
MacSween, M.J. Phillips, F.G. Portmann, H. Poulsen, P.J. Scheuer, M. Schmid, and H. Thaler, “Histological grading and staging of chronic hepatitis”, J. Hepatol., vol. 22, 696-699, 1995.
[18] A.P. O’Rouke, M. Lazebnik, J.M. Bertram, M.C.
Converse, S.C. Hagbess, J.G. Webster, and D.M.
Mahvi, “Dielectric properties of human normal, malignant and cirrhotic liver tissue: in vivo and ex vivo measurements from 0.5 to 20 GHz using a precision open-ended coaxial probe”, Phys. Med.
Biol., vol. 52, pp. 4707-4719, 2007.
Jeong Heo studied medicine and received his BS degree from Pusan National University in 1993. He received his MS and PhD degrees in internal medicine from Pusan National University in 1996 and 2004, respectively. Currently he is a associate professor in Department of Internal Medicine, Medical School, Pusan National University. His research interests are hepatology, internal medicine and gene therapy.
Dong Keun Jung studied medicine and received his BS degree from Pusan National University in 1989. He received his MS and PhD degrees in physiology from Pusan National University in 1991 and 1993, respectively. Currently he is a professor in Department of Medical Engineering, College of Medicine, Dong-A University. His research interests are Cardiovascular physiology, biosignal instrumentation and ubiquitous healthcare.