Received: July 25, 2018 Revised: August 22, 2018 Accepted: August 23, 2018
Correspondence to: Young Hwa Choi, Department of Infectious Diseases, Ajou University School of Medicine, 164 WorldCup-ro, Yeongtong-gu, Suwon 16499, Korea
Tel: 031-219-5112, Fax: 031-219-5109 E-mail: [email protected]
전국의료관련감염감시체계 중환자실 부문 결과 보고: 2016년 7월부터 2017년 6월
곽이경1ㆍ최영화2ㆍ최준용3ㆍ유현미4ㆍ이상오5ㆍ김홍빈6ㆍ한수하7ㆍ이미숙8ㆍ김효열9ㆍ김성란10 김태형11ㆍ박선희12ㆍ유소연13ㆍ최평균6ㆍ은병욱14ㆍ신명진15ㆍ최지연16ㆍ구현숙17ㆍ어 영18ㆍ유진홍12
인제대학교 일산백병원 내과1, 아주대학교 의과대학 감염내과2, 연세대학교 의과대학 내과학교실3,
인제대학교 상계백병원 감염관리실4, 울산대학교 의과대학 서울아산병원 감염내과5, 서울대학교 의과대학 내과학교실6,
순천향대학교 의과대학 간호학과7, 경희대학교 의과대학 내과학교실8, 연세대학교 원주의과대학 내과학교실9,
고려대학교 구로병원 감염관리실10, 순천향대학교 의과대학 내과학교실11, 가톨릭대학교 의과대학 내과학교실12, 가톨릭대학교 성빈센트병원 감염관리실13, 을지대학교 의과대학 소아과학교실14, 분당서울대학교병원 감염관리실15,
중앙대학교병원 감염관리팀16, 질병관리본부 감염병감시과17, 연세대학교 원주의과대학 진단검사의학과18
Korean National Healthcare-associated Infections Surveillance System, Intensive Care Unit Module Report: Summary of Data
from July 2016 through June 2017
Yee Gyung Kwak1, Young Hwa Choi2, Jun Yong Choi3, Hyeon Mi Yoo4, Sang-Oh Lee5, Hong Bin Kim6, Su Ha Han7, Mi Suk Lee8, Hyo Youl Kim9, Sung Ran Kim10, Tae Hyong Kim11,
Sun Hee Park12, So-Yeon Yoo13, Pyoeng Gyun Choe6, Byung Wook Eun14, Myoung Jin Shin15, Ji-youn Choi16, Hyun-Sook Koo17, Young Uh18, Jin-Hong Yoo12
Department of Internal Medicine, Inje University Ilsan Paik Hospital1, Goyang, Department of Infectious Diseases, Ajou University School of Medicine2, Suwon, Department of Internal Medicine, Yonsei University College of Medicine3, Seoul, Infection Control Office, Inje University Sanggye Paik Hospital4, Seoul, Department of Infectious Diseases, Asan Medical Center, University of Ulsan College of Medicine5, Seoul, Department of Internal Medicine, Seoul National University College of Medicine6, Seoul, Department of Nursing, Soonchunhyang University College of Medicine7, Cheonan, Department of Internal Medicine, Kyung Hee University School of Medicine8, Seoul, Department of Internal Medicine, Yonsei University Wonju College of Medicine9, Wonju, Infection Control Office,
Korea University Guro Hospital10, Seoul, Department of Internal Medicine, Soonchunhyang University College of Medicine11, Seoul, Department of Internal Medicine, College of Medicine, The Catholic University of Korea12, Seoul, Infection Control Office, The Catholic University of Korea St. Vincent's Hospital13, Suwon, Department of Pediatrics, Eulji University School of Medicin14,
Seoul, Infection Control Office, Seoul National University Bundang Hospital15, Seongnam, Infection Control Team, Chungang University Hospital16, Seoul, Division of Infectious Disease Control, Korea Centers for Disease Control and Prevention17,
Osong, Department of Laboratory Medicine, Yonsei University Wonju College of Medicine18, Wonju, Korea
Background: In this report, we present the annual data of the intensive care unit (ICU) module of the Korean National Healthcare-associated Infections Surveillance System (KONIS) from July 2016 through June 2017.
Methods: We performed a prospective surveillance of healthcare-associated urinary tract infection (UTI), bloodstream infection (BSI), and pneumonia (PNEU) at 285 ICUs in 193 hospitals using KONIS surveillance system.
Healthcare-associated infection (HAI) and device-associated infection rates were calculated as the numbers of
infections per 1,000 patient-days (PD) and device-days (DD), respectively. Device utilization was calculated as a ratio
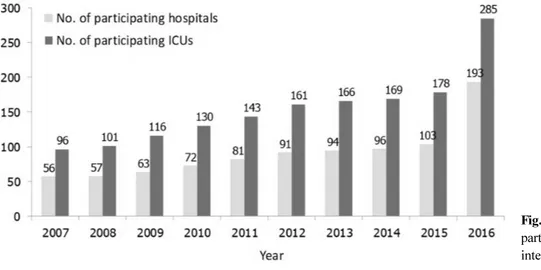
Fig. 1. Number of KONIS participating hospitals and intensive care units.
of device days to patient days.
Results: A total of 3,989 HAIs were found during the study period; 1,241 UTIs (1,189 cases were urinary catheter-associated), 1,757 BSIs (1,481 were central line-associated), and 991 PNEUs (480 were ventilator-associated).
The rate of urinary catheter-associated UTIs (CAUTI) was 1.01 cases per 1,000 DD (95% confidence interval [CI], 0.95 –1.07) and urinary catheter utilization ratio was 0.85 (95% CI, 0.849–0.851). These were higher than the data of the previous year, 0.88/1,000 DD (95% CI, 0.82-0.95) and 0.84 (95% CI 0.839-0.841), respectively. The rate of central line-associated BSIs was 2.23/1,000 DD (95% CI, 2.12 –2.35) while the central line utilization ratio was 0.48 (95% CI, 0.479 –0.481). The rate of ventilator-associated PNEUs was 1.00/1,000 DD (95% CI, 0.91–1.09) while the ventilator utilization ratio was 0.35 (95% CI, 0.349 –0.351).
Conclusion: The overall HAI rate was similar to that of the previous year but the rate of CAUTI increased.
Keywords: Healthcare-associated Infection, Intensive care unit, Korean National Healthcare-associated Infections Surveillance System (KONIS)
Introduction
전국의료관련감염감시체계(Korean National Heal- thcare-associated Infections Surveillance System, KONIS)는 우리나라의 대표적인 의료관련감염 감시체계로 2006년 7월부터 전국 44개 종합병원 과 대학병원의 중환자실에서 시작하여 현재까지 지속적으로 참여병원이 증가하는 등 안정적으로 운영되어 왔다(Fig. 1) [1-3]. 표준화된 방법으로 각 병원의 중환자실에서 발생하는 요로감염 (urinary tract infection, UTI), 혈류감염(bloodstream infection, BSI), 폐렴(pneumonia, PNEU)에 대한 감 시를 수행하며 2007년 7월부터 연간 중환자실 의 료관련감염률 자료를 보고하고 있다[4].
2016년 7월부터는 KONIS에 몇 가지 변화가 있
었다. 참여병원 기준이 300병상 이상 규모에서 200병상 이상의 병원으로 확대되었고 이전에는 각 병원의 상황에 따라 분기별로 참여 여부를 선 택할 수 있었으나 모든 참여병원이 연중 감시하 는 것으로 확대되었다[5]. 그리고 건강보험심사 평가원의 의료질향상분담금 지표 중 하나로 KONIS 참여 여부가 포함되면서 참여병원의 수 가 급격하게 증가하였다. 이는 그 동안 참여병원 이 자발적으로 참여하여 감시 자료를 입력하는 시스템으로 운영되어 온 KONIS에 상당한 변화 가 있을 수 있다는 것을 의미하기도 한다.
KONIS에서는 2년마다 감시의 기준이 되는 KONIS 매뉴얼을 개정하고 있는데 2016년 7월에 변경된 KONIS 매뉴얼은 몇 가지 큰 변화가 있었 다[6]. 첫째, 중환자실 의료관련감염 진단의 정의 가 ‘중환자실 입실 48시간 이후에 발생한 감염’
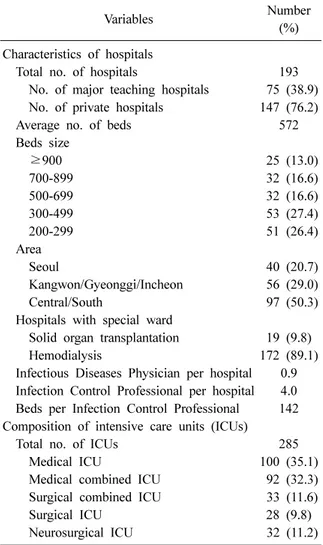
Table 1. Characteristics of hospitals and intensive care units participated in KONIS, July 2016 through June 2017
Variables Number
(%) Characteristics of hospitals
Total no. of hospitals 193
No. of major teaching hospitals 75 (38.9) No. of private hospitals 147 (76.2)
Average no. of beds 572
Beds size
≥900 25 (13.0)
700-899 32 (16.6)
500-699 32 (16.6)
300-499 53 (27.4)
200-299 51 (26.4)
Area
Seoul 40 (20.7)
Kangwon/Gyeonggi/Incheon 56 (29.0)
Central/South 97 (50.3)
Hospitals with special ward
Solid organ transplantation 19 (9.8)
Hemodialysis 172 (89.1)
Infectious Diseases Physician per hospital 0.9 Infection Control Professional per hospital 4.0 Beds per Infection Control Professional 142 Composition of intensive care units (ICUs)
Total no. of ICUs 285
Medical ICU 100 (35.1)
Medical combined ICU 92 (32.3) Surgical combined ICU 33 (11.6)
Surgical ICU 28 (9.8)
Neurosurgical ICU 32 (11.2)
에서 ‘중환자실에 입실한 3일째부터 발생한 감 염’ 즉 캘린더데이(calendar day) 기준으로 변경되 었다. 둘째, 기존 진단기준에는 없었던 감염잠복 기(검체 채취일이나 영상검사 시행일, 검사나 시 술일을 기준으로 전후 3일간)와 ‘14일 이내에 같 은 종류의 감염이 추가적으로 발생한 경우에는 새로운 감염으로 보고하지 않고 이전 발생한 같 은 종류의 감염에 원인균을 추가’하는 동일감염 불가기간(repeat infection timeframe, RIT)의 개념 을 도입하였다. 셋째, 증상이 있는 요로감염과 폐 렴에서 기존에는 ‘다른 원인이 없는 발열’, ‘확인 된 다른 원인이 없는 발열’이라는 문구가 각각 진단기준에 있었으나 변경된 진단기준에는 이 문구가 삭제됨으로써 원인에 상관없이 발열이 있고 다른 기준이 맞으면 요로감염 혹은 폐렴으 로 진단할 수 있게 되었다. 넷째, 요로감염에서 Candida species는 요로감염의 진단기준으로 사용 할 수 없게 되었다. 이와 같이 의료관련감염의 진단기준이 일부 변경되었으며 이전 기준보다 사례에 대한 정의와 감염일 기준이 명료해진 측 면이 있다.
이 보고서는 이러한 여러 변화가 적용된 2016 년 7월부터 2017년 6월까지의 자료로 KONIS 중 환자실 부문의 열 번째 연간보고이다.
Materials and Methods
2016년 7월부터 2017년 6월까지 200병상 이상 의 총 193개 병원의 285개 성인 중환자실이 감시 에 참여하였다. 각 참여병원의 형태적 특성, 인력 구성 등 기초정보를 조사하였다. 참여병원이 200 병상 이상 규모의 병원으로 확대되면서 병상 규 모에 따라 200-299, 300-499, 500-699, 700-899병 상, 900병상 이상의 다섯 군으로 분류하여 분석 하였다. 연구 기간 동안 각 참여 중환자실에서 요로감염, 혈류감염, 폐렴에 대한 의료관련감염 감시를 수행하였다. 중환자실 의료관련감염과 요 로감염, 혈류감염, 폐렴의 정의는 미국 질병관리 본부(Center for Disease Control and Prevention, CDC)의 정의에 근거하였다[7,8].
요로감염은 ‘증상이 있는 요로감염(symptomat- ic urinary tract infection, SUTI)’과 ‘무증상 균혈증
요로감염(asymptomatic bacteremic urinary tract in- fection, ABUTI)’을 포함하였고 혈류감염은 ‘원인 균 확인 혈류감염(laboratory-confirmed bloodstream infection)’을 감시대상으로 하였다. 폐렴은 ‘임상 적 폐렴(clinically defined pneumonia, PNEU1)’,
‘원인균 확인 폐렴(pneumonia with specific labo- ratory findings, PNEU2)’과 ‘면역저하자 폐렴(pneu- monia in immunocompromised patients, PNEU3)’으 로 분류하였다[6]. 요로감염, 혈류감염과 폐렴에 서 각각 유치도뇨관, 중심정맥관, 인공호흡기와 의 관련 여부를 구분하였다. 의료관련감염률은 재원일수(patient-days, PD) 1,000일당 의료관련감 염 건수, 기구일수감염률은 기구일수(device-days, DD) 1,000일당 기구관련감염 건수, 기구사용비는 기구일수/재원일수로 계산하였다. 항생제 감수성
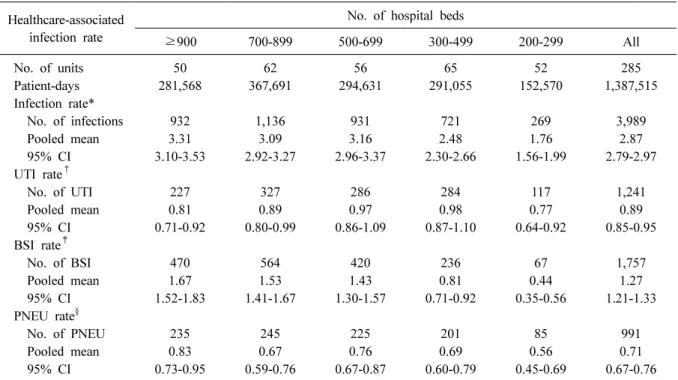
Table 2. Pooled means of healthcare-associated infection rates, by number of hospital beds, July 2016 through June 2017 Healthcare-associated
infection rate
No. of hospital beds
≥900 700-899 500-699 300-499 200-299 All
No. of units 50 62 56 65 52 285
Patient-days 281,568 367,691 294,631 291,055 152,570 1,387,515
Infection rate*
No. of infections 932 1,136 931 721 269 3,989
Pooled mean 3.31 3.09 3.16 2.48 1.76 2.87
95% CI 3.10-3.53 2.92-3.27 2.96-3.37 2.30-2.66 1.56-1.99 2.79-2.97
UTI rate
†No. of UTI 227 327 286 284 117 1,241
Pooled mean 0.81 0.89 0.97 0.98 0.77 0.89
95% CI 0.71-0.92 0.80-0.99 0.86-1.09 0.87-1.10 0.64-0.92 0.85-0.95
BSI rate
‡No. of BSI 470 564 420 236 67 1,757
Pooled mean 1.67 1.53 1.43 0.81 0.44 1.27
95% CI 1.52-1.83 1.41-1.67 1.30-1.57 0.71-0.92 0.35-0.56 1.21-1.33
PNEU rate
§No. of PNEU 235 245 225 201 85 991
Pooled mean 0.83 0.67 0.76 0.69 0.56 0.71
95% CI 0.73-0.95 0.59-0.76 0.67-0.87 0.60-0.79 0.45-0.69 0.67-0.76
*Pooled mean=(No. of UTIs, BSIs, or PNEUs/No. of patient-days)×1,000;
†Pooled mean=(No. of UTIs/No. of patient- days)×1,000;
‡Pooled mean=(No. of BSIs/No. of patient-days)×1,000;
§Pooled mean=(No. of PNEUs/No. of patient-days)×
1,000.
Abbreviations: UTI, urinary tract infection; BSI, bloodstream infection; PNEU, pneumonia; CI, confidence interval.
결과가 있는 주요 세균을 대상으로 항생제에 대 한 내성률을 조사하였고 중등도 내성은 내성에 포함하여 분석하였다. KONIS 의료관련감염감시 가 기구일수 감염률에 미친 영향을 분석하기 위 해 2016년 7월-2017년 6월 기간의 기구일수 감염 률 자료를 2012년 7월-2016년 6월 사이 4년간의 연간자료와 비교하였다[2,9-11]. 95% 신뢰구간 (confidence interval, CI)이 겹치지 않는 경우에 유 의한 차이가 있는 것으로 판단하였다.
Results
1. KONIS 참여병원과 참여중환자실의 특성 2016년 7월부터 2017년 6월까지 KONIS 중환 자실 부문에 참여한 병원과 중환자실의 특성은 Table 1과 같다. 참여병원이 전년도 103개에서 193개로 전년도 대비 87.4%인 90개 병원이 증가 하였다. 300-699병상 규모에서 35개(전년도 50개 대비 70%), 900병상 이상에서 4개(전년도 21개 대비 19%) 병원이 증가하였고 299개 이하 병상
병원 51개(26.4%)가 신규로 참여하였다. 감염관 리전담인력은 각 병원당 4.0명이었고 이들은 1인 당 평균 142병상을 담당하고 있었다. 감염내과 전문의는 병원당 0.9명이었다. 참여중환자실은 전년도 178개에서 285개로 107개가 증가하여 60%의 증가율을 보였다. 내과계 통합 중환자실 54개, 내과 중환자실 29개, 외과계 통합 중환자실 8개, 외과 중환자실 8개, 신경외과 중환자실 8개 가 증가하였다.
2. 중환자실 의료관련감염률
연구 기간 동안 총 3,989건의 의료관련감염이 보고되었다. 이 중 혈류감염이 1,757건(44.1%)으 로 가장 많았고 요로감염 1,241건(31.1%), 폐렴 991건(24.8%) 순이었다. 참여중환자실의 총 재원 일수는 1,387,515일이었다. 전체 의료관련감염률 은 2.87/1,000 PD (95% CI, 2.79-2.97)로 전년도 2.76/1,000 PD (95% CI, 2.65-2.87)과 차이가 없었 다[2]. 요로감염 발생률은 0.89/1,000 PD (95% CI, 0.85-0.95)로 전년도(0.76/1,000 PD [95% CI, 0.71-
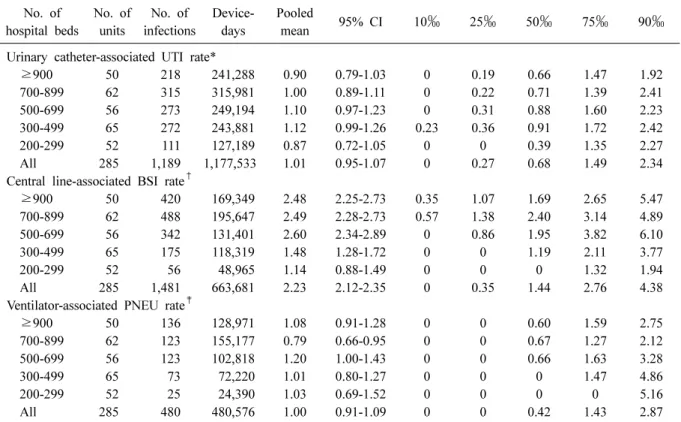
Table 3. Pooled means and percentiles of the device-associated infection rates, by number of hospital beds, July 2016 through June 2017
No. of hospital beds
No. of units
No. of infections
Device- days
Pooled
mean 95% CI 10 ‰ 25 ‰ 50 ‰ 75 ‰ 90 ‰
Urinary catheter-associated UTI rate*
≥900 50 218 241,288 0.90 0.79-1.03 0 0.19 0.66 1.47 1.92
700-899 62 315 315,981 1.00 0.89-1.11 0 0.22 0.71 1.39 2.41
500-699 56 273 249,194 1.10 0.97-1.23 0 0.31 0.88 1.60 2.23
300-499 65 272 243,881 1.12 0.99-1.26 0.23 0.36 0.91 1.72 2.42
200-299 52 111 127,189 0.87 0.72-1.05 0 0 0.39 1.35 2.27
All 285 1,189 1,177,533 1.01 0.95-1.07 0 0.27 0.68 1.49 2.34
Central line-associated BSI rate
†≥900 50 420 169,349 2.48 2.25-2.73 0.35 1.07 1.69 2.65 5.47
700-899 62 488 195,647 2.49 2.28-2.73 0.57 1.38 2.40 3.14 4.89
500-699 56 342 131,401 2.60 2.34-2.89 0 0.86 1.95 3.82 6.10
300-499 65 175 118,319 1.48 1.28-1.72 0 0 1.19 2.11 3.77
200-299 52 56 48,965 1.14 0.88-1.49 0 0 0 1.32 1.94
All 285 1,481 663,681 2.23 2.12-2.35 0 0.35 1.44 2.76 4.38
Ventilator-associated PNEU rate
‡≥900 50 136 128,971 1.08 0.91-1.28 0 0 0.60 1.59 2.75
700-899 62 123 155,177 0.79 0.66-0.95 0 0 0.67 1.27 2.12
500-699 56 123 102,818 1.20 1.00-1.43 0 0 0.66 1.63 3.28
300-499 65 73 72,220 1.01 0.80-1.27 0 0 0 1.47 4.86
200-299 52 25 24,390 1.03 0.69-1.52 0 0 0 0 5.16
All 285 480 480,576 1.00 0.91-1.09 0 0 0.42 1.43 2.87
*Pooled mean=(No. of urinary catheter-associated UTIs/No. of urinary catheter-days)×1,000;
†Pooled mean=(No. of cen- tral line-associated BSIs/No. of central line-days)×1,000;
‡Pooled mean=(No. of ventilator-associated PNEUs/No. of ven- tilator-days)×1,000.
Abbreviations: UTI, urinary tract infection; BSI, bloodstream infection; PNEU, pneumonia; CI, confidence interval.
0.82])에 비해 증가하였고, 혈류감염 발생률은 1.27/1,000 PD (95% CI, 1.21-1.33), 폐렴 발생률은 0.71/1,000 PD (95% CI, 0.67-0.76)로 전년도 자료 인 1.31/1,000 PD (95% CI, 1.24-1.3), 0.69/1,000 PD (95% CI, 0.64-0.75)와 비교할 때 유의한 차이 는 없었다(Table 2).
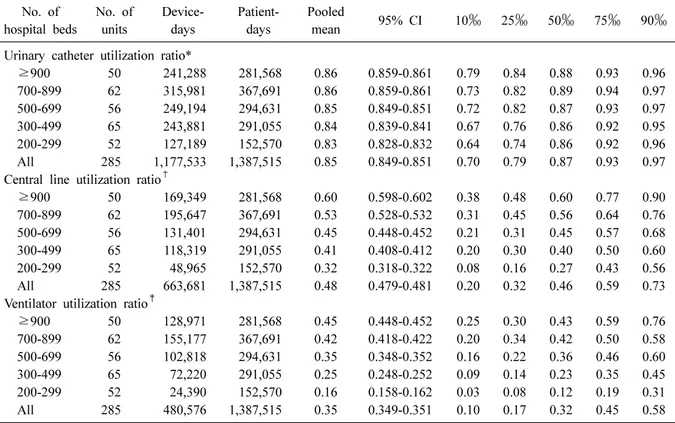
3. 기구관련 의료관련감염률과 기구사용비 요로감염 1,241건 중 1,189건(95.8%)이 유치도 뇨관과 관련이 있었다. 전체 유치도뇨관 기구일수 는 1,177,533일이었고, 유치도뇨관 관련 요로감염 (urinary catheter-associated UTI) 발생률은 1.01/1,000 DD (95% CI, 0.95-1.07)이었다(Table 3). 유치도뇨 관 사용비는 0.85 (95% CI, 0.849-0.851)이었다 (Table 4). 혈류감염 1,757건 중 1,481건(84.3%)이 중심정맥관과 관련된 것이었다. 전체 중심정맥관 기구일수는 663,681일이었고, 중심정맥관 관련 혈류감염(central line-associated BSI) 발생률은
2.23/1,000 DD (95% CI, 2.12-2.35)이었다. 중심정 맥관의 사용비는 0.48 (95% CI, 0.479-0.481)이었 다. 폐렴 991건 중 480건(48.4%)이 인공호흡기와 관련된 것이었다. 전체 인공호흡기 기구일수는 480,576일이었고, 인공호흡기 관련 폐렴 발생률 은 1.00/1,000 DD (95% CI, 0.91-1.09)이었다. 인공 호흡기의 기구사용비는 0.35 (95% CI, 0.349-0.351) 이었다.
4. 병상규모에 따른 기구관련 의료관련감염률 과 기구사용비
유치도뇨관 사용비는 병상규모가 커질수록 유 의하게 높았고 700-899와 900병상 이상의 병원은 유사하였다(Table 4). 유치도뇨관 관련 요로감염 률은 병상규모에 따라 유의한 차이는 없었다 (Table 3). 중심정맥관과 인공호흡기 기구사용비 역시 병상규모가 커질수록 기구사용비도 높은 경향을 보였다(Table 4). 중심정맥관 관련 혈류감
Table 4. Pooled means and percentiles of the distribution of device-utilization ratios, by number of hospital beds, July 2016 through June 2017
No. of hospital beds
No. of units
Device- days
Patient- days
Pooled
mean 95% CI 10 ‰ 25 ‰ 50 ‰ 75 ‰ 90 ‰
Urinary catheter utilization ratio*
≥900 50 241,288 281,568 0.86 0.859-0.861 0.79 0.84 0.88 0.93 0.96
700-899 62 315,981 367,691 0.86 0.859-0.861 0.73 0.82 0.89 0.94 0.97
500-699 56 249,194 294,631 0.85 0.849-0.851 0.72 0.82 0.87 0.93 0.97
300-499 65 243,881 291,055 0.84 0.839-0.841 0.67 0.76 0.86 0.92 0.95
200-299 52 127,189 152,570 0.83 0.828-0.832 0.64 0.74 0.86 0.92 0.96
All 285 1,177,533 1,387,515 0.85 0.849-0.851 0.70 0.79 0.87 0.93 0.97
Central line utilization ratio
†≥900 50 169,349 281,568 0.60 0.598-0.602 0.38 0.48 0.60 0.77 0.90
700-899 62 195,647 367,691 0.53 0.528-0.532 0.31 0.45 0.56 0.64 0.76
500-699 56 131,401 294,631 0.45 0.448-0.452 0.21 0.31 0.45 0.57 0.68
300-499 65 118,319 291,055 0.41 0.408-0.412 0.20 0.30 0.40 0.50 0.60
200-299 52 48,965 152,570 0.32 0.318-0.322 0.08 0.16 0.27 0.43 0.56
All 285 663,681 1,387,515 0.48 0.479-0.481 0.20 0.32 0.46 0.59 0.73
Ventilator utilization ratio
‡≥900 50 128,971 281,568 0.45 0.448-0.452 0.25 0.30 0.43 0.59 0.76
700-899 62 155,177 367,691 0.42 0.418-0.422 0.20 0.34 0.42 0.50 0.58
500-699 56 102,818 294,631 0.35 0.348-0.352 0.16 0.22 0.36 0.46 0.60
300-499 65 72,220 291,055 0.25 0.248-0.252 0.09 0.14 0.23 0.35 0.45
200-299 52 24,390 152,570 0.16 0.158-0.162 0.03 0.08 0.12 0.19 0.31
All 285 480,576 1,387,515 0.35 0.349-0.351 0.10 0.17 0.32 0.45 0.58
*Pooled mean=(No. of urinary catheter-days/No. of patient-days);
†Pooled mean=(No. of central line-days/No. of pa- tient-days);
‡Pooled mean=(No. of ventilator-days/No. of patient-days).
Abbreviations: UTI, urinary tract infection; BSI, bloodstream infection; PNEU, pneumonia; CI, confidence interval.
염률은 500병상 이상의 병원에서 200-499병상 규 모의 병원에 비해 유의하게 높았다(2.52/1,000 DD [95% CI, 2.38-2.66] vs. 1.38/1,000 DD [95% CI, 1.21-1.57]) (Table 3). 인공호흡기 관련 폐렴은 500-699 병상에서 700-899 규모의 병원에 비해 유의하게 높았다(1.20/1,000 DD [95% CI, 1.00- 1.43] vs. 0.79/1,000 DD [95% CI, 0.66-0.95]) (Table 3).
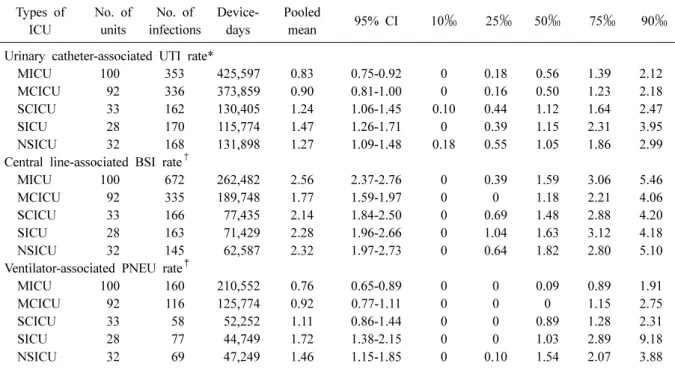
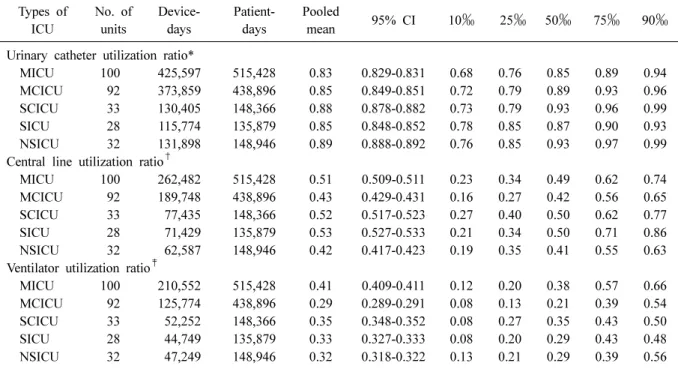
5. 중환자실 유형에 따른 기구관련 의료관련 감염률과 기구사용비
유치도뇨관 관련 요로감염 발생률은 내과 중 환자실(0.83/1,000 DD [95% CI, 0.75-0.92])과 내과 계 통합 중환자실(0.90/1,000 DD [95% CI, 0.81- 1.00])에서 외과계 통합 중환자실(1.24/1,000 DD [95% CI, 1.06-1.45]), 외과 중환자실(1.47/1,000 DD [95% CI, 1.26-1.71]), 신경외과 중환자실(1.27/
1,000 DD [95% CI, 1.09-1.48])에 비해 유의하게 낮았다. 중심정맥관 관련 혈류감염 발생률은 내
과중환자실(2.56/1,000 DD [95% CI, 2.37-2.76])에 서 내과계 통합중환자실(1.77/1,000 DD [95% CI, 1.52-2.06])에 비해 유의하게 높았다. 인공호흡기 관련 폐렴 발생률은 외과 중환자실(1.72/1,000 DD [95% CI, 1.38-2.15])에서 내과 중환자실 (0.76/1,000 DD [95% CI, 0.65-0.89])이나 내과계 통 합 중환자실(0.92/1,000 DD [95% CI, 0.77-1.11])에 비해 유의하게 높았다(Table 5). 유치도뇨관 사용 비는 내과 중환자실에서 가장 낮았으며(0.83 [95% CI, 0.829-0.831]), 신경외과 중환자실에서 가장 높았다(0.89 [95% CI, 0.888-0.892]). 중심정 맥관 사용비는 신경외과 중환자실에서 가장 낮 았고(0.42 [95% CI, 0.417-0.423]), 외과 중환자실 에서 가장 높았다(0.53 [95% CI, 0.527-0.533]). 인 공호흡기 사용비는 내과계 통합 중환자실에서 가장 낮았으며(0.29 [95% CI, 0.289-0.291]), 내과 중환자실에서 가장 높았다(0.41 [95% CI, 0.409-0.411]) (Table 6).
Table 5. Pooled means and percentiles of the distribution of device-associated infection rates, by type of ICU, July 2016 through June 2017
Types of ICU
No. of units
No. of infections
Device- days
Pooled
mean 95% CI 10 ‰ 25 ‰ 50 ‰ 75 ‰ 90 ‰
Urinary catheter-associated UTI rate*
MICU 100 353 425,597 0.83 0.75-0.92 0 0.18 0.56 1.39 2.12
MCICU 92 336 373,859 0.90 0.81-1.00 0 0.16 0.50 1.23 2.18
SCICU 33 162 130,405 1.24 1.06-1.45 0.10 0.44 1.12 1.64 2.47
SICU 28 170 115,774 1.47 1.26-1.71 0 0.39 1.15 2.31 3.95
NSICU 32 168 131,898 1.27 1.09-1.48 0.18 0.55 1.05 1.86 2.99
Central line-associated BSI rate
†MICU 100 672 262,482 2.56 2.37-2.76 0 0.39 1.59 3.06 5.46
MCICU 92 335 189,748 1.77 1.59-1.97 0 0 1.18 2.21 4.06
SCICU 33 166 77,435 2.14 1.84-2.50 0 0.69 1.48 2.88 4.20
SICU 28 163 71,429 2.28 1.96-2.66 0 1.04 1.63 3.12 4.18
NSICU 32 145 62,587 2.32 1.97-2.73 0 0.64 1.82 2.80 5.10
Ventilator-associated PNEU rate
‡MICU 100 160 210,552 0.76 0.65-0.89 0 0 0.09 0.89 1.91
MCICU 92 116 125,774 0.92 0.77-1.11 0 0 0 1.15 2.75
SCICU 33 58 52,252 1.11 0.86-1.44 0 0 0.89 1.28 2.31
SICU 28 77 44,749 1.72 1.38-2.15 0 0 1.03 2.89 9.18
NSICU 32 69 47,249 1.46 1.15-1.85 0 0.10 1.54 2.07 3.88
*Pooled mean=(No. of urinary catheter-associated UTIs/No. of urinary catheter-days)×1,000;
†Pooled mean=(No. of cen- tral line-associated BSIs/No. of central line-days)×1,000;
‡Pooled mean=(No. of ventilator-associated PNEUs/No. of ven- tilator-days)×1,000.
Abbreviations: ICU, intensive care unit; MICU, medical ICU; MCICU, medical combined ICU; SCICU, surgical com- bined ICU; SICU, surgical ICU; NSICU, neurosurgical ICU; UTI, urinary tract infection; BSI, bloodstream infection;
PNEU, pneumonia; CI, confidence interval.
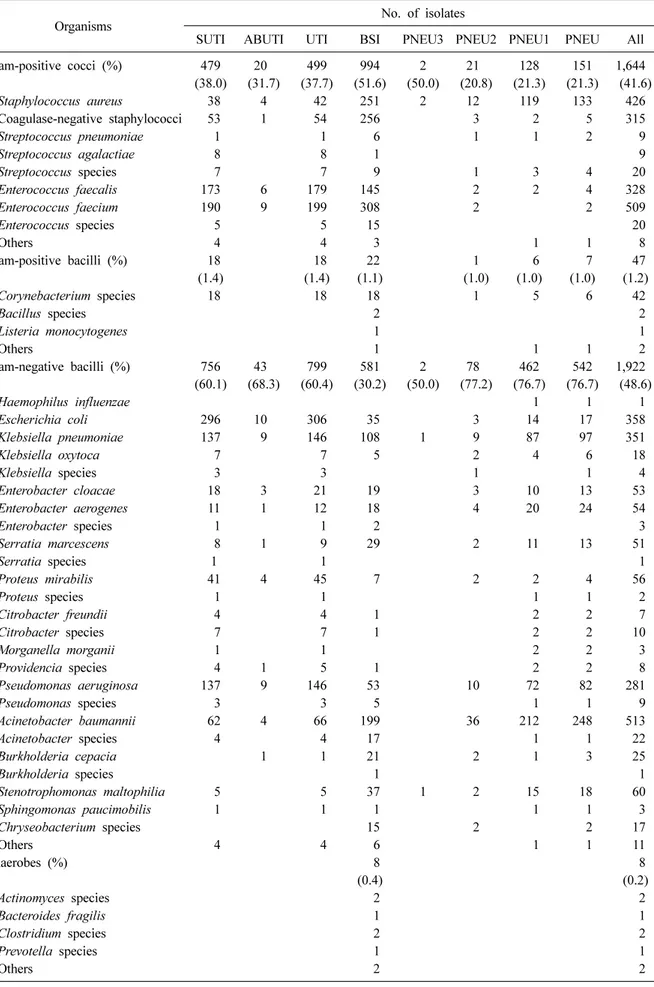
6. 원인미생물과 주요 미생물의 항생제 내성률 총 3,989건의 감염에서 3,955균주가 분리되었 다. 그람음성막대균 1,922 (48.6%), 그람양성알균 1,644 (41.6%), 진균 334 (8.4%)의 순이었다. 분리 된 미생물을 Table 7에 기술하였다. 요로감염에서 는 그람음성막대균이 60.4%로 가장 많았고 Esche- richia coli (23.1%, 306/1,322)가 가장 흔하게 분리 되었다. 혈류감염은 그람양성알균이 51.6%로 가장 흔하게 분리되었고 Enterococcus faecium (16.0%, 308/1,926), coagulase-negative staphylococci (13.3%, 256/1,926), Staphyococcus aureus (13.0%, 251/1,926) 순이었다. 폐렴에서는 그람음성막대균이 76.7%
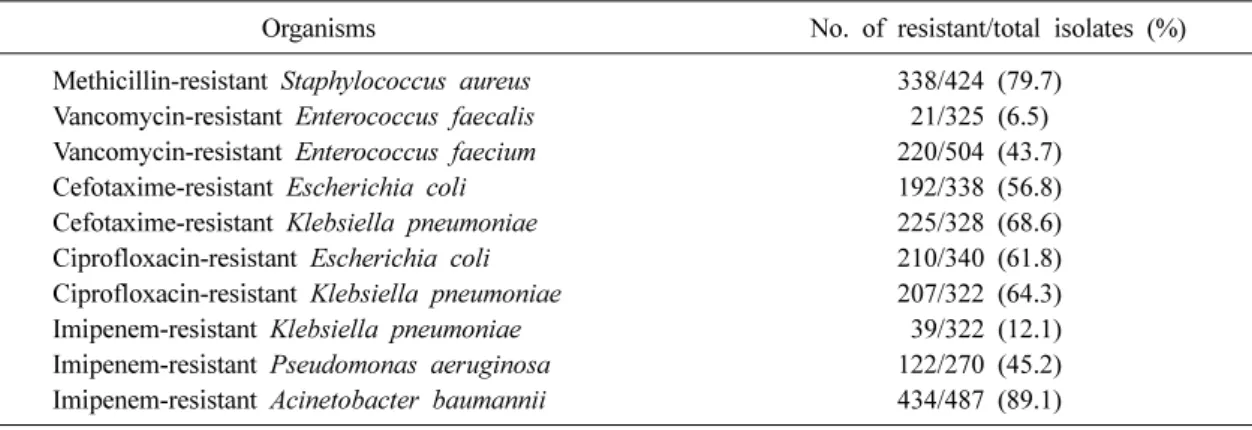
로 가장 많았고 Acinetobacter baumannii (35.1%, 248/707), S. aureus (18.8%, 133/707)가 흔하게 분리 되었다. 주요 세균의 주요 항생제에 대한 내성률 을 Table 8에 기술하였다. A. baumannii의 imipe- nem 내성률은 89.1%로 높았고 Klebsiella pneumo- niae의 imipenem 내성률은 12.1%였다.
7. 2012-2017년도의 기구사용비와 기구관련 의료관련감염률
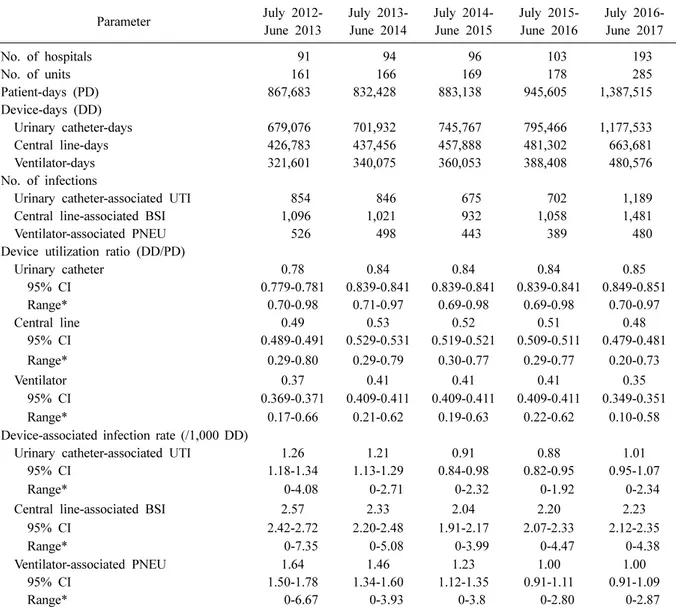
2016년 7월부터 2017년 6월까지 1년간의 기구 사용비와 기구일수 의료관련감염률을 이전 4년 간의 KONIS 자료와 비교하였다(Table 9). 유치도 뇨관 사용비와 유치도뇨관 관련 요로감염 발생 률은 전년도에 비해 증가하였다[11]. 중심정맥관 사용비는 전년도에 비해 감소하였으나 중심정맥 관 관련 혈류감염률은 유의한 차이가 없었다. 인 공호흡기 사용비는 전년도에 비해 감소하였으나 인공호흡기 관련 폐렴 발생률은 전년도와 비교 할 때 유의한 차이가 없었다. 인공호흡기 관련 폐렴은 2012년부터 지속적으로 감소하는 추세로 유지되었다.
Discussion
전국적인 의료관련감염 감시체계를 지속적으
Table 6. Pooled means and percentiles of the distribution of device-utilization ratios, by type of ICU, July 2016 through June 2017
Types of ICU
No. of units
Device- days
Patient- days
Pooled
mean 95% CI 10 ‰ 25 ‰ 50 ‰ 75 ‰ 90 ‰
Urinary catheter utilization ratio*
MICU 100 425,597 515,428 0.83 0.829-0.831 0.68 0.76 0.85 0.89 0.94
MCICU 92 373,859 438,896 0.85 0.849-0.851 0.72 0.79 0.89 0.93 0.96
SCICU 33 130,405 148,366 0.88 0.878-0.882 0.73 0.79 0.93 0.96 0.99
SICU 28 115,774 135,879 0.85 0.848-0.852 0.78 0.85 0.87 0.90 0.93
NSICU 32 131,898 148,946 0.89 0.888-0.892 0.76 0.85 0.93 0.97 0.99
Central line utilization ratio
†MICU 100 262,482 515,428 0.51 0.509-0.511 0.23 0.34 0.49 0.62 0.74
MCICU 92 189,748 438,896 0.43 0.429-0.431 0.16 0.27 0.42 0.56 0.65
SCICU 33 77,435 148,366 0.52 0.517-0.523 0.27 0.40 0.50 0.62 0.77
SICU 28 71,429 135,879 0.53 0.527-0.533 0.21 0.34 0.50 0.71 0.86
NSICU 32 62,587 148,946 0.42 0.417-0.423 0.19 0.35 0.41 0.55 0.63
Ventilator utilization ratio
‡MICU 100 210,552 515,428 0.41 0.409-0.411 0.12 0.20 0.38 0.57 0.66
MCICU 92 125,774 438,896 0.29 0.289-0.291 0.08 0.13 0.21 0.39 0.54
SCICU 33 52,252 148,366 0.35 0.348-0.352 0.08 0.27 0.35 0.43 0.50
SICU 28 44,749 135,879 0.33 0.327-0.333 0.08 0.20 0.29 0.43 0.48
NSICU 32 47,249 148,946 0.32 0.318-0.322 0.13 0.21 0.29 0.39 0.56
*Pooled mean=(No. of urinary catheter-days/No. of patient-days);
†Pooled mean=(No. of central line-days/No. of pa- tient-days);
‡Pooled mean=(No. of ventilator-days/No. of patient-days).
Abbreviations: ICU, intensive care unit; MICU, medical ICU; MCICU, medical combined ICU; SCICU, surgical com- bined ICU; SICU, surgical ICU; NSICU, neurosurgical ICU; UTI, urinary tract infection; BSI, bloodstream infection;
PNEU, pneumonia; CI, confidence interval.
로 운영함으로써 그 나라의 의료관련 감염률을 감소시킬 수 있다고 알려져 있다[12-14]. KONIS 도 2006년에 시작된 이후 감시 자료가 축적되면 서 중환자실 기구관련 의료관련감염률의 위험인 자와 원인균의 변화, 기구사용비와 기구관련 감 염률의 변화 등에 대해 분석한 바 있으며 KONIS 를 통한 지속적 감염감시가 감염률 감소에 기여 한다는 것을 보고하였다[15-18].
이번 열 번째 KONIS 중환자실 부문 연간보고 는 이전 자료와 비교할 때 참여병원의 특성과 진 단기준 등에서 많은 변화가 있었다. 참여병원의 기준이 300병상에서 200병상 이상으로 확대되면 서 193개 병원의 285개 중환자실이 참여하였고 이는 200병상 이상의 전체 참여 가능 기관 308개 (2015년 기준) 중 62.7%에 해당한다[19]. 전체 참 여병원 중 90개(46.6%)의 병원이 새로 KONIS에 참여하였고 500병상 이하 규모의 병원이 전년도 대비 324% 증가하였다[19]. 이러한 변화로 미루 어 전체 자료에 신규 참여병원의 영향이 클 것으
로 예상할 수 있고 주로 500병상 이하 규모 병원 의 감시 결과가 영향을 미쳤을 가능성이 있다.
따라서 이번 연간 자료는 이전의 결과와는 참여 병원의 규모가 다르다는 전제하에서 해석되어야 하겠다[5].
100병상당 감염관리전담인력 수는 0.70명으로 2013년 0.25명, 2014년 0.29명, 2015년 0.30명과 비교할 때 증가하였다[2,10,11]. 이는 2016년 9월 부터 시작된 감염예방관리료 지급 기준에 따라 신규 감염관리 전담인력이 배치된 영향으로 추 정된다[16]. 병원당 감염내과 전문의 수는 전년도 1.5명에서 0.9명으로 감소하였는데 신규 참여한 규모가 작은 병원에 감염내과 의사가 근무하는 경우가 적다는 것을 시사한다[2]. 신규 참여병원 의 중환자실은 내과계 통합 중환자실의 비율이 높았다. 중소 규모의 병원에서 KONIS 참여가 증 가하는 것은 의료관련감염 감시의 중요성과 필 요성에 대한 저변이 확대되는 면에서 바람직한 현상으로 생각된다. 그러나 KONIS 참여병원 수
Table 7. Number (%) of microorganisms isolated from clinical specimens of patients with healthcare-associated infections
Organisms
No. of isolates
SUTI ABUTI UTI BSI PNEU3 PNEU2 PNEU1 PNEU All
Gram-positive cocci (%) 479 (38.0)
20 (31.7)
499 (37.7)
994 (51.6)
2 (50.0)
21 (20.8)
128 (21.3)
151 (21.3)
1,644 (41.6)
Staphylococcus aureus 38 4 42 251 2 12 119 133 426
Coagulase-negative staphylococci 53 1 54 256 3 2 5 315
Streptococcus pneumoniae 1 1 6 1 1 2 9
Streptococcus agalactiae 8 8 1 9
Streptococcus species 7 7 9 1 3 4 20
Enterococcus faecalis 173 6 179 145 2 2 4 328
Enterococcus faecium 190 9 199 308 2 2 509
Enterococcus species 5 5 15 20
Others 4 4 3 1 1 8
Gram-positive bacilli (%) 18 (1.4)
18 (1.4)
22 (1.1)
1 (1.0)
6 (1.0)
7 (1.0)
47 (1.2)
Corynebacterium species 18 18 18 1 5 6 42
Bacillus species 2 2
Listeria monocytogenes 1 1
Others 1 1 1 2
Gram-negative bacilli (%) 756 (60.1)
43 (68.3)
799 (60.4)
581 (30.2)
2 (50.0)
78 (77.2)
462 (76.7)
542 (76.7)
1,922 (48.6)
Haemophilus influenzae 1 1 1
Escherichia coli 296 10 306 35 3 14 17 358
Klebsiella pneumoniae 137 9 146 108 1 9 87 97 351
Klebsiella oxytoca 7 7 5 2 4 6 18
Klebsiella species 3 3 1 1 4
Enterobacter cloacae 18 3 21 19 3 10 13 53
Enterobacter aerogenes 11 1 12 18 4 20 24 54
Enterobacter species 1 1 2 3
Serratia marcescens 8 1 9 29 2 11 13 51
Serratia species 1 1 1
Proteus mirabilis 41 4 45 7 2 2 4 56
Proteus species 1 1 1 1 2
Citrobacter freundii 4 4 1 2 2 7
Citrobacter species 7 7 1 2 2 10
Morganella morganii 1 1 2 2 3
Providencia species 4 1 5 1 2 2 8
Pseudomonas aeruginosa 137 9 146 53 10 72 82 281
Pseudomonas species 3 3 5 1 1 9
Acinetobacter baumannii 62 4 66 199 36 212 248 513
Acinetobacter species 4 4 17 1 1 22
Burkholderia cepacia 1 1 21 2 1 3 25
Burkholderia species 1 1
Stenotrophomonas maltophilia 5 5 37 1 2 15 18 60
Sphingomonas paucimobilis 1 1 1 1 1 3
Chryseobacterium species 15 2 2 17
Others 4 4 6 1 1 11
Anaerobes (%) 8
(0.4)
8 (0.2)
Actinomyces species 2 2
Bacteroides fragilis 1 1
Clostridium species 2 2
Prevotella species 1 1
Others 2 2
Table 7. Continued
Organisms
No. of isolates
SUTI ABUTI UTI BSI PNEU3 PNEU2 PNEU1 PNEU All
Fungi (%) 6
(0.5)
6 (0.5)
321 (16.7)
1 (1.0)
6 (1.0)
7 (1.0)
334 (8.4)
Candida albicans 1 1 131 1 4 5 137
Candida tropicalis 63 63
Candida glabrata 55 55
Candida parapsilosis 43 43
Candida species 1 1 20 1 1 22
Aspergillus species 1 1 1 2
Others 4 4 8 12
Total 1,259 63 1,322 1,926 4 101 602 707 3,955
Abbreviations: UTI, urinary tract infection; SUTI, symptomatic UTI; ABUTI, asymptomatic bacteremic UTI; BSI, blood- stream infection; PNEU, pneumonia
Table 8. Susceptibilities of major pathogens isolated from patients with healthcare-associated infections
Organisms No. of resistant/total isolates (%)
Methicillin-resistant Staphylococcus aureus 338/424 (79.7) Vancomycin-resistant Enterococcus faecalis 21/325 (6.5) Vancomycin-resistant Enterococcus faecium 220/504 (43.7)
Cefotaxime-resistant Escherichia coli 192/338 (56.8)
Cefotaxime-resistant Klebsiella pneumoniae 225/328 (68.6) Ciprofloxacin-resistant Escherichia coli 210/340 (61.8) Ciprofloxacin-resistant Klebsiella pneumoniae 207/322 (64.3)
Imipenem-resistant Klebsiella pneumoniae 39/322 (12.1)
Imipenem-resistant Pseudomonas aeruginosa 122/270 (45.2) Imipenem-resistant Acinetobacter baumannii 434/487 (89.1)
가 크게 증가한 것이 건강보험심사평가원의 의 료질향상분담금 지표 중 하나로 KONIS 참여 여 부가 포함된 영향이 크다는 점에서 감시 참여에 자발적인 측면이 약화된 점 역시 고려해야 하겠 다[5,19]. 새로 참여하는 병원에서 신뢰도 높은 자료를 제공할 수 있도록 지속적인 교육과 피드 백이 필요하며 2016년에 신규로 참여한 병원의 자료와 기존 참여병원의 자료를 비교하여 자료 의 질적 차이가 있는지도 추가적인 분석이 필요 하겠다.
기구관련 의료관련감염률 자료에서 유치도뇨 관 관련 요로감염 발생률은 전년도에 비해 증가 하였으나(1.01/1,000 DD [95% CI, 0.95-1.07] vs.
0.88/1,000 DD [95% CI, 0.82-0.95]) 중심정맥관 관련 혈류감염과 인공호흡기 관련 폐렴은 전년 도와 유의한 차이가 없었다[2]. 유치도뇨관 관련 요로감염의 증가는 병상 규모별로 유사한 양상
이었으며 900병상 이상(0.90/1,000 DD [95% CI, 0.79-1.03] vs. 0.83/1,000 DD [0.71-0.97]), 700-899 병상(1.00/1,000 DD [95% CI, 0.89-1.11] vs.
0.85/1,000 DD [95% CI, 0.76-0.96]), 300-699병상 (1.11/1,000 DD [95% CI, 1.02-1.20] vs. 0.95/1,000 DD [95% CI, 0.84-1.07])에서 모두 전년도에 비해 증가한 경향이었다(Table 3) [2]. 새로 참여한 200-299 병상 규모 병원들의 자료를 제외하고 분 석하더라도 유치도뇨관 관련 요로감염률은 1.03/1,000 DD (95% CI, 0.97-1.09)으로 전년도에 비해 증가하였다[2]. 2012년부터 2015년까지 요 로감염이 지속적으로 감소 추세였고 요로감염에 서 Candida species를 진단기준에 사용할 수 없게 된 점을 고려할 때 KONIS 요로감염의 진단기준 이 발열의 원인을 추정하여 제외하지 않는 것으 로 변경되어 요로감염 진단이 더 많이 되었을 가 능성이 있다. 유치도뇨관 사용비의 증가는 전년
Table 9. Comparison of the device utilization ratios and the rates of device-associated infections, July 2012 through June 2017
Parameter July 2012-
June 2013
July 2013- June 2014
July 2014- June 2015
July 2015- June 2016
July 2016- June 2017
No. of hospitals 91 94 96 103 193
No. of units 161 166 169 178 285
Patient-days (PD) 867,683 832,428 883,138 945,605 1,387,515
Device-days (DD)
Urinary catheter-days 679,076 701,932 745,767 795,466 1,177,533
Central line-days 426,783 437,456 457,888 481,302 663,681
Ventilator-days 321,601 340,075 360,053 388,408 480,576
No. of infections
Urinary catheter-associated UTI 854 846 675 702 1,189
Central line-associated BSI 1,096 1,021 932 1,058 1,481
Ventilator-associated PNEU 526 498 443 389 480
Device utilization ratio (DD/PD)
Urinary catheter 0.78 0.84 0.84 0.84 0.85
95% CI 0.779-0.781 0.839-0.841 0.839-0.841 0.839-0.841 0.849-0.851
Range* 0.70-0.98 0.71-0.97 0.69-0.98 0.69-0.98 0.70-0.97
Central line 0.49 0.53 0.52 0.51 0.48
95% CI 0.489-0.491 0.529-0.531 0.519-0.521 0.509-0.511 0.479-0.481
Range* 0.29-0.80 0.29-0.79 0.30-0.77 0.29-0.77 0.20-0.73
Ventilator 0.37 0.41 0.41 0.41 0.35
95% CI 0.369-0.371 0.409-0.411 0.409-0.411 0.409-0.411 0.349-0.351
Range* 0.17-0.66 0.21-0.62 0.19-0.63 0.22-0.62 0.10-0.58
Device-associated infection rate (/1,000 DD)
Urinary catheter-associated UTI 1.26 1.21 0.91 0.88 1.01
95% CI 1.18-1.34 1.13-1.29 0.84-0.98 0.82-0.95 0.95-1.07
Range* 0-4.08 0-2.71 0-2.32 0-1.92 0-2.34
Central line-associated BSI 2.57 2.33 2.04 2.20 2.23
95% CI 2.42-2.72 2.20-2.48 1.91-2.17 2.07-2.33 2.12-2.35
Range* 0-7.35 0-5.08 0-3.99 0-4.47 0-4.38
Ventilator-associated PNEU 1.64 1.46 1.23 1.00 1.00
95% CI 1.50-1.78 1.34-1.60 1.12-1.35 0.91-1.11 0.91-1.09
Range* 0-6.67 0-3.93 0-3.8 0-2.80 0-2.87
Abbreviations: ICU, intensive care unit; UTI, urinary tract infection; BSI, bloodstream infection; PNEU, pneumonia; CI, confidence interval.
*10th to 90th percentile range.
도에 비해 300-699 병상 병원에서 기구 사용비가 증가(0.84 [95% CI, 0.839-0.841] vs. 0.81 [0.809- 0.811])한 것이 영향을 미쳤을 가능성이 있다[2].
중심정맥관 기구사용비는 전년도에 비해 감소하 였으나 중심정맥관 혈류감염은 유의한 차이는 아니었지만 2015년에 이어 증가하는 경향이 지 속되었다. 특히, 새로 참여한 200-299병상 병원들 의 자료를 제외하면 감염률은 2.32/1,000 DD (95% CI, 2.20-2.44)로 2014년(2.04/1,000 DD [95%
CI, 1.91-2.17])에 비해 유의하게 증가하였다(Table 9). 중심정맥관 관련 혈류감염률의 증가 역시 병
상 규모별로 유사한 양상으로 900병상 이상 (2.48/1,000 DD [95% CI, 2.25-2.73] vs. 2.09/1,000 DD [95% CI, 1.86-2.35]), 700-899병상(2.49/1,000 DD [95% CI, 2.28-2.73] vs. 2.46/1,000 DD [95%
CI, 2.25-2.69]), 300-699병상(2.07/1,000 DD [95%
CI, 1.90-2.26] vs. 1.95/1,000 DD [95% CI, 1.74- 2.19]) 모두에서 유의하지는 않았으나 전년도에 비해 증가하는 경향을 보였다(Table 3) [2]. 인공 호흡기 기구사용비는 감소하였으며 인공호흡기 관련 폐렴은 유의한 차이가 없었다. 인공호흡기 관련 폐렴은 2015년까지 지속적으로 감소하는
추세였으며 2016년에 자료에서도 감소한 상태로 유지되고 있음을 알 수 있었다(Table 9).
중환자실 종류별로는 외과중환자실의 유치도 뇨관 관련 요로감염 감염률이 1.47/1,000 DD (95% CI, 1.26-1.71)로 전년도 0.99/1,000 DD (95%
CI, 0.81-1.21)에 비해 유의하게 증가하였다(Table 5) [2]. 인공호흡기 사용비는 모든 종류의 중환자 실에서 전년도에 비해 감소하였고 신경외과 중 환자실에서 인공호흡기 관련 폐렴 감염률이 1.46/
1,000 DD (95% CI, 1.15-1.85)으로 전년도 2.48/
1,000 DD (95% CI, 2.04-3.01)에 비해 유의하게 감소하였다(Table 5) [2].
주요 원인 미생물의 분포는 요로감염에서 Candida species를 진단기준에 포함하지 않게 되 면서 전체 의료관련감염과 요로감염의 원인 중 진균이 차지하는 비중이 각각 8.4%, 0.5%로 전년 도 17.6%, 29.6%와 비교할 때 크게 감소하였다 (Table 8) [2]. S. aureus의 메티실린 내성률은 79.7%
로 전년도 83.1%에 비해 감소하였고, A. bau- mannii의 imipenem 내성률은 89.1%로 전년도 90.2%
와 유사하였다. K. pneumoniae에서 322균주 중 39 균주가 imipenem에 내성으로 12.1%의 내성률을 보였다. 이는 전년도 14.7%에 비해서는 다소 감 소한 수치였다.
2006년에 처음 시작된 이후로 KONIS는 지금 까지 안정적이고 지속적으로 유지되고 있다.
KONIS는 시작 이후 전국적 규모로 지속적으로 확대되어 왔으나 2016년에는 특히 양적으로 크 게 확대되었다. 의료관련감염과 감염감시에 대한 인식이 확대되면서 전국적 규모의 의료관련감시 체계인 KONIS의 위상도 더욱 높아지고 있다. 참 여병원 증가에 따라 자료의 질 관리가 중요한 과 제이며 이제는 양적 성장뿐 아니라 질적 성장에 도 주의를 기울여야 할 것이다. 지속적으로 신뢰 도 높은 자료를 확보하기 위해서는 각 병원의 자 료에 대한 보안이 우선적으로 유지되어야 한다.
새로 참여하는 병원에서도 진단기준에 맞게 감 시를 잘 수행하고 정확한 자료를 입력하여 지속 적으로 KONIS 자료의 신뢰도를 유지할 수 있도 록 효율적인 교육 프로그램을 마련하고 지속적 인 피드백을 해야 할 것이다.
2016년 7월에서 2017년 6월까지 중환자실 의
료관련감염 자료를 분석한 결과 유치도뇨관 관 련 요로감염이 증가하였다. 감시기준의 변화와 참여병원 확대의 영향일 가능성을 배제할 수 없 으며 자료 해석에 주의가 필요하다. 신규 참여병 원의 비율이 높은 점을 기존 자료와 비교할 때 염두에 두어야 하고 감시 기준이 변경된 점 역시 고려하여야 하겠다.
Summary
배경: 전국의료관련감염감시체계(Korean National Healthcare-associated Infections Surveillance System, KONIS) 중환자실 부문에서 2016년 7월부터 2017 년 6월까지 감시를 수행한 열 번째 연간 자료 보 고이다.
방법: 전국에 있는 193개 병원의 285개 중환자 실에서 발생한 의료관련 요로감염, 혈류감염, 폐 렴에 대해 전향적으로 감시를 수행하였다. 의료 관련감염률과 기구관련 의료관련감염률은 1,000 재원일수(patient-days, PD) 또는 1,000 기구일수 (device-days, DD) 당 감염 건수로 구하였다. 기구 사용비는 기구일수/재원일수로 계산하였다.
결과: 총 3,989건의 의료관련감염이 발생하였 는데, 요로감염이 1,241건, 혈류감염이 1,757건, 폐렴이 991건이었다. 유치도뇨관 관련 요로감염 은 1,189건으로 1.01/1,000 DD (95% 신뢰구간, 0.95-1.07)이었고, 유치도뇨관 사용비는 0.85 (95%
신뢰구간, 0.849-0.851)로 각각 전년도의 0.88/1,000 DD (95% 신뢰구간, 0.82-0.95)와 0.84 (95% 신뢰 구간, 0.839-0.841)에 비해 높았다. 중심정맥관 관 련 혈류감염은 1,481건으로 감염률은 2.23/1,000 DD (95% 신뢰구간, 2.12-2.35)이었고, 중심정맥관 사용비는 0.48 (95% 신뢰구간, 0.479-0.481)였다.
인공호흡기 관련 폐렴은 480건으로 감염률은 1.00/1,000 DD (95% 신뢰구간, 0.91-1.09)이었고, 인공호흡기 사용비는 0.35 (95% 신뢰구간, 0.349- 0.351)이었다.
결론: 전년도 자료와 비교할 때 전체 의료관련 감염률은 유사하였으나 유치도뇨관 관련 요로감 염 발생률이 증가하였다.
Acknowledgements
전국의료관련감염감시체계 중환자실 부문에 참여해 주신 모든 참여병원 연구자 분들께 감사 드립니다.
References
1. Lee SO, Kim S, Lee J, Kim KM, Kim BH, Kim ES, et al. [Korean Nosocomial Infections Surveillance System (KONIS) report: data sum- mary from July through September 2006].
Korean J Nosocomial Infect Control 2006;11:
113-28.
2. Kwak YG, Choi YH, Choi JY, Yoo HM, Lee SO, Kim HB, et al. [Korean National Healthcare-associated Infections Surveillance System, intensive care unit module report: sum- mary of data from July 2015 through June 2016]. Korean J Healthc Assoc Infect Control Prev 2017;22:9-20.
3. Jeon MH, Park WB, Kim SR, Chun HK, Han SH, Bang JH, et al. [Korean Nosocomial Infections Surveillance System, intensive care unit module report: data summary from July 2010 through June 2011]. Korean J Nosocomial Infect Control 2012;17:28-39.
4. Lee SO, Kim ES, Kim HY, Park ES, Jin HY, Ki HK, et al. [Korean Nosocomial Infections Surveillance System, intensive care unit module report: data summary from July 2007 through June 2008]. Korean J Nosocomial Infect Control 2008;13:69-82.
5. Choi YH. [Prospective nationwide health- care-associated infection surveillance system in South Korea]. J Korean Med Assoc 2018;61:
21-5.
6. Choi YH, Kim SR. KONIS manual 2016.
Seoul: Korean Society for Korean Society for Nosocomial Infection Control, 2016.
7. Horan TC, Andrus M, Dudeck MA. CDC/NHSN surveillance definition of health care-associated
infection and criteria for specific types of in- fections in the acute care setting. Am J Infect Control 2008;36:309-32.
8. CDC. National Healthcare Safety Network (NHSN) overview. https://www.cdc.gov/nhsn/pdfs/
validation/2016/pcsmanual_2016.pdf (Updated on January 2016).
9. Jeon MH, Kim TH, Kim SR, Chun HK, Han SH, Bang JH, et al. [Korean Nosocomial Infections Surveillance System, intensive care unit module report: data summary from July 2012 through June 2013]. Korean J Nosocomial Infect Control 2015;20:37-48.
10. Kwak YG, Choi JY, Yoo H, Lee SO, Kim HB, Han SH, et al. [Korean Nosocomial Infections Surveillance System, intensive care unit module report: summary of data from July 2013 through June 2014]. Korean J Nosocomial Infect Control 2015;20:49-60.
11. Kwak YG, Choi JY, Yoo H, Lee SO, Kim HB, Han SH, et al. [Korean National Healthcare-as- sociated Infections Surveillance System, in- tensive care unit module report: summary of data from July 2014 through June 2015].
Korean J Healthc Assoc Infect Control Prev 2016;21:37-49.
12. Schwab F, Geffers C, Bärwolff S, Rüden H, Gastmeier P. Reducing neonatal nosocomial bloodstream infections through participation in a national surveillance system. J Hosp Infect 2007;65:319-25.
13. Haley RW, Culver DH, White JW, Morgan WM, Emori TG, Munn VP, et al. The efficacy of infection surveillance and control programs in preventing nosocomial infections in US hospitals. Am J Epidemiol 1985;121:182-205.
14. Gastmeier P, Geffers C, Brandt C, Zuschneid I, Sohr D, Schwab F, et al. Effectiveness of a na- tionwide nosocomial infection surveillance sys- tem for reducing nosocomial infections. J Hosp Infect 2006;64:16-22.
15. Choi JY, Kwak YG, Yoo H, Lee SO, Kim HB,
Han SH, et al. Trends in the distribution and antimicrobial susceptibility of causative patho- gens of device-associated infection in Korean intensive care units from 2006 to 2013: results from the Korean Nosocomial Infections Surveil- lance System (KONIS). J Hosp Infect 2016;92:
363-71.
16. Choi JY, Kwak YG, Yoo H, Lee SO, Kim HB, Han SH, et al. Trends in the incidence rate of device-associated infections in intensive care units after the establishment of the Korean Nosocomial Infections Surveillance System. J Hosp Infect 2015;91:28-34.
17. Kim EJ, Kwak YG, Park SH, Kim SR, Shin MJ, Yoo HM, et al. Trends in device utilization
ratios in intensive care units over 10-year peri- od in South Korea: device utilization ratio as a new aspect of surveillance. J Hosp Infect 2018;
100:e169-77.
18. Kwak YG, Lee SO, Kim HY, Kim YK, Park ES, Jin HY, et al. Risk factors for device-asso- ciated infection related to organisational charac- teristics of intensive care units: findings from the Korean Nosocomial Infections Surveillance System. J Hosp Infect 2010;75:195-9.
19. Choi YH. Operation of the Natiowide Surveillance System for healthcare-associated infection in intensive care unit. Osong: Korean Centers for Disease Control and Prevention;
2017. Report No.: 11-1352159-000871-01.