and automatic data capture [1]. This system which is the in- corporation of computational techniques and artificial intel- ligence in biomedicine has led to apply to the detection and progression of disease [2].
Many methods have been applied for pattern of classifica- tion in biostatistics communities. The main idea of these methods is called ‘divide-and-conquer principle that is often used to attack a complex problem by dividing it into simpler problems whose solutions can be combined to yield a solu- tion to the complex problem [3]. Utilizing this principle, Jacobs et al. [4] proposed a modular neural network archi- tecture class mixture of experts (ME). ME model consists of two networks, which is called expert and gating network.
Inputs are presented to the network, and each individual classifier makes an assessment. These outputs from the clas- sifiers are then weighted by the relevant gate, which produc- es a weight using the current inputs, and this is propagated further up the hierarchy [5]. Expectation-maximization (EM) algorithm have been introduced to the ME architecture so
A Mixture of Experts Model for the Diagnosis of Liver Cirrhosis by Measuring the Liver Stiffness
Sungmin Myoung, PhD1, Ji Hong Chang, PhD2, Kijun Song, PhD3
Departments of 1Medical Information and Administration, 2Occupational Therapy, Faculty of Health Science, Jungwon University, Goesan-gun;
3Department of Biostatistics, Yonsei University College of Medicine, Seoul, Korea
Objectives: The mixture-of-experts (ME) network uses a modular type of neural network architecture optimized for super- vised learning. This model has been applied to a variety of areas related to pattern classification and regression. In this re- search, we applied a ME model to classify hidden subgroups and test its significance by measuring the stiffness of the liver as associated with the development of liver cirrhosis. Methods: The data used in this study was based on transient elastography (Fibroscan) by Kim et al. We enrolled 228 HBsAg-positive patients whose liver stiffness was measured by the Fibroscan sys- tem during six months. Statistical analysis was performed by R-2.13.0. Results: A classical logistic regression model together with an expert model was used to describe and classify hidden subgroups. The performance of the proposed model was evaluated in terms of the classification accuracy, and the results confirmed that the proposed ME model has some potential in detecting liver cirrhosis. Conclusions: This method can be used as an important diagnostic decision support mechanism to assist physicians in the diagnosis of liver cirrhosis in patients.
Keywords: Mixture of Experts, Classification, Liver Stiffness, Medical Decision Support
Healthc Inform Res. 2012 March;18(1):29-34.
http://dx.doi.org/10.4258/hir.2012.18.1.29 pISSN 2093-3681 • eISSN 2093-369X
Submitted: February 21, 2012 Revised: March 26, 2012 Accepted: March 27, 2012 Corresponding Author Sungmin Myoung, PhD
Department of Medicial Information and Administration, Faculty of Health Science, Jungwon University, 85 Munmu-ro, Goesan-gun 367-805, Korea. Tel: +82-43-830-8604, Fax: +82-43-830-8679, E-mail: smmyoung@jwu.ac.kr
This is an Open Access article distributed under the terms of the Creative Com- mons Attribution Non-Commercial License (http://creativecommons.org/licenses/by- nc/3.0/) which permits unrestricted non-commercial use, distribution, and reproduc- tion in any medium, provided the original work is properly cited.
ⓒ 2012 The Korean Society of Medical Informatics
I. Introduction
Medical diagnostic decision support systems have become an established component of medical technology and their use will be growing, fueled by electronic medical records
that the training this network is a general statistical approxi- mation algorithm. The EM algorithm can be extended to provide an effective training mechanism for the MEs based on a Gaussian probability assumption. Jordan and Jacobs [3]
suggested that the ME architecture extended to a hierarchi- cal model called hierarchical mixture of experts.
Based on this, many applications using ME model were car- ried out. Ubeyli [1] applied diagnosis for breast cancer and diabetes, Subasi [6] used EEG signal classification for wave- let feature extraction, Jordan et al. [3] proposed decision support in the diagnosis of leukemia patients, and Raman et al. [7] present an infinite ME model to find an unknown number of subgroups within a given patient cohort based on survival analysis.
Transient elastography (Fibroscan; The Princess Grace Hos- pital, London, UK) is a rapid and non-invasive method to measure liver stiffness and this allows the assessment of liver fibrosis. In the past study, Kim et al. [8] suggested that the Fibroscan offered the best diagnostic performance both for significant fibrosis (F ≥ 2) and severe fibrosis-cirrhosis (F3- F4) by using logistic regression. But we need such an elabo- rate framework for identifying hidden subgroup along with their key characteristics versus other simple model.
The aim of this study was to apply ME model for classifying of the hidden subgroups and testing the significance of mea- suring the liver stiffness associated with the development of liver cirrhosis and explored the feasibility of the ME model in diagnostic decision support system.
The remainder of this paper is organized as follows. In second section, ME architecture used in this study is briefly explained and the liver stiffness data is described. Also, EM algorithm used for estimating the ME architecture is pre- sented. In third section, the application results of the ME networks to the liver fibrosis data are described. Finally, in the last section the study is concluded.
II. Methods
1. Liver Stiffness Data Overview
Liver fibrosis is the most important factor that determines the prognosis in chronic liver disease patients. Liver cirrhosis which is the extreme of liver fibrosis is an independent risk factor for liver cancer, chronic hepatitis B is the most impor- tant cause (62.5-73%) in Korea [9]. Liver biopsy is the gold standard for assessing liver fibrosis, but its invasive method can be risk of complications such as pain and bleeding.
Transient elastography (Fibroscan) is a rapid and non- invasive method to measure liver stiffness and this allow the assessment of liver fibrosis [8]. Researcher is under way to
learn more and physicians are to assess the diagnostic accu- racy of measuring the liver stiffness.
In this study, the liver stiffness data is taken from 228 HB- sAg positive patients whose liver stiffness was measured by Fibroscan between March 2005 and September 2005. Liver biopsy examinations were performed in 34 patients. The fi- brosis (F) was staged on a 0-4 scale according to the Ludwig classification. Kim et al. [8] concluded that Fibroscan is a reliable and rapid noninvasive method to diagnose the sever- ity of chronic liver disease and to predict fibrosis in patients with chronic hepatitis B in addition to using the aspartate aminotransferase-to-platelet ratio index (APRI) and aspar- tate aminotransferase/aspartate aminotransferase (AST/
ALT) ratio.
2. The Architecture of ME Model
In this subsection, we briefly review the ME architecture [4]
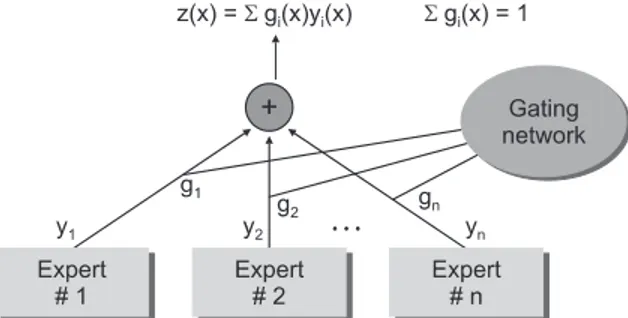
and the EM algorithm [3]. The ME architecture is shown in (Figure 1). The architecture is composed of a gating network sit at the nonterminals of a tree and several expert networks sit at leaves of a tree. The gating network receives the input vector x as input and produces scalar outputs that are parti- tion of unity at each point in the input space. Each expert network produces an output vector for each input vector.
These output vectors proceed up the tree, being mixture of the gating network outputs. The gating network provides linear combination coefficients as vertical probabilities for expert networks and, therefore, the final output of the ME architecture is a convex weighted sum of all the output vec- tors produced by expert networks. Suppose that there are N expert networks in the ME architecture. All the expert networks are linear with a single output nonlinearity that is also referred to as ‘generalized linear’ [10]. The i-th expert network produces its output oi(x) as a generalized linear function of the input x:
where Wi is a weight matrix and f(∙) is generally taken to be
Figure 1. The architecture of mixture of expert.
the logistic function or the identity function. These models are smoothed piecewise analogs of the corresponding gen- eralized log-linear model (GLIM) models [3]. The gating network is also generalized linear function, and its i-th out- put, g(x,vi), is the multinomial logit or softmax function of intermediate variables ξi [10]:
where ξi=viTx and vi is a weight vector. The overall output o(x) of the ME architecture is
The ME architecture can be given a probabilistic interpre- tation. For an input-output pair (x,y), the values of g(vi,x) are interpreted as the multinomial probabilities associated with the decision that terminates in a regressive process that maps x to y. Once the decision has been made, resulting in a choice of regressive process i, the output y is then chosen from a probability density P(y∣x,Wi), where Wi denotes the set of parameters or weight matrix of the i-th expert network in the model. Therefore, the total probability of generating y from x is the mixture of the probabilities of generating y from each component densities, where the mixing propor- tions are multinomial probabilities:
where Φ includes the expert network parameters as well as the gating network parameters. Moreover, the probabilistic component of the model is generally assumed to be a Ber- noulli distribution in the case of binary classification, a mul- tinomial distribution in the case of multiclass classification and a Gaussian distribution in the case of regression. Based on the probabilistic model, a learning algorithm for the ME architecture is treated as a maximum likelihood estimation problem. Jordan and Jacobs [3] have developed a learning algorithm for the ME architecture based on EM framework.
Suppose that the training set is given as x={(xt,yt)}Tt=1. The EM algorithm consists of two steps. In E-step, the posterior probabilities hi(t)(i=1,…,N), which can be interpreated as the probabilities P(i∣xt,yt) are computed for the s-th epoch:
The M-step solves the following maximization problems:
and
where V is the set of all the parameters in the gating net- work. Therefore, the EM algorithm is summarized as the fol- lowing [3]:
For each data pair (xt,yt), compute the posterior probabili- ties hi(t) using the current values of the parameters.
For each expert network i, solve the a maximization prob- lem in Wi(s+1) with observations {(xt,yt)}Tt=1 and observation weights {hi(t)}Tt=1.
For the gating network, solve the maximization problem in V(s+1) with observations {(xt,hk(t))}Tt=1.
Iterate by using the updated parameter values.
3. Application of Mixture of Experts to Liver Fibrosis Data The ME architecture used for the diagnosis of liver cirrhosis is shown in (Figure 2). Since two-group classification was in- vestigated exclusively, the ME was configured with two local experts and a gating network.
There are a total of 228 HBsAg positive patients whose liver stiffness was measured by Fibroscan between March 2005 and September 2005. The diagnosis of liver cirrhosis (LC) were considered such as LC with compensated, LC with de- compensated and hepatocellular carcinoma (HCC) cases.
Statistical analysis was performed by R 2.13.0 (software available at http://www.r-project.org). The characteristics of LC and non-LC patients were compared using two-sample t-test and chi-square test. Classical logistic regression model
Figure 2. Configured mixture of experts structure for diagnosis of liver cirrhosis.
and ME model was described, and classifying of the hidden subgroups.
Receiver operating characteristic (ROC) curves were shown for comparing classical logistic regression and ME model from this data for the validation of model.
III. Results
1. Characteristics of the Study Population
A total of 228 patients were enrolled in this study. The mean age of the patients was 45.9 years and 177 patients were male.
In diagnosis, 29 (12.7%) patients were inactive carrier, 106 (46.5%) patients had chronic hepatitis, 63 (27.6%) patients had LC with compensated, 26 patients had LC with decom- pensated and 4 (1.8%) patients were HCC. The mean age of the liver biopsy patients was 39.4 years and fibrosis stage 1
(portal fibrosis) was 4 (11.8%) patients, stage 2 (periportal fibrosis) was 12 (35.3%) patients, stage 3 (septal fibrosis) was 2 (5.9%) patients and stage 4 (cirrhosis) was 16 (47.1%) pa- tients (Table 1).
According to the clinical diagnosis, the median values of liver stiffness were 7.0 ± 2.7 kPa for inactive carriers (n = 29), 8.3 ± 5.3 kPa for chronic hepatitis patients (n = 106), 15.9 ± 8.3 kPa for compensated cirrhosis patients (n = 63), 31.8 ± 20.3 kPa for decompensated cirrhosis patients (n = 26), and 45.1 ± 34.5 kPa for HCC patients (n = 4). The degree of liver stiffness was statistically significant (p < 0.001) (Table 2).
2. Classfication of the Diagnosis of LC by Measuring the Liver Stiffness
In classification, the aim is to assign the input patterns to one of several classes, usually represented by outputs restricted to lie in the range from 0 to 1, so that they represent the probability of class membership [1]. While the classification is carried out, a specific pattern is assigned to a specific class Table 2. Liver stiffness according to the clinical diagnosis
Disease group Stiffness (kPa) p-value Inactive carrier 7.04 ± 2.7
Chronic hepatitis 8.26 ± 5.3 0.453
LC compensated 15.9 ± 8.3 <0.001 LC decompensated 31.8 ± 20.3 <0.001
HCC 45.1 ± 34.5 <0.001
LC: liver cirrhosis, HCC: hepatocellular carcinoma.
Table 3. Confusion matrix
Output/desired Result (low risk) Result (high risk)
Result (non-LC) 161 0
Result (LC) 8 59
LC: liver cirrhosis.
Table 1. Characteristics of the study patients
All (n = 228)
Biopsy (n = 34)
F3,F4 (n = 18)
Gender (M:F) 177:51 31:3 17:1
Age (years) 45.9 ± 10.2 39.4 ± 23.6 48.3 ± 7.3
BMI (kg/m2) 23.5 ± 2.7 23.6 ± 3.0 24.3 ± 1.9
AST (IU/L) 37.3 ± 21.9 43.3 ± 25.1 42.7 ± 21.4
ALT (IU/L) 46.5 ± 39.1 70 ± 59.7 58.5 ± 28.7
Total bilirubin (mg/dL) 1.1 ± 1.5 0.9 ± 0.6 0.9 ± 0.5
Platelet (103/mm3) 150 ± 62.9 171 ± 56.2 146 ± 42.8
Prothrombin time (%) 88.9 ± 15.5 87.7 ± 17.9 84.3 ± 10.9
Albumin (g/L) 4.3 ± 0.5 4.2 ± 0.5 4.0 ± 0.6
Diagnosis (Frequency, %) Fibrosis stage (Frequency, %)
Inactive Carrier 29 (12.7) F0 0
Chronic hepatitis 106 (46.5) F1 4 (11.8)
LC compensated 63 (27.6) F2 12 (35.3)
LC decompensated 26 (11.4) F3 2 (5.9)
HCC 4 (1.8) F4 16 (47.1)
according to the characteristic features selected for it. In this application, there were two classes: low risk and high risk.
Classification results of ME were displayed by a confusion matrix. The confusion matrix showing the classification re- sults of the ME is given as following (Table 3).
According to the confusion matrix, 8 patients were classi- fied incorrectly by ME as non-LC patient in low risk group and no patient was classified as non-LC in high risk group.
The values of statistical parameters are given in (Table 4).
The ME classified expert 1 (low risk) is lower parameter than expert 2 (high risk) except AST. Estimated gating networks are expert 1 (49.76%) and expert 2 (50.24%).
The performance of the ME model can be evaluated by plotting a ROC curve for the test (Figure 3). For a given re- sult obtained by a classifier system, four possible alternatives exist that describe the nature of the result: 1) true positive (TP), 2) false positive (FP), 3) true negative (TN), and 4) false negative (FN) [11]. ROC curves which are shown in (Figure 3) represent performances of the stand-alone logis- tic regression and ME structure in liver stiffness data. This shows that the performance of the ME is higher than that of the stand-alone logistic regression.
IV. Discussion
In this work, we have presented the use of ME structure to improve accuracy of liver cirrhosis detection in Fibroscan since the overall structure predictive performance is superior to any of the individual experts. In order to detect hidden- subgroup, two local experts and a gating network were used and these experts were divided by low/high risk group. The EM algorithm was used for estimating the ME structure, which is like the maximum problem. The classification re- sults which are the values of statistical parameters and ROC curves were presented for assessing performances of the ME and standalone logistic regression model in liver stiffness data. This shows that the performance of the ME is higher than that of the stand-alone logistic regression.
The proposed ME structure method for diagnostic decision support is a flexible approach that is applicable to assist phy- sicians in the treatment of liver cirrhosis patients. Extending the modified ME structure for the longitudinal data may be developed. Another extension interest is the ME structure for the censored data, simply modifying experts into Cox proportional hazard regression.
Conflict of Interest
No potential conflict of interest relevant to this article was reported.
Acknowledgments
This research was supported by Basic Science Research Pro- gram through the National Research Foundation of Korea (NRF) funded by the Ministry of Education, Science and Technology (2011-0013877).
References
1. Ubeyli ED. A mixture of experts network structure for Table 4. Parameter estimation for logistic regression and mixture of experts (ME) architecture in liver stiffness data
Variable Logistic regression ME architecture
Parameter estimate ± SE p-value Parameter estimate (expert 1) Parameter estimate (expert 2)
Liver stiffness -0.0014 ± 0.0153 0.3581 -0.0791 0.0047
AST 0.0912 ± 0.0134 <0.001 0.4251 0.0698
ALT -0.0468 ± 0.0084 <0.001 -0.1457 -0.0527
AFP -0.006 ± 0.0028 0.032 -0.0337 -0.0252
AST: aspartate aminotransferase, ALT: alanine aminotransferase, AFP: alpha-fetoprotein, SE: standard error.
Figure 3. Receiver operating characteristic (ROC) curves of the stand-alone logistic regression and mixture of experts network structure used for diagnosis of liver cirrhosis.
breast cancer diagnosis. J Med Syst 2005;29:569-79.
2. Corchado JM, De Paz JF, Rodríguez S, Bajo J. Model of experts for decision support in the diagnosis of leuke- mia patients. Artif Intell Med 2009;46:179-200.
3. Jordan MI, Jacobs RA. Hierarchical mixtures of experts and the EM algorithm. Neural Comput 1994;6:181-214.
4. Jacobs RA, Jordan MI, Nowlan SJ, Hinton GE. Adaptive mixtures of local experts. Neural Comput 1991;3:79-87.
5. Marsland S. Machine learning: an algorithmic perspec- tive. Boca Raton (FL): CRC Press; 2009.
6. Subasi A. EEG signal classification using wavelet feature extraction and a mixture of expert model. Expert Syst Appl 2007;32:1084-93.
7. Raman S, Fuchs TJ, Wild PJ, Dahl E, Buhmann JM, Roth V. Infinite mixture-of-experts model for sparse survival regression with application to breast cancer.
BMC Bioinformatics 2010;11 Suppl 8:S8.
8. Kim HS, Kim JK, Park YN, Myung SM, Pang MS, Youn KT, Lee KH, Paik YH, Lee KS, Ahn SH, Chon CY, Moon YM, Han KH. Non-invasive assessment of liver fibro- sis by measuring the liver stiffness and biochemical markers in chronic hepatitis B patients. Korean J Med 2007;72:459-69.
9. Myers RP, Tainturier MH, Ratziu V, Piton A, Thibault V, Imbert-Bismut F, Messous D, Charlotte F, Di Martino V, Benhamou Y, Poynard T. Prediction of liver histologi- cal lesions with biochemical markers in patients with chronic hepatitis B. J Hepatol 2003;39:222-30.
10. McCullagh P, Nelder JA. Generalized linear models.
New York (NY): Champman and Hall; 1983.
11. Zweig MH, Campbell G. Receiver-operating charac- teristic (ROC) plots: a fundamental evaluation tool in clinical medicine. Clin Chem 1993;39:561-77.