INTRODUCTION
Amyloidosis is a multisystemic disease characterized by extracellular deposition of abnormal fibrillar proteins in organs [1]. Amyloid deposition in heart muscles causes cardiac amyloidosis (CA), a leading cause of morbidity and
Regional Amyloid Burden Differences Evaluated Using Quantitative Cardiac MRI in Patients with Cardiac
Amyloidosis
Jin Young Kim
1, Yoo Jin Hong
2, Kyunghwa Han
2, Hye-Jeong Lee
2, Jin Hur
2, Young Jin Kim
2, Byoung Wook Choi
21Department of Radiology, Keimyung University School of Medicine, Daegu, Korea; 2Department of Radiology and Research Institute of Radiological Science, Severance Hospital, Yonsei University Medical Center, Seoul, Korea
Objective: This study aimed to investigate the regional amyloid burden and myocardial deformation using T1 mapping and strain values in patients with cardiac amyloidosis (CA) according to late gadolinium enhancement (LGE) patterns.
Materials and Methods: Forty patients with CA were divided into 2 groups per LGE pattern, and 15 healthy subjects were enrolled. Global and regional native T1 and T2 mapping, extracellular volume (ECV), and cardiac magnetic resonance (CMR)- feature tracking strain values were compared in an intergroup and interregional manner.
Results: Of the patients with CA, 32 had diffuse global LGE (group 2), and 8 had focal patchy or no LGE (group 1). Global native T1, T2, and ECV were significantly higher in groups 1 and 2 than in the control group (native T1: 1384.4 ms vs. 1466.8 ms vs. 1230.5 ms; T2: 53.8 ms vs. 54.2 ms vs. 48.9 ms; and ECV: 36.9% vs. 51.4% vs. 26.0%, respectively; all, p < 0.001).
Basal ECV (53.7%) was significantly higher than the mid and apical ECVs (50.1% and 50.0%, respectively; p < 0.001) in group 2. Basal and mid peak radial strains (PRSs) and peak circumferential strains (PCSs) were significantly lower than the apical PRS and PCS, respectively (PRS, 15.6% vs. 16.7% vs. 26.9%; and PCS, -9.7% vs. -10.9% vs. -15.0%; all, p < 0.001). Basal ECV and basal strain (2-dimensional PRS) in group 2 showed a significant negative correlation (r = -0.623, p < 0.001). Group 1 showed no regional ECV differences (basal, 37.0%; mid, 35.9%; and apical, 38.3%; p = 0.184).
Conclusion: Quantitative T1 mapping parameters such as native T1 and ECV may help diagnose early CA. ECV, in particular, can reflect regional differences in the amyloid deposition in patients with advanced CA, and increased basal ECV is related to decreased basal strain. Therefore, quantitative CMR parameters may help diagnose CA and determine its severity in patients with or without LGE.
Keywords: Magnetic resonance imaging; Myocardium; Heart; Mapping; Extracellular space; Feature tracking
Received: October 14, 2019 Revised: September 3, 2020 Accepted: September 28, 2020
Supported by a Basic Science Research Program through the National Research Foundation of Korea, funded by the Ministry of Science, Information and Communication Technology, and Future Planning (NRF-2017R1A2B4009661) and faculty research grant of Yonsei University College of Medicine (6-2016-0077).
Corresponding author: Yoo Jin Hong, MD, PhD, Department of Radiology and Research Institute of Radiological Science, Severance Hospital, Yonsei University Medical Center, 50 Yonsei-ro, Seodaemun-gu, Seoul 03722, Korea.
• E-mail: [email protected]
This is an Open Access article distributed under the terms of the Creative Commons Attribution Non-Commercial License (https://
creativecommons.org/licenses/by-nc/4.0) which permits unrestricted non-commercial use, distribution, and reproduction in any medium, provided the original work is properly cited.
mortality [2,3].
Features of CA include global circumferential late
gadolinium enhancement (LGE) patterns on cardiac magnetic resonance (CMR) imaging [4]. However, LGE patterns are not always visible and may be atypical or patchy [5-7].
Moreover, LGE imaging is sometimes challenging in patients
Korean J Radiol 2021;22(6):880-889https://doi.org/10.3348/kjr.2020.0579
retrospective study and waived the requirement for informed consent (IRB No. 4-2019-1269). Between March 2012 and December 2018, patients who underwent CMR imaging at our institution were searched.
The inclusion criteria were as follows: 1) endomyocardial biopsy (EMB) demonstrating amyloidosis in the
myocardium, or 2) positive noncardiac biopsy or DNA test results for amyloidosis and echocardiographic evidence of left ventricular (LV) wall thickening (mean LV thickness of the septum and posterior wall > 12 mm) and diastolic dysfunction [22]. Patients suspected of having other cardiac diseases were excluded. Fifteen controls without any history in our CMR registry were reviewed. Figure 1 explains our patient selection process. The patients’ functional states were assessed using the New York Heart Association (NYHA) functional classifications [23]. We also investigated low- voltage on the electrocardiogram (ECG).
CMR Protocol
All subjects underwent CMR with a 3T scanner (Magnetom Trio Tim, Siemens Healthineers) using a 6-element body matrix coil and spine matrix coil array. Two-chamber, 4-chamber, and short-axis (SA) cine images were acquired using a retrospectively ECG-gated, balanced steady- state free precession (true fast imaging with steady-state precession [TrueFISP]) sequence. Supplementary Materials summarizes these parameters.
T1 mapping images were acquired before contrast injection in 3 SA planes (basal, mid, and apical LV) using a modified look-locker inversion-recovery (MOLLI) sequence at the end-expiratory phase. A nonselective inversion pulse (TrueFISP single-shot readout sequence in the mid-diastolic with CA owing to diffuse amyloid deposition throughout the
heart, causing incorrect nulling [8]. CA shows a regional apical sparing pattern on 2-dimensional (2D) speckle tracking echocardiographic strain imaging [4,9]. These features help diagnose CA; however, they are not always found and are usually visible only in advanced CA [9,10].
The origin of the apical-sparing pattern of longitudinal strain in CA is not fully understood but may be related to lower amyloid burden in apical segments [11].
CMR is becoming the preferred imaging technique for the diagnosis of CA [12-16]. T1 mapping, an emerging technique, provides an objective means of diagnosing CA [4]. Native T1 and extracellular volume (ECV) are useful surrogate markers of amyloid burden in CA [3,12,13,16- 20]. CMR-feature tracking (FT) is another evolving method for the analysis of quantitative myocardial mechanics using routine cine images [15,21]. These quantitative parameters can objectively show regional and global abnormalities compared with conventional qualitative LGE image analysis.
We assumed that quantitative mapping and FT parameters would be useful for noninvasive global and regional amyloid deposition evaluation in the myocardium and may show different regional distribution patterns in patients with early and advanced CA.
This study aimed to investigate the regional amyloid burden and myocardial deformation using T1 mapping and strain values in patients with CA according to LGE patterns.
MATERIALS AND METHODS
Patients
Our Institutional Review Board approved this
Fig. 1. Patient selection. LGE = late gadolinium enhancement, LV = left ventricular, n = number of patients Patients with cardiac MRI (n = 42)
1) An endomyocardial biopsy demonstrates amyloidosis in the myocardium
2) A noncardiac biopsy is positive for amyloidosis and there is echocardiographic evidence of a thickened LV wall
Exclusion
• Combined other myocardial disease (n = 2)
Group 1 (n = 8)
Focal patchy or no LGE Group 2 (n = 32)
Diffuse and global LGE Enrolled patients (n = 40)
phase) was employed using the following parameters: field of view (FOV), 306 x 360 mm; acquisition matrix, 144 x 256 pixels; slice thickness (ST), 8 mm; repetition time (TR), 2.2 ms; echo time (TE), 1.1 ms; minimum inversion time, 100 ms; inversion time increment, 80 ms; flip angle (FA), 35°;
parallel acquisition technique factor, 2; and the number of inversions, 2 [“5,(3),3” sequence]. Fully automated, non- rigid motion correction was applied to register individual T1 images before inline T1 fitting was performed using a monoexponential 3-parameter fit.
T2 mapping images were acquired before contrast injection using a T2-prepared, single-shot TrueFISP
sequence along the same planes used for T1. The parameters were: TR/TE, 2.1/1.1 ms; FA, 70°; bandwidth, 930 Hz/
pixel; FOV, 379 x 308 mm
2; matrix, 192 x 126 pixels; ST, 8 mm; GeneRalized Autocalibrating Partial Parallel Acquisition (GRAPPA) factor, 2, with the acquisition on every fourth heartbeat; and T2 preparation times, 0, 25, and 55 ms. T2 pixel maps were generated by fitting pixel intensities onto a 2-parameter monoexponential signal model after automatic in-plane, non-rigid motion correction.
Post-contrast T1 mapping images were acquired 13 minutes after intravenous injection of 0.2 mmol/kg of gadolinium contrast (meglumine gadoterate [Dotarem], Guerbet) along the same 3 SA planes used for T1. The scheme for post-contrast T1 mapping was “4(1)3(1)2” using 3 inversion pulses.
Before post-contrast T1 mapping image acquisition, LGE CMR images were acquired 10 minutes after contrast injection using a magnitude- and phase-sensitive inversion- recovery-prepared TrueFISP sequence with the inversion time adjusted to null, thus representing a normal myocardium.
These LGE images were obtained along the same axis plane, covering the entire LV. Supplementary Materials summarizes these imaging parameters. The inversion time before LGE CMR imaging was determined using the fast low-angle shot sequence with varying inversion times (150 ms to 650 ms to null). Hematocrit levels were checked the day before CMR imaging.
CMR Image Analysis
Two expert radiologists (4 and 12 years of experience) analyzed the CMR images without the patients’ clinical information. After visual assessment and consensus between the radiologists, patients were divided into 2 subgroups:
group 1 (focal patchy or no LGE; images showed non- diffuse, discrete areas of LGE) (Fig. 2) and group 2 (diffuse
and global LGE; images showed diffuse subendocardial or transmural circumferential patterns) [24].
Other image analyses were performed using the cvi42 MR analysis software (Circle Cardiovascular Imaging Inc.).
For functional analysis, LV wall endocardial and epicardial borders were delineated manually on end-diastolic and end-systolic images on SA cine images. Left ventricular ejection fraction (LVEF) and LV mass were automatically calculated. LV wall thickness was measured at the septum and inferolateral wall at the end-diastolic phase; the mean value was used for analysis.
For native and post-contrast T1 and T2 mapping image analysis, mapping values were measured in 16 segments, excluding the apical segments. LV wall endocardial and epicardial borders were delineated manually and divided into 6 or 4 segments semiautomatically (Fig. 2). The myocardial edges were excluded by applying a 10% offset to minimize the partial volume artifact. LV blood pool T1 values were measured using a circular region of interest
> 10 mm
2, avoiding the papillary muscle. Myocardial ECV was calculated with the following equation using the LV myocardium and blood pool native and post-contrast T1 values and hematocrit values:
ECV (%) = (ΔR1 of myocardium/ΔR1 of LV blood pool) x (1 - hematocrit) x 100
R1 = 1/T1, ΔR1 = (post-contrast R1-pre-contrast R1), The global native T1 (ms), ECV (%), and T2 (ms) were the mean values of the 16 LV segments. The basal, mid, and apical native T1, ECV, and T2 were the mean values of the 6 basal LV segments, 6 mid LV segments, and 4 LV apical segments, respectively.
CMR-FT Analysis
For the FT analysis, the 2-chamber, 4-chamber, and SA cine images were loaded onto the software. The LV endocardial and epicardial borders were delineated semiautomatically. Global 2D peak longitudinal strain (PLS), regional (basal, mid, apical) 2D peak radial strain (PRS), and 2D peak circumferential strain (PCS) values were obtained. Comparisons were performed using absolute values, as negative values implied strain direction.
Echocardiography
In patients with CA, transthoracic echocardiography
was performed before CMR. Echocardiographic LVEF was
determined using the biplane method of disk summation
(modified Simpson’s rule) [25]. LV diastolic dysfunction was
Shapiro-Wilk test. ANOVA was used to evaluate global native T1, T2, and ECV and strain parameter differences across the 3 groups. We corrected the significance level using the Bonferroni adjustment for post-hoc analysis.
Differences between the groups and regions (basal vs.
mid vs. apical) were evaluated with a linear mixed model that included random effects for subjects, to consider multiple measurements per subject, and fixed effects for evaluated using the fraction of early diastolic mitral inflow
velocity/early diastolic mitral annular velocity (E/E’) [26].
Statistical Analysis
Categorical baseline characteristics were expressed as numbers and percentages and continuous variables as mean values and standard deviations or medians with interquartile ranges. Normal distribution was determined using the
105.00%
105.00%
0.00%
0.00%
32.7
61.0 40.5
66.6 37.8
67.0 39.0
63.8 39.8
64.3 37.4
58.2 36.9
53.4 33.8
58.9 38.8
62.6 34.8
57.1 37.8
59.3 35.4
60.8 38.5
56.0 36.2
51.9 36.9
57.5 38.3
60.9 ECV75.0 mm (AHA)
ECV85.5 mm (AHA) D
G
A B
E
C
F
H Fig. 2. Cardiac MRI of patients.
A patient in group 1 showing focal patchy LGE (arrow) at the mid ventricular inferolateral wall (A). A patient in group 2 showing diffuse global LGE (E). Mapping and ECV values were obtained using a software (Circle Cardiovascular Imaging Inc.). The endocardial and epicardial borders of the left myocardium were delineated manually and divided into 16 segments according to the recommendations of the AHA. ECV values were automatically calculated using the software. The measurement of mapping and ECV values of a patient in group 1 (B, C, D) and a patient in group 2 (F, G, H). AHA = American Heart Association, ECV = extracellular volume, LGE = late gadolinium enhancement
group, region, and interaction between group and region.
Comparison analyses were also performed between the types of amyloidosis. Pearson’s or Spearman’s correlation coefficients were calculated to assess correlations between ECV and strain values. Statistical tests were 2-sided, and p <
0.050 was considered significant. Statistical analyses were performed using SAS (version 9.4, SAS Institute Inc.).
RESULTS
Patients
Forty patients with CA were included in this study.
Seventeen patients had EMB-confirmed CA. Twenty-three had CA confirmed by noncardiac biopsy (liver, 4; kidney, 7; abdominal fat, 2; stomach, 1; bone marrow, 8) or DNA test (n = 1), and the presence of a thickened LV wall or diastolic dysfunction, without any other known cause for LV thickening. Of the 40 patients, 32 had amyloid light-chain (AL) amyloidosis, 6 had transthyretin (TTR) amyloidosis, and 2 had other types of amyloidosis. AL amyloidosis was confirmed by serum-free light-chain levels and bone marrow biopsy. TTR amyloidosis was confirmed by 99m pyrophosphate scans.
Using LGE patterns, 32 patients were classified into group 2 and 8 into group 1. All group 2 patients showed LGE patterns typical of CA (diffuse circumferential LGE from endocardium to epicardium). Three group 1 patients showed no LGE, and 5 showed focal LGE (involving 1 segment in
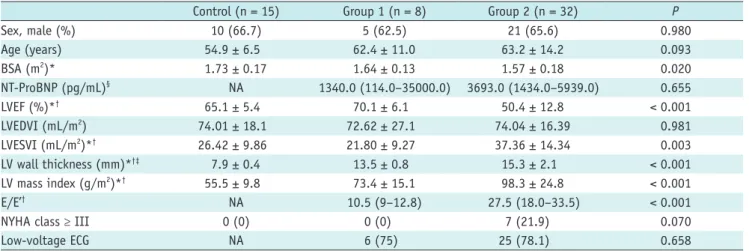
2 patients, 2 segments in 2 patients, and 3 segments in 1 patient). Table 1 summarizes the baseline characteristics of the groups. Group 2 had significantly lower LVEF (50.4
± 12.8%) than group 1 and the control group (70.1 ± 6.1% and 65.1 ± 5.4%, respectively). Group 2 showed significantly higher LV wall thickness and LV mass than group 1 (thickness: 15.3 mm vs. 13.5 mm; mass: 98.3 g/m
2vs. 73.4 g/m
2, respectively). Only group 2 included patients with NYHA functional class ≥ III (7 patients, 21.9%, p = 0.070). Groups 1 and 2 had similar low-voltage ECG frequencies (75.0% vs. 78.1%, p = 0.658).
T1 and T2 Mapping Parameters Intergroup Difference
Table 2 summarizes the mapping and ECV values of the 3 groups. Global native T1 and ECV were significantly different across the groups. The values were significantly higher in group 2 (1466.8 ms and 51.4%, respectively) than in group 1 (1384.4 ms and 36.9%, respectively) and the control group (1230.5 ms and 26.0%, respectively; p < 0.001).
The values were significantly higher in group 1 than in the control group (all, p < 0.001). The global T2 in groups 1 and 2 were higher than in the control group (53.8 ms vs.
54.2 ms vs. 48.9 ms, respectively; p = 0.001). There was no statistically significant difference in the global T2 between groups 1 and 2.
Table 1. Baseline Characteristics and Functional Parameters of the Study Population
Control (n = 15) Group 1 (n = 8) Group 2 (n = 32) P
Sex, male (%) 10 (66.7) 5 (62.5) 21 (65.6) 0.980
Age (years) 54.9 ± 6.5 62.4 ± 11.0 63.2 ± 14.2 0.093
BSA (m2)* 1.73 ± 0.17 1.64 ± 0.13 1.57 ± 0.18 0.020
NT-ProBNP (pg/mL)§ NA 1340.0 (114.0–35000.0) 3693.0 (1434.0–5939.0) 0.655
LVEF (%)*† 65.1 ± 5.4 70.1 ± 6.1 50.4 ± 12.8 < 0.001
LVEDVI (mL/m2) 74.01 ± 18.1 72.62 ± 27.1 74.04 ± 16.39 0.981
LVESVI (mL/m2)*† 26.42 ± 9.86 21.80 ± 9.27 37.36 ± 14.34 0.003
LV wall thickness (mm)*†‡ 7.9 ± 0.4 13.5 ± 0.8 15.3 ± 2.1 < 0.001
LV mass index (g/m2)*† 55.5 ± 9.8 73.4 ± 15.1 98.3 ± 24.8 < 0.001
E/E’† NA 10.5 (9–12.8) 27.5 (18.0–33.5) < 0.001
NYHA class ≥ III 0 (0) 0 (0) 7 (21.9) 0.070
Low-voltage ECG NA 6 (75) 25 (78.1) 0.658
Unless otherwise indicated, data are presented as mean ± standard deviation or median (25–75th interquartile ranges). *Statistical significance between groups 2 and the control group, †Statistical significance between group 1 and 2, ‡Statistical significance between group 1 and control groups, §NT-ProBNP values were available for 27 patients in group 2. BSA = body surface area, ECG = electrocardiogram, E/E’ = ratio of early mitral inflow velocity to mitral annular early diastolic velocity, LV = left ventricular, LVEDV = LV end-diastolic volume, LVEF = LV ejection fraction, LVESV = LV end-systolic volume, NA = not available, NT-ProBNP = N-terminal pro b-type natriuretic peptide, NYHA = New York Heart Association
all, p > 0.050). There were no interregional native T1 and T2 differences in any group (all, p > 0.050).
CMR-FT Analysis Intergroup Differences
The absolute values of all strain parameters were significantly lower in group 2 than in group 1 and the control group (-9.2% vs. -14.5% vs. -18.1% in global longitudinal strains, respectively; all, p < 0.001) (Table 3).
Interregional Difference
The control group’s apical ECV (28.8%) was higher than its basal and mid ECVs (25.9% and 25.8%, respectively), which is a known feature [27]. In group 2, there was a reverse pattern of ECV differences between the basal, mid, and apical regions (p < 0.001) (Fig. 3). The basal ECV (53.7%) was significantly higher than the mid and apical ECVs (50.1% and 50.0%, respectively).
In group 1, there were no significant interregional ECV differences (basal: 37.0%, mid: 35.9%, and apical: 36.9%;
Table 2. Myocardial Tissue Characterization by Cardiac Magnetic Resonance Imaging
Control (n = 15) Group 1 (n = 8) Group 2 (n = 32) P
Native T1 (ms)
Basal*†‡ 1221.0 (1197.9,1244.0) 1384.8 (1343.1, 1426.52) 1472.1 (1443.7,1500.5) < 0.001 Mid*†‡ 1222.0 (1194.0, 1250.1) 1379.0 (1302.3, 1455.7) 1454.9 (1414.8, 1495.1) < 0.001 Apical*†‡ 1248.6 (1244.4, 1285.8) 1389.4 (1330.0, 1448.7) 1473.5 (1432.8, 1514.1) < 0.001 Global*†‡ 1230.5 (1203.1, 1258.0) 1384.4 (1328.9, 1439.9) 1466.8 (1433.3, 1500.3) < 0.001 ECV (%)
Basal*†‡ 25.9 (24.1, 27.6) 37.0 (33.0, 41.0) 53.7 (50.5, 57.0) < 0.001
Mid*†‡ 25.8 (27.0, 30.6) 35.9 (31.1, 40.7) 50.1 (46.9, 53.3) < 0.001
Apical*†‡ 28.8 (27.0, 30.6) 38.3 (33.1, 43.6) 50.0 (47.0, 53.0) < 0.001
Global*†‡ 26.0 (24.9, 27.0) 36.9 (32.4, 41.4) 51.4 (48.3, 54.5) < 0.001
T2 (ms)
Basal†‡ 48.9 (46.7, 51.0) 53.6 (51, 56.2) 53.9 (52.4, 55.4) 0.001
Mid†‡ 48.7 (45.6, 51.7) 53.3 (50.7, 56) 54.1 (52.5.55.6) < 0.001
Apical†‡ 49.9 (46.8, 53.0) 54.4 (51.8, 57) 54.7 (53.2, 56.2) < 0.001
Global†‡ 48.9 (46.9, 51.0) 53.8 (51.5, 56.1) 54.2 (52.8, 55.6) 0.001
Data are presented as mean (95% confidence interval). *Statistical significance between groups 1 and 2, †Statistical significance between group 1 and the control group, ‡Statistical significance between group 2 and the control group. ECV = extracellular volume
Fig. 3. Three regional ECV, native T1, and T2 values of 3 groups.
A. Regional ECV values across the 3 groups. In the 3 regions, ECV is the highest in group 2, followed by group 1 and the control group. Regional differences show that in group 2, basal ECV was significantly higher than mid and apical ECVs (both, p < 0.001). In group 1, there was no regional difference. In the control group, apical ECV was higher than basal and mid ECVs. There were significantly different regional patterns between the groups and segments (p < 0.001). B. Regional native T1 values across the 3 groups. In the 3 regions, native T1 is the highest in group 2, followed by group 1 and the control group. There were no significant differences in the regional patterns across the groups and regions (p = 0.855). C. Regional T2 values across the 3 groups. In the 3 regions, T2 is the highest in group 2, followed by group 1 and the control group.
There were no significant differences in the regional pattern across the groups (p = 0.991). ECV = extracellular volume 60
50
40
30
20
10
60
55
50
45
40 1600
1500 1400 1300 1200 1100 1000
ECV (%) T2 (ms)
Native T1 (ms)
Basal Mid Apical Basal Mid Apical Basal Mid Apical
Region Region Region
Group 1 Group 2 Control
Group 1 Group 2 Control Group 1
Group 2 Control
A B C
Interregional Differences
Significant interregional strain pattern differences were found in group 2 (p < 0.001). Basal and mid 2D PRSs were significantly lower than the apical 2D PRS (basal vs. mid vs. apical: 15.6% vs. 16.7% vs. 26.9%; all, p < 0.001).
There were no significant interregional 2D PRS differences in group 1 (basal vs. mid vs. apical: 45.8% vs. 42.3% vs.
47.3%; p = 0.263).
2D PCS showed a similar pattern. In group 2, basal and mid 2D PCSs were significantly lower than apical 2D PCS (basal vs. mid vs. apical: -9.7% vs. -10.9% vs. -15%; p <
0.001). There were no significant interregional differences in 2D PCS in group 1 (basal vs. mid vs. apical: -19.2% vs.
-20.5% vs. -21.8%; p = 0.234).
Correlation between ECV and Functional Parameters In group 2, there were positive correlations between basal 2D PRS and basal ECV and between 2D PCS and basal ECV (r = -0.623 and r = -0.607, respectively) (Supplementary Table 1). The strain parameters of the mid and apical regions and ECV were not significantly correlated in group 2. In group 1 and the control group, most strain parameters were not significantly correlated with ECV.
Comparison between the Types of Amyloidosis
Supplementary Table 2 summarizes the mapping and ECV values of the AL and TTR groups. There were no significant differences in native T1, T2, and ECV across the groups (all, p > 0.050). A significant interregional difference was observed in the AL group (p = 0.004), but not in the TTR group (p = 0.220). In the AL group, basal ECV (51.3%) was
significantly higher than mid and apical ECVs (48.3% and 48.9%, respectively; p = 0.004). In the TTR group, basal ECV (55.1%) was also higher than mid and apical ECVs (52.0%
and 51.3%, respectively); however, there was no significant interregional difference (p = 0.220).
DISCUSSION
This study evaluated regional and global amyloid burden and strain patterns using quantitative CMR parameters in patients with CA, who were divided into 2 groups according to the LGE pattern. Native T1 and ECV were useful in diagnosing early CA, even when there was focal patchy or no LGE. Additionally, patients with advanced CA and diffuse LGE showed a characteristic “basal predominant pattern” in terms of both ECV and CMR strain values.
We included 40 patients with CA based on previous criteria [22]. CA was diagnosed if an EMB demonstrated amyloidosis in the myocardium or if echocardiographic evidence of CA was found in a patient with a positive noncardiac biopsy result [22,28]. Echocardiographic features of CA include an LV wall thickness > 12 mm and no other potential causes of LV hypertrophy [22,29]. Although EMB is the gold standard for diagnosing many cardiomyopathies, it has limitations, including procedural risk and sampling error potential. Therefore, in clinical practice, CA diagnoses are often made via noncardiac biopsies and noninvasive imaging techniques.
CMR imaging is a well-established, noninvasive method for diagnosing CA with a characteristic global subendocardial LGE on the LV myocardium [30,31].
Table 3. Strain Parameters by Feature Tracking
Control (n = 15) Group 1 (n = 8) Group 2 (n = 32) P
2D PRS (%)
Basal*† 40.5 (35.7, 45.2) 45.8 (39.3, 52.3) 15.6 (12.5, 18.6) < 0.001
Mid*† 40.2 (35.5, 44.8) 42.3 (35.1, 49.6) 16.7 (13.7, 19.8) < 0.001
Apical*† 53.4 (46.4, 60.4) 47.3 (35.9, 58.7) 26.9 (23.8, 29.9) < 0.001
Global*† 41.8 (37.9, 45.7) 44.2 (38.4, 49.9) 19.9 (17.1, 22.6) < 0.001
2D PCS (%)
Basal*† -19.8 (-21.5, -18.1) -19.2 (-21.9, -16.6) -9.7 (-11.1, -8.2) < 0.001
Mid*† -21.2 (-22.8, -19.5) -20.5 (-23.1, -17.9) -10.9 (-12.3, -9.5) < 0.001
Apical*† -24.4 (-26.1, -22.6) -21.8 (-24.4, -19.1) -15 (-16.4, -13.5) < 0.001
Global*† -20.7 (-22.7, -18.7) -20.8 (-23.1, -18.4) -11.8 (-13.1, -10.6) < 0.001 2D PLS (%)
Global*† -18.1 (-19.9, -16.2) -14.5 (-16.6, -12.4) -9.2 (-10.3, -8.1) 0.001
Data are presented as mean (95% confidence interval). *Statistical significance between groups 1 and 2, †Statistical significance between group 1 and the control group. PCS = peak circumferential strain, PLS = peak longitudinal strain, PRS = peak radial strain, 2D = two-dimensional
heart specimens [11]. A previous study of patients with CA showed a significant relative apical sparing pattern on florbetapir positron emission tomography, which is a known marker of amyloid burden [35]. Another study revealed increased technetium 99m pyrophosphate uptake in the basal and mid LV segments compared with the apical LV segments in patients with TTR CA, suggesting that higher amyloid deposition in the basal and mid regions compared with the apical region is a cause of differential regional uptake [36]. Another study suggested that low basal strain values can help diagnose CA with high sensitivity (82.5%) and specificity (82.9%) [37].
This study has some limitations. First, it was a
retrospective study and involved a small number of patients at a single center. Second, the EMB was performed in only 17 patients. Third, CMR-FT has limitations of inter-vendor variability and a lack of standard normal values, which need further validation. Finally, we did not prove the regional amyloid deposition differences through histopathological examination, which is only possible with postmortem analysis.
In conclusion, quantitative T1 mapping parameters such as native T1 and ECV may help diagnose early CA. ECV, in particular, can reflect regional differences in the amyloid deposition in patients with advanced CA, and increased basal ECV is related to decreased basal strain. Therefore, using quantitative CMR parameters may help diagnose CA and determine the severity of CA in patients with or without LGE.
Supplementary Materials
The Data Supplement is available with this article at https://doi.org/10.3348/kjr.2020.0579.
Conflicts of Interest
The authors report no relationships that could be construed as a conflict of interest.
Author Contributions
Conceptualization: Yoo Jin Hong. Data curation: Yoo Jin Hong, Jin Young Kim. Formal analysis: Yoo Jin Hong, Kyunghwa Han. Funding acquisition: Yoo Jin Hong.
Investigation: Yoo Jin Hong, Jin Young Kim. Methodology:
Yoo Jin Hong, Jin Young Kim, Kyunghwa Han. Supervision:
Byoung Wook Choi. Writing—original draft: Jin Young Kim.
Writing—review & editing: Yoo jin Hong, Jin Young Kim, However, LGE can be atypical or normal in patients with CA.
Furthermore, choosing and nulling the normal myocardium on LGE images is difficult [32]. Therefore, mapping and ECV are emerging as objective quantitative methods with high accuracy for identifying CA [32].
Here, 8 out of 40 patients with CA (20%) exhibited focal patchy or no LGE (group 1). This group showed lower LV mass and LV wall thickness compared with the diffuse and global LGE group (group 2), indicative of early CA.
Group 2 showed the well-known CA features of very high native T1 and ECV. Group 1 also showed significantly higher native T1 and ECV than the control group. Therefore, native T1 and ECV may be useful in diagnosing early CA, even when there is atypical or no LGE.
We found differences in the regional patterns of ECV and CMR strain values among the 3 groups. In group 2, basal ECV was significantly higher than mid and apical ECVs, which can be considered a “basal predominant pattern.”
However, this pattern was not observed in group 1 or the control group. These findings indirectly reflect regional amyloid deposition differences because ECV is regarded as a marker of amyloid burden in CA, as amyloid fibrils are located in extracellular spaces [13,33]. This basal predominant pattern of ECV and strain may be characteristic of advanced CA; therefore, it might help classify the severity of CA. Furthermore, there was a significant negative correlation between ECV and strain parameters in the basal region in group 2, indicating that severe amyloid deposits in the basal regions result in deterioration of regional LV mechanical motion in advanced CA.
Additionally, we compared the mapping and ECV values between different types of amyloidosis. The TTR type has lower T1 and higher ECV with a more benign disease course than the AL type [8,18,34]. In our study, ECV was slightly higher in the TTR group than in the AL group; however, there was no statistical significance. Moreover, a significant interregional difference in terms of ECV was only observed in the AL group (p = 0.004). Because there were only 6 patients in the TTR group, interpretation of this result should be done carefully. Future research with a larger population is needed.
Regional pattern differences exist in patients with CA. A recent study of patients with advanced CA showed that LV LGE was most common in the basal region and correlated negatively with the mean longitudinal strain on ECG [11].
Histopathological findings also showed abundant amyloid
deposits in the basal and mid regions in 3 explanted
Young Jin Kim, Jin Hur, Byoung Wook Choi.
ORCID iDs Jin Young Kim
https://orcid.org/0000-0001-6714-8358 Yoo Jin Hong
https://orcid.org/0000-0002-7276-0944 Kyunghwa Han
https://orcid.org/0000-0002-5687-7237 Hye-Jeong Lee
https://orcid.org/0000-0003-4349-9174 Jin Hur
https://orcid.org/0000-0002-8651-6571 Young Jin Kim
https://orcid.org/0000-0002-6235-6550 Byoung Wook Choi
https://orcid.org/0000-0002-8873-5444
REFERENCES
1. Merlini G, Bellotti V. Molecular mechanisms of amyloidosis. N Engl J Med 2003;349:583-596
2. Banypersad SM, Moon JC, Whelan C, Hawkins PN, Wechalekar AD. Updates in cardiac amyloidosis: a review. J Am Heart Assoc 2012;1:e000364
3. Banypersad SM, Sado DM, Flett AS, Gibbs SD, Pinney JH, Maestrini V, et al. Quantification of myocardial extracellular volume fraction in systemic AL amyloidosis: an equilibrium contrast cardiovascular magnetic resonance study. Circ Cardiovasc Imaging 2013;6:34-39
4. Fontana M, Chung R, Hawkins PN, Moon JC. Cardiovascular magnetic resonance for amyloidosis. Heart Fail Rev 2015;20:133-144
5. Di Bella G, Minutoli F, Mazzeo A, Vita G, Oreto G, Carerj S, et al. MRI of cardiac involvement in transthyretin familial amyloid polyneuropathy. AJR Am J Roentgenol 2010;195:W394-W399
6. Fontana M, Pica S, Reant P, Abdel-Gadir A, Treibel TA, Banypersad SM, et al. Prognostic value of late gadolinium enhancement cardiovascular magnetic resonance in cardiac amyloidosis. Circulation 2015;132:1570-1579
7. Baroni M, Nava S, Quattrocchi G, Milazzo A, Giannattasio C, Roghi A, et al. Role of cardiovascular magnetic resonance in suspected cardiac amyloidosis: late gadolinium enhancement pattern as mortality predictor. Neth Heart J 2018;26:34-40 8. Banypersad SM. The evolving role of cardiovascular magnetic
resonance imaging in the evaluation of systemic amyloidosis.
Magn Reson Insights 2019;12:1178623X19843519
9. Phelan D, Collier P, Thavendiranathan P, Popovic´ ZB, Hanna M, Plana JC, et al. Relative apical sparing of longitudinal strain using two-dimensional speckle-tracking echocardiography
is both sensitive and specific for the diagnosis of cardiac amyloidosis. Heart 2012;98:1442-1448
10. Lee GY, Kim HK, Choi JO, Chang SA, Oh JK, Jeon ES, et al.
Visual assessment of relative apical sparing pattern is more useful than quantitative assessment for diagnosing cardiac amyloidosis in borderline or mildly increased left ventricular wall thickness. Circ J 2015;79:1575-1584
11. Ternacle J, Bodez D, Guellich A, Audureau E, Rappeneau S, Lim P, et al. Causes and causes and consequences of longitudinal LV dysfunction assessed by 2D strain echocardiography in cardiac amyloidosis. JACC Cardiovasc Imaging 2016;9:126-138 12. Bandula S, Banypersad SM, Sado D, Flett AS, Punwani S,
Taylor SA, et al. Measurement of tissue interstitial volume in healthy patients and those with amyloidosis with equilibrium contrast-enhanced MR imaging. Radiology 2013;268:858-864 13. Banypersad SM, Fontana M, Maestrini V, Sado DM, Captur G,
Petrie A, et al. T1 mapping and survival in systemic light- chain amyloidosis. Eur Heart J 2015;36:244-251
14. Barros-Gomes S, Williams B, Nhola LF, Grogan M, Maalouf JF, Dispenzieri A, et al. Prognosis of light chain amyloidosis with preserved LVEF: added value of 2D speckle-tracking echocardiography to the current prognostic staging system.
JACC Cardiovasc Imaging 2017;10:398-407
15. Bhatti S, Vallurupalli S, Ambach S, Magier A, Watts E, Truong V, et al. Myocardial strain pattern in patients with cardiac amyloidosis secondary to multiple myeloma: a cardiac MRI feature tracking study. Int J Cardiovasc Imaging 2018;34:27- 33
16. Brooks J, Kramer CM, Salerno M. Markedly increased volume of distribution of gadolinium in cardiac amyloidosis demonstrated by T1 mapping. J Magn Reson Imaging 2013;38:1591-1595
17. Dungu JN, Valencia O, Pinney JH, Gibbs SD, Rowczenio D, Gilbertson JA, et al. CMR-based differentiation of AL and ATTR cardiac amyloidosis. JACC Cardiovasc Imaging 2014;7:133-142 18. Fontana M, Banypersad SM, Treibel TA, Maestrini V, Sado
DM, White SK, et al. Native T1 mapping in transthyretin amyloidosis. JACC Cardiovasc Imaging 2014;7:157-165 19. Robbers LF, Baars EN, Brouwer WP, Beek AM, Hofman MB,
Niessen HW, et al. T1 mapping shows increased extracellular matrix size in the myocardium due to amyloid depositions.
Circ Cardiovasc Imaging 2012;5:423-426
20. Dungu JN, Anderson LJ, Whelan CJ, Hawkins PN. Cardiac transthyretin amyloidosis. Heart 2012;98:1546-1554 21. Schuster A, Morton G, Hussain ST, Jogiya R, Kutty S, Asrress
KN, et al. The intra-observer reproducibility of cardiovascular magnetic resonance myocardial feature tracking strain assessment is independent of field strength. Eur J Radiol 2013;82:296-301
22. Gertz MA, Comenzo R, Falk RH, Fermand JP, Hazenberg BP, Hawkins PN, et al. Definition of organ involvement and treatment response in immunoglobulin light chain amyloidosis (AL): a consensus opinion from the 10th International Symposium on Amyloid and Amyloidosis, Tours, France, 18-22
in cardiac amyloidosis. AJR Am J Roentgenol 2006;186:1682- 1685
31. Kramer CM. Role of cardiac MR imaging in cardiomyopathies.
J Nucl Med 2015;56 Suppl 4:39S-45S
32. Karamitsos TD, Piechnik SK, Banypersad SM, Fontana M, Ntusi NB, Ferreira VM, et al. Noncontrast T1 mapping for the diagnosis of cardiac amyloidosis. JACC Cardiovasc Imaging 2013;6:488-497
33. Kim PK, Hong YJ, Im DJ, Suh YJ, Park CH, Kim JY, et al.
Myocardial T1 and T2 mapping: techniques and clinical applications. Korean J Radiol 2017;18:113-131
34. Fontana M, Banypersad SM, Treibel TA, Maestrini V, Sado D, White SK, et al. AL and ATTR cardiac amyloid are different:
native T1 mapping and ECV detect different biology. J Cardiovasc Magn Reson 2014;16:341
35. Bravo PE, Fujikura K, Kijewski MF, Jerosch-Herold M, Jacob S, El-Sady MS, et al. Relative apical sparing of myocardial longitudinal strain is explained by regional differences in total amyloid mass rather than the proportion of amyloid deposits. JACC Cardiovasc Imaging 2019;12:1165-1173 36. Sperry BW, Vranian MN, Tower-Rader A, Hachamovitch R,
Hanna M, Brunken R, et al. Regional variation in technetium pyrophosphate uptake in transthyretin cardiac amyloidosis and impact on mortality. JACC Cardiovasc Imaging 2018;11:234- 242
37. Pandey T, Alapati S, Wadhwa V, Edupuganti MM, Gurram P, Lensing S, et al. Evaluation of myocardial strain in patients with amyloidosis using cardiac magnetic resonance feature tracking. Curr Probl Diagn Radiol 2017;46:288-294
April 2004. Am J Hematol 2005;79:319-328
23. The Criteria Committee of the New York Heart Association.
Nomenclature and criteria for diagnosis of diseases of the heart and great vessels, 9th ed. Boston, Mass: Little, Brown & Co, 1994
24. Boynton SJ, Geske JB, Dispenzieri A, Syed IS, Hanson TJ, Grogan M, et al. LGE provides incremental prognostic information over serum biomarkers in AL cardiac amyloidosis.
JACC Cardiovasc Imaging 2016;9:680-686
25. Lang RM, Badano LP, Mor-Avi V, Afilalo J, Armstrong A, Ernande L, et al. Recommendations for cardiac chamber quantification by echocardiography in adults: an update from the American Society of Echocardiography and the European Association of Cardiovascular Imaging. J Am Soc Echocardiogr 2015;28:1-39.e14
26. Nagueh SF, Smiseth OA, Appleton CP, Byrd BF 3rd, Dokainish H, Edvardsen T, et al. Recommendations for the evaluation of left ventricular diastolic function by echocardiography: an update from the American Society of Echocardiography and the European Association of Cardiovascular Imaging. Eur Heart J Cardiovasc Imaging 2016;17:1321-1360
27. Dong Y, Yang D, Han Y, Cheng W, Sun J, Wan K, et al. Age and gender impact the measurement of myocardial interstitial fibrosis in a healthy adult Chinese population: a cardiac magnetic resonance study. Front Physiol 2018;9:140 28. Falk RH, Skinner M. The systemic amyloidoses: an overview.
Adv Intern Med 2000;45:107-137
29. Hachulla E, Grateau G. Diagnostic tools for amyloidosis. Joint Bone Spine 2002;69:538-545
30. vanden Driesen RI, Slaughter RE, Strugnell WE. MR findings