Analysis on international trade flow of medical devices in Korea, China, and Japan
한․중․일 의료기기 무역분석
Hong-Kyun Bae
Professor, Department of International Trade, Sangji University
Contents
Ⅰ. Introduction
Ⅱ. Medical devices in Korea, China and Japan
Ⅲ. Trade intensity of medical devices in Korea, China and Japan
Ⅳ. Conclusion References 국문초록
ABSTRACT
This study has analyzed the international trade flow of medical devices in Korea, China, and Japan more theoretically and systematically through a mutual connection of the medical device export structure of Korea and the import structure of China and Japan organically, with an intensity approach on the bilateral international trade flow. Also, it is meaningful to find a solution to boost exports of Korea to China and Japan. Therefore in this study, we recognize the importance of the medical device market in China and Japan, which is the main competition for Korea and its market, and look into the trade situation of these three countries. We also look into the relative market stream and the trade intensity of the main medical devices in Korea, China and Japan, and seek measures for the steady growth of the medical device market in these three countries.
Key Words : Medical devices, International trade flow, Intensity Approach, Medical device market
Ⅰ. Introduction
Since technological innovation is speeding up, the medical device market is bound to become even more competitive as a global leading‐edge technology. Currently, the medical device market size of Asia and Pacific countries is less than 20% of the global market, being the third biggest, following America and Europe. Korea, China and Japan are the main competing countries in Asia, sharing a significant portion of global medical device production, and it is still growing.
Historically, Japan was the only strategically important market for medical devices in Asia. Japan remains the 2
ndlargest medical device market as a country globally, and its strategic importance has been paramount in Asia. On the other hand, China is seen as key to global relevance and success, which is no different from those voiced by other industries. Especially, as the GDP growth rate of China has increased by more than 10% in the last 20 years, and many China‐
based industries are becoming the center of global supply and value chains, China is expected to become the biggest exporting country through creating a need for medical devices through health care reform, in the near future. Korea mainly produced and exported simple products up until mid 1990’s, but since then, has localized import‐dependent products and begun import substitution, growing into a continuous growth market.
As China and Japan are emerging not only as the center of the global medical device market, but also as the leading export market, we will analyze the international trade flow of medical devices in Korea, China and Japan, and find political implications for popularizing our export market and boosting exports of medical devices.
Since previous research on the medical device export market were mostly limited to introducing
items of importing countries, with little study on intensity approach, this study has analyzed the
international trade flow of medical devices in Korea, China, and Japan more theoretically and
systematically through a mutual connection of the medical device export structure of Korea and
the import structure of China and Japan organically, with an intensity approach on the bilateral
international trade flow. Also, it is meaningful to find a solution to boost exports of Korea to
China and Japan. Therefore in this study, we recognize the importance of the medical device
market in China and Japan, which is the main competition for Korea and its market, and take a
look at the trade situation of these three countries. We also look into the relative market stream
and the trade intensity of general medical devices in Korea, China and Japan, and seek measures for the steady growth of the medical device market in these three countries.
Ⅱ. Medical devices in Korea, China and Japan
The term “medical device” has been defined in various terms by regulatory agencies, but generally refers to any instrument, apparatus, appliance, or related article that is intended for use in the diagnosis, prevention, monitoring, treatment, or alleviation of disease, or is intended to affect the structure or function of the human anatomy(Thomas Alured Faunce, 2006). Medical devices that are applied to these diverse areas create new applications, and expand the medical device industry through the convergence of various technologies such as advanced materials, mechatronics, IT(Information Technology), BT(Biology Technology), and NT(Nano Technology).
The medical device related market in Korea exhibits a very distinctive difference from other manufacturing businesses. Compared with not only strong technology‐based manufacturing related products, but also with the software industry, such as digital contents or IT service, the medical device market holds a very small portion of the global market. But in comparison to the relative added value ratio, the value of medical devices is higher than information technology, electronics or cars. Especially in the case of high‐tech medical equipment, it is expected to be even higher.
Therefore the medical device related industry in Korea has great potential for growing rapidly and continuously in the future, with affirmative governmental support as semiconductors and shipbuilding were(Kim, 2009).
Meanwhile, the medical device industry in China, which is exceeding the growth rate of the medical device industry in Korea, is gradually opening its market to foreign countries since joining the WTO, and as a result, the entry barrier of drug and medical devices is getting lower, deepening the competition among high quality foreign products.
Since 2000, China’s exports of medical devices have more than quintupled, leading to a
significant trade surplus in the medical device market(PwC Analysis, 2008). Exports have continued
to expand and outpace imports, increasing sales of more expensive, high‐value‐added products such
as ultrasound, dental and magnetic resonance imaging(MRI) equipment(Insight, 2010).
In the second quarter of 2010, China’s nominal gross domestic product(GDP) of $1.33 trillion surpassed that of Japan, $1.29 trillion. China’s medical device market currently ranks fourth in the world and is estimated at approximately $7.5 billion (Pacific Bridge Medical, 2010). The export amount of some high‐tech medical device equipment products and high added‐value products grew steadily. It is especially worthy of attention that the rapid growth in the export amount of diagnostic and treatment equipment provides more development space for domestic medical devices in international markets(CCPIE, 2011). China’s growth as an export destination for Japan’s medical devices has been the most pronounced in recent years. In the future, China will add more technology into products such as mechanical sensor materials, smart devices, clinical trial systems and so on. Rapidly growing technology, increasing demand for innovative medical devices together with an aging population and the prevalence of chronic illness are very important growth drivers for the medical device market in China(TechNavio, 2011).
On the one hand, with a prosperous, aging population and strong health care system, Japan is the world’s second‐largest market for medical technology behind the United States with $25 billion in annual sales(Susan Kelly, 2011). Japan now accounts for about 10 percent of the world’s health‐care market. Japan’s medical market is expected to continue growing alongside Japan’s increasingly graying society(UITC, 2007).
Moreover, the percentage of the population exceeding age 65 is projected to increase to 30 percent by 2025(Hanawa, 2003). The production value of the market for “diagnostic imaging system”, is highest of all medical devices in Japan. Japan is highly competitive in this market, with half
1)of all products being exported.
The market for therapeutic instruments, on the other hand, largely depends on imports and therefore the presence of imported products is more conspicuous than in other markets(Jennifer Lau, 2011). But, As Japan has highly advanced fundamental technologies such as electronics, IT, and fabric technology, it is expected that novel medical devices will be developed by making full use of these technologies(JETRO, 2009).
Japan and China are approximately on par with respect to strategic importance in Asia and the advanced medical devices supplied by global companies. However, as in other industries, China is about to overtake Japan in attractiveness based on substantial market potential and the large
1) Representative examples(Whole body X‐ray CT units, General‐purpose ultrasonic diagnostic devices)
growth rate that it will deliver(PwC, 2011). Moreover, as the market becomes attractive, more domestic companies could create advanced medical devices and the domestic device industry can be expected to grow(AMDD, 2011). Although Japan is still a large market, a high growth rate cannot be expected in the future and barriers to product introduction remain high. On the other hand, China is already recognized as a sufficient‐size market and the high growth rate and relative ease of product introduction are seen as attractive. However, the government’s unpredictability is viewed as a risk in China.
See Figure 1 for a closer look into the medical device trade balance status according to its importance. In 2005, China’s trade surplus in the medical device market has been increasing since 2004, and even more in 2006. Meanwhile, it is shown that the trade deficit in medical devices market in Korea and Japan is gradually increasing. Among the top ten medical device trade balance countries, China showed the highest trade balance growth rate in 2006, which was a 543.9% increase compared to 2005. China’s export competitiveness on low‐mid priced medical devices and with the potential of technological improvement in the near future considered, the trade surplus has decreased somewhat compared to 2009, yet it is still expected that China’s trade surplus increase will go on for the time being. On the other hand, the medical device trade deficit has continued in Korea and Japan year after year. After 2007, in Japan the trade deficit has continued to increase, from $1.8 billion in 2007 to $4.2 billion in 2010(KHIDI, 2011).
Sources: Yearly materials by Espicom rearranged by the author
(Figure 1) Changes of trade balance in Korea, China and Japan
Ⅲ. Trade intensity of medical devices in Korea, China and Japan
When compared to China and Japan, Korea’s medical device industry is establishing its market, having focused on achieving competitiveness, technology investment and product development for entering the global market over the years. China has invigorated its medical device market lately through overseas medical device corporations’ investments for improvement. And Japan is set on taking over China and emerging markets to decrease the global medical device market share largely held by the USA and Germany. Therefore in this study, we will compare and analyze the trade of Korea, China and Japan with an intensity approach on the bilateral international trade flow and through this, check the level of relative concentration in a particular market.
1. Trade intensity of Korea, China, and Japan
The trade intensity index was usedin order to analyze the bilateral prospective trade level and the actual trade volume according to the export‐import specialization structures of Korea, China, and Japan. Trade intensity index
2)analysis is done through comparing a trade between a nation and its partner with the relative importance in the world. Therefore it is meaningful to look into the relative concentration of international export among Korea, China, and Japan in the last ten years, through the trade intensity approach in the situation of the international trade with several countries, and each countries’ interaction through the comparative analysis of China and Japan,
2) Trade intensity analysis, concentrates the structure of departures of actual trade flows from flows. The index of intensity of country i’s export trade with country j is defined by where Xi., X.j,and X.., represents the total export of country i, total import of countryj, and the total import volume of world trade respectively.
Iij=Xij/Xi.)/(X.j/X..) ··· (1) Xij is countryi'’s export to countryj, Xi. iscountry i’s total export volume, X.j is countryj’s total import volume, X.. isthe total import volume of world trade.
In other words, trade intensity index is dividing the portion that country jhas in the total export volume of country I with the portion of country j’s total import volume in the total import volume of world trade.
Formula (1)’s value is 1, and if Iij>1, it signifies that the portion of the export to country j in the total export volume of country i, and the total import volume of country j’s in the total import volume of world trade is bigger, and also the export of country iis relatively concentrated on country j.
On the contrary, Iij<1 means that the export of country i is not relatively concentrated on countryj,and Iij=1 means that the export of countryi to countryj is in line with the portion of the total export volume of countryi and the portion that the total import volume of country j in the total import volume of world trade, so the export of countryi to countryj is relatively balanced. This trade intensity index enables the analysis of each country at certain point of time, and comparison of time series at the same time, and helps with the analysis of the relative concentration change of the export of country i to country j.
which are the two main trade nations.
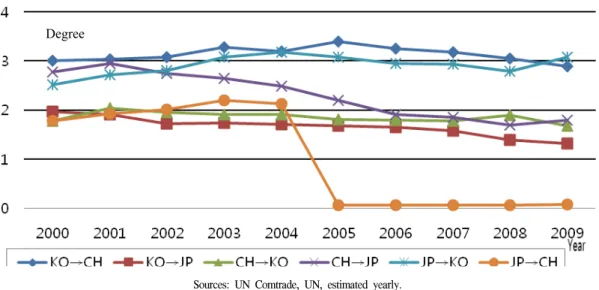
Degree
Sources: UN Comtrade, UN, estimated yearly.
(Figure 2) Trade intensity change in Korea, China, and Japan
Figure 2 shows the trade intensity change in the last 10 years, indicating how much of Korea’s export is relatively concentrated on China and Japan. Overall, Korea shows more than 3 with China, and over 1.5 with Japan, which means that the trade intensity with Japan is on the decrease, and that with China is fluctuating, but on the increase. Taking a look at each country, in the case of Korea, the trade intensity index with Japan is gradually getting lower from 1.975 in 2000. On the whole, it shows an annual rate of 1.671. As the export of Korea to China is increasing largely every year, the trade intensity index is 3.138 annually, which is high. The reason for this high index is assumed to be that the sharp increase of export to China has had a positive impact on trade surplus, compared to the global importance.
Upon looking into Japan for the relative importance of its trade intensity to Korea and China, it
turned out that Japan’s trade intensity with Korea is high, showing an annual average of 2.916,
which is a quite relevant connection in trade intensity than China. Japan is on a steady increase
with Korea in trade intensity, and compared to this, China doesn’t show a high number compared
to Korea. Therefore it is reasonable to draw a conclusion that it is true that Japan has a great deal
of impact on Korea and China markets, and especially the trade intensity index is high because of
its relatively high consistent trade flow with Korea and intersectoral linkages than China.
To look into China’s relative concentration of trade with Korea and Japan, the trade intensity change in the last 10 years shows that China has a higher level of concentration with Japan than Korea on the whole. China shows 2.779 in 2000 with Japan, and the number is gradually getting lower except 2001, but generally it shows a steadily high concentration of 2.3 with Japan. It is assumed that as many Japanese firms relocated their manufacturing centers to China due to production cost increase, since they have been active in entering China’s market, and along with the import size from China increasing, China has exceeded Japan in the global supply and demand market, emerging as the main and biggest trade surplus nation in Asia, posing a threat but also affecting towards a strategic cooperation. It is noteworthy that in the light of the trade intensity change among these three countries, Korea in China, China in Japan, and Japan in Korea hold a dominant position, showing circulation patterns.
2. Trade intensity of medical devices in Korea, China, and Japan
As explained in the previous pages, the medical device industry is being magnified as a future growth business in each country, and the demand for medical devices is increasing due to demographic aging, and the increase of chronic disease. Therefore the trade intensity of medical device in Korea, China, and Japan is sorted by item. In choosing the countries to compare with, China and Korea were chosen as comparative countries because they have their own regulatory requirements, are keen to grow the medical device industry and are close geographically. Their medical device markets are less than 1/3 of Japan’s in size, but are nevertheless sizable in Asia and have high growth rates(Luo ZheㆍWu Xiaotong, 2011).
For the purpose of this study, the classification for medical devices has been categorized into Espicom’s five criteria
3)to reflect diagnostic imaging, dental product, orthopaedic & implantable,
3) The definition of Medical device based upon the harmonized system of commodity classification(HS 1996). As a result of the wider definitional changes, this study uses the commodity‐based HS 1996 definition. The new definition of Medical device includes five major categories: diagnostic, dental, orthopaedic, consumable, patient aids:
* Diagnostic imaging: 901811(Electro‐cardiographs), 901812(Ultrasonic scanning apparatus), 901813(Magnetic resonance imaging system), 902212(Computed tomography scanners), 902214(X‐rays apparatus, medical, surgical or veterinary uses)
* Dental products: 901849(Instruments and appliances, used in dentistry), 902129(Dental fittings(excl. artificial teeth)) * Orthopaedic & implantable: 902111(Artificial joints), 902119(Orthopaedic/fracture appliances, nes), 902130(Artificial body
parts, aids and appliances, etc)
* Consumables: 900130(Contact lenses), 901831(Syringes, with or without needles)
* Patient Aids:901819(Electro‐diagnostic apparatus, nes), 901850(Ophthalmic instruments and appliances), 901890(Instruments, appliances for medical, surgical or veterinary sciences), 901920(Therapeutic respiration apparatus), 902140(Hearing aids,
consumable, patient aid classifications(Espicom, 2011). These devices are all used in professional medical practice for the prevention, diagnosis and treatment of diseases and injuries, and the correction of physical deformities of the body. The data collection period was during the end of 2011. At the time, the statistics for 2010 were not available yet. Moreover, access to specific databases is restricted. Therefore, the acquired information is limited to analyze this research.
1) Comparative analysis on diagnostic imaging trade intensity
Table 1 shows the trade intensity by item for 901811(Electro‐Cardiographs) among other items.
Korea shows a high relative concentration of 6 annually with China since 2002. Especially, Japan’s concentration level with Korea and China is high, which is an annual average of more than 3 with Korea, and annual average of more than 11 with China. The reason why Japan exhibits a high trade intensity index with China is its considerable portion in the whole amount of imports of China on the same item. In 901812(Ultrasonic scanning apparatus)’s relative market concentration level by item, Korea shows a concentration level of 2.063 with Japan annually.
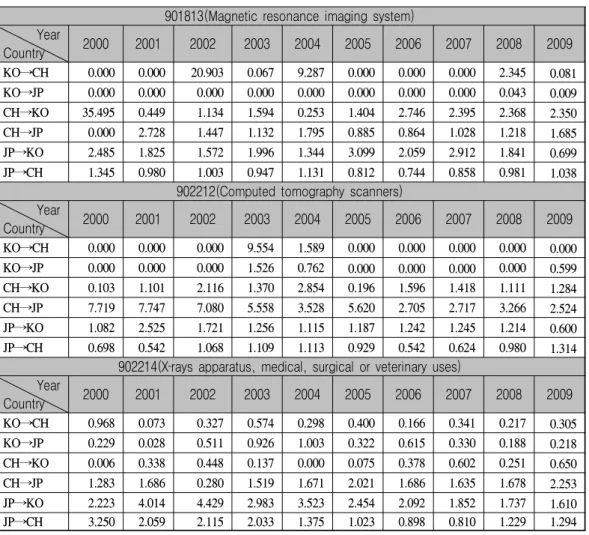
China shows a high trade intensity index in both Korea and Japan, particularly, with Japan, a very high intensity level of 5.356 annually. Japan shows a number of 2.2 annually in Korea, higher than with China. It appears that other international trades(Korea‐China, Japan‐China) do not show any relatively significant concentration level. 901813(Magnetic resonance imaging system)’s trade intensity by item stands out for China’s very high relative concentration level of 35 with Korea in 2000, and one of the reasons for this was because at the time China’s export was solely concentrated on Korea, and China didn’t have a large export of the item. China shows a high concentration level of over an average of 5 annually with Korea. Korea had a higher concentration level in China than Japan in 2002, and 2004, which was owing to a significant portion of export to China, but it didn’t last. Japan showed a steady concentration level of over 1.9 annually with Korea, higher than with China.
The relative concentration of 902212(Computed tomography scanners) shows that China exhibits a high trade intensity index of over 6 up until mid 2000 in the relationship with Japan, and repeatedly fluctuating, and this can be because China’s export of the item to Japan is continuously on the rise, regardless of China’s global export amount of the item. China shows a
except parts and accessories)
901811(Electro‐cardiographs) Year
Country 2000 2001 2002 2003 2004 2005 2006 2007 2008 2009
KO→CH 0.125 0.914 6.756 2.984 3.604 1.660 4.263 9.430 7.691 6.700 KO→JP 0.010 0.002 0.193 0.452 0.803 1.656 1.704 2.304 2.567 2.368 CH→KO 0.424 1.441 0.000 0.000 0.022 2.102 1.676 0.788 0.354 0.246 CH→JP 0.097 0.000 0.000 0.861 4.718 1.939 3.827 4.899 2.234 1.571 JP→KO 4.947 3.150 5.644 4.517 3.344 3.162 5.333 1.919 1.322 1.295 JP→CH 8.207 8.933 15.317 13.052 12.437 8.487 10.401 13.358 10.414 12.899
901812(Ultrasonic scanning apparatus) Year
Country 2000 2001 2002 2003 2004 2005 2006 2007 2008 2009
KO→CH 1.055 0.356 0.351 0.435 0.671 0.577 0.570 0.421 0.472 0.498 KO→JP 1.930 2.754 2.086 2.753 2.120 1.615 1.501 2.042 1.840 1.989 CH→KO 3.144 0.484 0.644 0.905 0.637 1.905 0.858 2.510 6.294 4.125 CH→JP 2.713 5.064 4.239 6.390 7.549 6.545 5.904 5.799 4.859 4.499 JP→KO 1.952 2.244 2.049 1.296 1.985 2.040 1.878 2.140 3.751 2.777 JP→CH 0.559 0.490 0.816 0.830 0.689 0.800 1.043 0.959 1.110 1.022 concentration level of 4.8 annually. Other international trades(China‐Korea, Japan‐Korea) show the trade intensity index of 1.3 annually. Korea shows a high level of 9.5 with China in 2003, and this is attributable to the high amount of export to China in the overall export. 902214(X‐rays apparatus, medical, surgical or veterinary uses)’s trade intensity by item indicates that Korea has hardly any concentration level with Japan and China. China showed the favorable, over 1.5 annually with Japan, higher than with Korea, and Japan showed general trade intensity with Korea, and China, especially with Korea it showed an annual average of 2.6, and with China, over 1.6 annually.
And with the results of the research on diagnostic imaging medical devices, it is necessary to invest in high end medical devices such as MRI, CT, Ultrasound where the technology is improving. It is also worth noting that China is growing its trade influence on both Korea and Japan in the area of diagnostic instruments. On top of Japan’s influence in this area, trade analysis shows China’s growth in trade intensity in Korea and Japan.
<Table 1> Diagnostic imaging trade intensity by item
901813(Magnetic resonance imaging system) Year
Country 2000 2001 2002 2003 2004 2005 2006 2007 2008 2009
KO→CH 0.000 0.000 20.903 0.067 9.287 0.000 0.000 0.000 2.345 0.081 KO→JP 0.000 0.000 0.000 0.000 0.000 0.000 0.000 0.000 0.043 0.009 CH→KO 35.495 0.449 1.134 1.594 0.253 1.404 2.746 2.395 2.368 2.350 CH→JP 0.000 2.728 1.447 1.132 1.795 0.885 0.864 1.028 1.218 1.685 JP→KO 2.485 1.825 1.572 1.996 1.344 3.099 2.059 2.912 1.841 0.699 JP→CH 1.345 0.980 1.003 0.947 1.131 0.812 0.744 0.858 0.981 1.038
902212(Computed tomography scanners) Year
Country 2000 2001 2002 2003 2004 2005 2006 2007 2008 2009
KO→CH 0.000 0.000 0.000 9.554 1.589 0.000 0.000 0.000 0.000 0.000 KO→JP 0.000 0.000 0.000 1.526 0.762 0.000 0.000 0.000 0.000 0.599 CH→KO 0.103 1.101 2.116 1.370 2.854 0.196 1.596 1.418 1.111 1.284 CH→JP 7.719 7.747 7.080 5.558 3.528 5.620 2.705 2.717 3.266 2.524 JP→KO 1.082 2.525 1.721 1.256 1.115 1.187 1.242 1.245 1.214 0.600 JP→CH 0.698 0.542 1.068 1.109 1.113 0.929 0.542 0.624 0.980 1.314
902214(X‐rays apparatus, medical, surgical or veterinary uses) Year
Country 2000 2001 2002 2003 2004 2005 2006 2007 2008 2009
KO→CH 0.968 0.073 0.327 0.574 0.298 0.400 0.166 0.341 0.217 0.305 KO→JP 0.229 0.028 0.511 0.926 1.003 0.322 0.615 0.330 0.188 0.218 CH→KO 0.006 0.338 0.448 0.137 0.000 0.075 0.378 0.602 0.251 0.650 CH→JP 1.283 1.686 0.280 1.519 1.671 2.021 1.686 1.635 1.678 2.253 JP→KO 2.223 4.014 4.429 2.983 3.523 2.454 2.092 1.852 1.737 1.610 JP→CH 3.250 2.059 2.115 2.033 1.375 1.023 0.898 0.810 1.229 1.294
Sources: UN Comtrade, UN, Estimated yearly
2) Dental products trade intensity by item
Table 2 of trade intensity shows 901849(Instruments and appliances, used in dentistry)’s relative
market concentration of the export by item. Korea shows an absolute intensity index of over an
average of 11 annually in China. China showed a quite high concentration in Japan in the early
2000’s, and after that a steady annual average of over 2.4. Korea and Japan’s influence on China
appeared to be greater than China’s influence on Japan and Korea. Japan shows a high trade
intensity index of an annual average over 4.6 in Korea, and over 5.2 in China, on dental
products. 902129(Dental fittings(excl. artificial teeth))’s trade intensity by item shows that overall
Korea has a high concentration to China, and China to Japan, but the number is gradually
901849(Instruments and appliances, used in dentistry) Year
Country 2000 2001 2002 2003 2004 2005 2006 2007 2008 2009
KO→CH 31.518 11.467 16.688 11.560 5.980 11.836 8.072 9.350 7.454 5.101 KO→JP 1.123 0.807 0.842 1.013 1.496 0.965 1.834 1.657 1.317 1.731 CH→KO 0.000 0.145 0.299 0.192 0.480 1.114 0.692 0.970 0.764 1.842 CH→JP 5.318 5.045 3.603 2.139 1.549 1.635 1.510 1.571 1.199 1.070 JP→KO 4.513 5.813 5.685 5.780 4.686 3.782 3.709 3.834 4.449 4.587 JP→CH 5.169 4.499 4.088 4.609 4.103 6.534 5.575 5.970 5.406 6.380
902129(Dental fittings(excl. artificial teeth)) Year
Country 2000 2001 2002 2003 2004 2005 2006 2007 2008 2009
KO→CH 0.000 0.000 46.740 11.092 0.000 0.964 10.634 12.923 7.219 9.369 KO→JP 0.000 2.361 0.471 0.017 6.784 0.918 0.600 0.048 0.160 0.326 CH→KO 0.000 0.115 0.099 0.033 0.000 0.000 0.227 0.232 0.317 0.386 CH→JP 6.000 3.136 3.317 2.995 1.121 2.224 2.064 1.227 1.181 0.748 JP→KO 8.211 5.942 8.607 7.755 5.657 1.670 1.090 1.936 1.595 2.690 JP→CH 36.026 0.000 19.959 44.457 6.126 4.870 1.686 3.455 1.531 1.608 decreasing. Japan had a high concentration in Korea and China in the early 2000’s, especially high in China, and towards the mid and late 2000’s the number is fluctuating. Other international(Korea‐Japan, China‐Korea)’ trade intensity is very little. With dental products, it shows that on the whole, Korea has a significant portion of trade intensity to China, and Japan to Korea and China.
The market for dental instruments and appliances in Japan mirrors the general trend of the Japan market which is perceived as competitive enough, since domestic production is very strong and offers high quality and standards(AMDD, 2011).
<Table 2>Dental products trade intensity by item
Sources: Same as Table 1
902111(Artificial joints) Year
Country 2000 2001 2002 2003 2004 2005 2006 2007 2008 2009
KO→CH 0.000 4.189 0.192 1.618 1.793 0.550 0.717 0.106 0.222 0.701 KO→JP 0.014 0.000 0.065 0.154 0.009 0.024 0.080 0.397 0.027 1.158 CH→KO 0.740 1.366 2.023 5.251 8.338 4.062 1.516 0.013 0.093 0.065 CH→JP 0.000 0.000 0.000 0.133 1.311 1.344 0.013 0.251 0.098 0.057 JP→KO 4.763 3.232 0.607 0.504 0.795 2.317 0.437 0.094 0.000 0.785 JP→CH 0.000 7.006 4.316 3.755 3.698 2.768 0.077 0.748 1.007 4.147
3) Orthopaedic & implantable trade intensity by item
The relative market concentration of 902111(Artificial joints)’s export by item is as follows in Table 3. Korea shows hardly any concentration of trade intensity to China and Japan. China showed a relatively high concentration during 2003~2005 with the relationship of Korea, and it seems that it was because China’s export of the item to Korea was a large amount. Japan shows fluctuation of the relative concentration of export to China. From 2000~2001, Japan showed a high concentration in Korea, but China took its place.
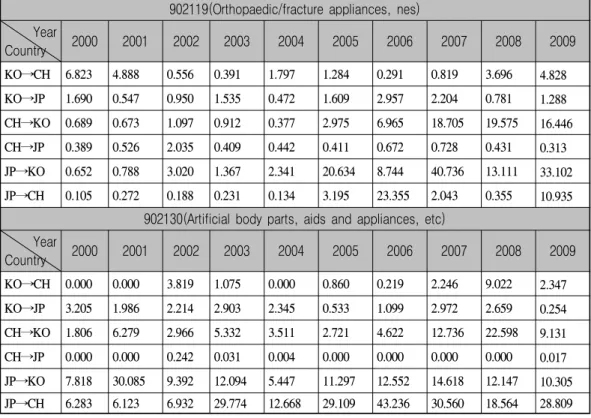
It is noticeable in the 902119(Orthopaedic/fracture appliances, nes)’s trade intensity that after 2005, China and Japan exhibited a very strong concentration in Korea. The reason for Japan’s trade intensity increase in Korea is because the export to Korea increased continuously in spite of the decrease of export of the item from Japan into the world. After 2005, China’s trade intensity increased to Korea, despite the decrease of the import of the item from Korea into the world because China increased the export of the item 902119 to Korea. Besides that, Japan is fluctuating in China since after 2005. 902130(Artificial body parts, aids and appliances, etc)’s trade intensity shows Japan’s absolute concentration in Korea and China.
Especially it shows a strong annual average of more than 21 in China. And with Korea, it shows over 12 annually. While the orthopedic industry widely used in Japan has enjoyed growth over the past few years, the future is expected to be even brighter. With this anticipated growth in the orthopedic industry, the demand for Korea and China will also increase.
<Table 3> Orthopaedic & implantabletrade intensity by item
902119(Orthopaedic/fracture appliances, nes) Year
Country 2000 2001 2002 2003 2004 2005 2006 2007 2008 2009
KO→CH 6.823 4.888 0.556 0.391 1.797 1.284 0.291 0.819 3.696 4.828 KO→JP 1.690 0.547 0.950 1.535 0.472 1.609 2.957 2.204 0.781 1.288 CH→KO 0.689 0.673 1.097 0.912 0.377 2.975 6.965 18.705 19.575 16.446 CH→JP 0.389 0.526 2.035 0.409 0.442 0.411 0.672 0.728 0.431 0.313 JP→KO 0.652 0.788 3.020 1.367 2.341 20.634 8.744 40.736 13.111 33.102 JP→CH 0.105 0.272 0.188 0.231 0.134 3.195 23.355 2.043 0.355 10.935
902130(Artificial body parts, aids and appliances, etc) Year
Country 2000 2001 2002 2003 2004 2005 2006 2007 2008 2009
KO→CH 0.000 0.000 3.819 1.075 0.000 0.860 0.219 2.246 9.022 2.347 KO→JP 3.205 1.986 2.214 2.903 2.345 0.533 1.099 2.972 2.659 0.254 CH→KO 1.806 6.279 2.966 5.332 3.511 2.721 4.622 12.736 22.598 9.131 CH→JP 0.000 0.000 0.242 0.031 0.004 0.000 0.000 0.000 0.000 0.017 JP→KO 7.818 30.085 9.392 12.094 5.447 11.297 12.552 14.618 12.147 10.305 JP→CH 6.283 6.123 6.932 29.774 12.668 29.109 43.236 30.560 18.564 28.809
Sources: Same as Table 1
4) Consumables trade intensity by item
Table 4 trade intensity shows 900130(Contact lenses)’s relative market concentration of the export by item. The reason why Korea exhibits an absolute concentration level of over average 23 annually to China since 2002 is that Korea’s export of the item 900130 to China has increased dramatically, and the global market for contact lenses is continuing to grow at the rate of 30%
average every year, and also the portion of export to China has had the highest growth rate.
China shows a high trade intensity index to Korea after 2005, and it is analyzed that this is the main factor because of the export increase of low price products made in China. And Japan shows a strong trade intensity index in Korea and China because of the fact that Japan is still highly competitive in the market for the item 900130, and also major global firms exist in Japan.
Japan shows an annual average of more over 13 with Korea, and that of over 10 with China
after 2002. 901831(Syringes, with or without needles)’s relative market concentration by item
shows that Japan has influence in Korea on this item, but overall, in all three countries, it
900130(Contact lenses), Year
Country 2000 2001 2002 2003 2004 2005 2006 2007 2008 2009
KO→CH 0.295 1.375 18.600 34.295 28.583 23.551 25.757 19.277 19.748 15.821 KO→JP 3.507 2.605 1.980 1.388 1.030 0.462 0.367 0.593 0.405 0.607 CH→KO 0.082 0.022 0.000 0.000 0.657 15.217 22.189 7.342 5.070 1.860 CH→JP 0.029 0.051 0.000 0.000 0.000 0.000 0.000 0.000 0.000 0.000 JP→KO 23.271 20.144 13.759 13.975 11.532 15.180 13.070 8.222 8.818 8.300 JP→CH 1.917 0.081 10.326 6.317 4.773 6.865 12.765 23.773 7.829 9.530
901831(Syringes, with or without needles) Year
Country 2000 2001 2002 2003 2004 2005 2006 2007 2008 2009
KO→CH 0.049 0.081 0.142 0.066 0.156 0.100 0.091 0.164 0.140 0.211 KO→JP 0.002 0.000 0.000 0.002 0.000 0.046 0.152 0.193 0.395 0.200 CH→KO 8.260 4.008 1.494 1.139 0.440 0.392 0.513 0.127 0.343 0.484 CH→JP 0.590 4.203 4.071 0.113 0.160 0.031 0.319 0.060 0.154 0.395 JP→KO 2.283 5.339 1.009 1.195 1.548 1.129 2.072 2.575 1.415 0.186 JP→CH 1.036 0.323 0.827 0.608 0.961 0.891 0.749 0.776 1.003 0.705 doesn’t show any associated concentration. Japan exhibits an annual average of over 1.8 with Korea, and all the other international trades show less than 1. But China showed a high trade intensity index in Korea in 2000~2001, and in Japan in 2001~2002, owing to the high concentration of export to the partners during that time.
<Table 4> Consumables trade intensity by item
Sources : Same as Table 1
5) Patient Aids trade intensity by item
901819(Electro‐diagnostic apparatus, nes)’s trade intensity by item is as follows in Table 5.
Korea shows an annual average concentration of 4 in China, and Japan shows the average of over 3 annually in China. China’s trade intensity with Japan in the early 2000’s was high, and then it changed to Korea, but after 2006, the table shows hardly any concentration of China in both countries of Korea and Japan.
901850(Ophthalmic instruments and appliances)’s trade intensity by item shows that Korea
901819(Electro‐diagnostic apparatus, nes) Year
Country 2000 2001 2002 2003 2004 2005 2006 2007 2008 2009
KO→CH 0.689 5.127 7.723 6.271 4.747 3.861 2.891 2.837 3.073 2.756 KO→JP 0.911 1.106 1.670 2.191 0.874 1.461 1.028 1.708 1.435 1.448 CH→KO 0.068 0.219 1.646 2.657 3.084 3.487 0.334 0.232 0.525 0.354 CH→JP 4.327 4.125 1.725 1.406 0.719 0.388 0.591 0.514 0.247 0.156 JP→KO 1.926 1.587 2.297 2.512 2.243 1.790 1.851 1.876 1.376 1.418 JP→CH 2.175 1.808 1.938 2.244 3.071 4.250 4.062 4.470 3.463 3.824 exhibited a high concentration in China in the early 2000’s, and it is thought that the high portion of the export of the item from Korea to China had a great influence on that. The trade intensity gradually drops to an annual average of 2.6 since then. The other international trades(China‐Japan, Japan‐Korea, Japan‐China) show the trade intensity index of over average 1 annually, which is not so high. 901890(Instruments, appliances for medical, surgical or veterinary sciences)’s trade intensity shows Korea with an annual average of 7 to China. China indicates a concentration of over an average of 3 annually to Japan, but has hardly any influence in Korea.
Japan shows a quite high concentration level in both Korea and China, and it is assumed that because Japan has acquired global competitiveness based on the technological advantage of the artificial kidney, which is a detailed item of 901890, and thus has a considerable amount of influence regarding the item in Korea and China.
901920(Therapeutic respiration apparatus)’s shows that Korea and Japan have a high reciprocal trade intensity. Korea shows an annual average of over 4.6 of the trade intensity index with Japan, and Japan shows a very high relative concentration of an annual average of over 17 in Korea, with its strong competitiveness in the therapeutic respiration market.
902140(Hearing aids, except parts and accessories)’s trade intensity shows that Japan has a very high relative concentration of an annual average of over 6.5 in Korea. Japan’s top hearing aid manufacturer is a local company. That’s how Japan has such high competitiveness in its own hearing aids market. The other international trades showed little concentration.
<Table 5> Patient Aids trade intensity by item
901850(Ophthalmic instruments and appliances) Year
Country 2000 2001 2002 2003 2004 2005 2006 2007 2008 2009
KO→CH 8.175 5.017 2.609 1.832 2.039 2.260 1.481 1.298 1.036 0.897 KO→JP 0.410 0.354 0.344 0.057 0.109 0.123 0.240 0.307 0.212 0.168 CH→KO 0.493 0.295 0.660 0.574 2.344 1.550 0.834 0.687 0.461 0.427 CH→JP 0.979 1.192 0.787 2.034 2.157 1.595 1.663 1.498 1.020 0.570 JP→KO 1.252 1.770 1.599 1.363 1.164 1.462 1.169 1.247 1.047 1.010 JP→CH 1.882 1.526 1.623 1.566 1.603 1.828 1.666 1.395 1.697 1.591
901890(Instruments, appliances for medical, surgical or veterinary sciences) Year
Country 2000 2001 2002 2003 2004 2005 2006 2007 2008 2009
KO→CH 4.788 5.386 6.901 9.200 6.079 11.641 12.058 6.748 4.822 3.092 KO→JP 2.233 1.830 1.754 2.263 1.320 1.351 1.480 1.849 1.091 1.045 CH→KO 0.330 0.446 0.723 1.903 2.127 0.965 0.879 0.560 0.368 0.428 CH→JP 4.053 4.406 4.276 3.655 3.208 3.342 3.327 3.088 2.612 2.364 JP→KO 3.531 3.391 4.218 3.257 2.398 2.223 2.135 1.808 1.967 2.036 JP→CH 2.122 2.422 3.172 3.413 3.724 4.481 4.057 3.781 3.776 3.961
901920(Therapeutic respiration apparatus) Year
Country 2000 2001 2002 2003 2004 2005 2006 2007 2008 2009
KO→CH 0.000 0.333 1.075 0.763 1.246 1.467 1.093 0.182 0.398 1.506 KO→JP 10.323 5.756 5.613 3.366 1.019 4.963 3.012 3.455 5.981 3.102 CH→KO 3.046 5.932 0.401 1.203 1.090 0.582 0.752 0.638 0.532 0.333 CH→JP 0.683 0.597 0.373 0.738 1.284 1.370 0.979 0.750 0.619 0.569 JP→KO 11.367 16.015 23.091 14.189 11.503 5.720 27.238 21.360 28.821 19.062 JP→CH 3.429 0.859 0.572 0.452 0.756 0.657 0.957 1.054 0.864 1.143
902140(Hearing aids, except parts and accessories) Year
Country 2000 2001 2002 2003 2004 2005 2006 2007 2008 2009
KO→CH 0.748 0.000 0.000 0.000 0.000 0.000 0.000 0.000 0.000 0.000
KO→JP 0.000 0.000 0.646 0.177 0.254 0.000 0.000 0.000 0.000 0.000
CH→KO 0.000 0.000 0.194 0.027 0.000 0.000 0.001 0.097 0.116 0.133
CH→JP 0.078 0.060 0.046 0.066 0.117 0.158 0.190 0.120 0.152 0.139
JP→KO 8.916 0.857 2.138 0.000 8.645 0.000 2.739 6.798 16.525 18.116
JP→CH 0.964 0.000 0.000 0.000 0.206 0.153 0.153 0.000 1.415 0.000
Sources: Same as Table 1Meanwhile, the reason why China does not have high trade intensity with Japan and Korea in the field of the main items of patient aids, that are medical device instruments, appliances, and apparatus seems to be because the overall level of medical devices and equipment and production facilities is not that high, even though China’s marketability along with rapid growth is getting bigger.
Ⅳ. Conclusion
In this article, the degree of relative concentration towards specific markets of Korea, China and Japan through trade intensity index is as follows.In the light of trade intensity change among these three countries, Korea in China, China in Japan, and Japan in China hold a dominant position, showing circulation patterns. On the whole, Korea shows more than 3 with China, and over 1.5 with Japan, which means that the trade intensity with Japan is on the decrease, and that with China is fluctuating, but on the increase. Therefore in the future trade intensity index, it is reasonable to assume that the variables of China’s market will have a significant effect on the trade intensity index of Korea and Japan, and the fact that China is gradually diverging from Japan’s existing trade influence into other markets, and the United States and EU’s investments increase in China is on the rise will act as a new variable in the trade intensity dynamics in the future.
Also, the result of the trade intensity index related to the main items in the medical device market is as follows. As the main items of diagnostic imaging, and high end medical devices such as MRI, CT, Ultrasound are the field where the accumulation of technology and big capital investment are necessary, it was noteworthy that on top of Japan’s strength in the diagnostic instruments area, the trade analysis of these three countries shows that China is growing its influence on both Korea and Japan in trade intensity. Regarding dental products, Korea and Japan’s influence on China appeared to be greater than China’s influence on Japan and Korea. Japan shows a high trade intensity index on dental products in both Korea and China. It is noticeable in the Orthopaedic & implantable’s trade intensity among the three countries that Japan exhibits a strong concentration in Korea and China on the whole in this industry with advancing growth.
Consumables hold a dominant position in the medical device market in the trade intensity of
the three countries. In the consumables market, Japan shows a strong trade intensity index in
Korea and China because of the fact that Japan has competitive and major global firms. As patient aids’ trade intensity by item reveals, Japan showed relatively high trade intensity in the area of medical device instruments, appliances, and apparatus in both Korea and China, but the reason why China does not have a high trade intensity with Japan and Korea seems to be because the overall level of medical devices and equipment and production facilities is not that high, even though China’s marketability along with rapid growth is getting bigger.
Through this research, implications as follows are obtained. What emerges from this research is that Japan is at a crossroads in its ability to continue as an important marketplace for medical device suppliers to Korea and China. Still today, the strategic importance of Japan and China is on par. This study shows that even though the size of the market in China will surpass Japan in importance in the future, this change need not be viewed as a negative trend. Japan’s strengths and the risk of doing business in China are perceived in a balance way. With these facts stated, Korean medical devices have price competitiveness compared to the United States, Europe and Japan, and also Korea has favorable geographic accessibility which leads to a broad potential of advancing into the market, and these add up to the big potential of moving into China’s market.
Also, entering the medical device market in Japan presents a lot of difficulties with its conservative characteristic and the strictness of medical device related regulations, but it needs to be overcome through a diversity of strategic developments such as previous experiences, and the prospects of the demand of products in Japan. In the global market, high technology and new technology account for the competitive advantage.
Also, under the circumstances of medical devices being emphasized as the growing industries of the future, to improve trade balance and export, the domestic production of diagnostic devices such as CT and MRI, and advanced‐materials‐made medical devices such as the artificial knee joint should be increasing. Medical diagnostic imaging devices are the biggest global market among medical devices, so through improving the technological competitiveness of Korea’s diagnostic imaging equipment, Korea can earn enormous economic effects. Especially, the ultrasound diagnostic imaging device is a representative export item with the growth rate of 10~30% each year.
In recent years, the medical industry has experienced a paradigm shift from sickness care to
healthcare. Higher priority is given to prevention rather than to cure. Proving this, the recent
domestic medical device industry economy shows that the general trend is aging health‐related medical devices such as hearing aids, dental implants and more, so intensive investment in and commercialization of R&D should be accomplished.
Overall, even though there are high barriers relating to the capital, scale, and technologies in the medical device market, for Korea to have competitiveness and to enter the global market, medical device R&D should be strengthened, new products continue to be introduced, and niche strategy for target markets be developed, in order to ensure its dominant position in market competition.
In closing, this research analyzed the three countries of Korea, China and Japan, which are geographically close, and in the center of Northeast Asia, but did not cover the United States, and Germany, the developed countries of the medical device market, through associating the medical device markets in these countries. Further studies on the medical device industry including the U.S., Germany, and the three countries in this study(Korea, China, and Japan), will be a worthy pursuit. Also, I admit that there is a limit to concrete Medical device classifications and systematic analysis of Medical devices in this paper.
References
Ames Gross and Arthur Chyan(2010), Updates on China’s Medical Market, http://www.pacificbridge medical.com/publications/china/2011_updates_china.php, accessed Feb, 2012.
Andrew Chen, The Chinese Medical Device Market, Insignt, 2010.
China Medical Device Newsletter, High Added‐value Medical Device Share on International Market Increased in First Half of 2010, Volume Ⅰ, CCPIE, 2011.
Espicom, The World Medical Markets Factbook, 2011.
Hanawa, Hirojuki. U.S. and Foreign Commercial Service and U.S. Department of State. “US&FCS Market Research Report: Medical Devices(Japan)”, 2003.
Industries Pharmaceutical & Life Sciences, Investing in China’s Pharmaceutical Industry‐2
ndEdition, PricewaterhouseCoopers, 2009.
Invest Japan Division, Attractive Sectors: Medical Care, JETRO, 2009.
Invest Japan Department, Japan’s Growing Major Market for Pharmaceuticals and Medical Devices
‐Moving toward the cutting edge, JETRO, 2009.
I.Yamazawa, “Intensity Analysis of World Trade Flow”, Hitotsubashi Journal of Economics, 10(2), 1970.
Jennifer Lau(2011), Medical Device Market: Mega trends in Asia, http://www.asianhhm.com/equipment _devices/medical_market.htm, accessed Jan 2012.
KHIDI, 2010 Medical Devices Market Research Reports, Korea Health Industry Development Institute, 2011.
, 2011 Medical Devices Market Research Reports, Korea Health Industry Development Institute, 2012.
Kim, Y. J., High‐tech medical device industry and R&D Investment, The Korean institute of Electrical Engineers, Vol. 58, No. 1, 2009.
Luo Zhe & Wu Xiaotong(2010), Analysis on Opportunities and Challenges of Chinese Medical Device Industry under New Health Care Reform, http://www.diva‐portal.org/fulltext01.pdf, accessed Feb 2012.
Park, S. C., A Comparative analysis of Patterns of Trade in Korea and ASEAN, Korea Institute for Economics & Technology, 1989.
Susan Kelly(2011), Japan disaster hits some medical device makers,http://www.reuters.com/assets/
print aid=USN 1524594620110315, accessed Nov 2011.
TechNavio Reports(2010), Medical Devices Market in China 2009‐2013,http://www.technavio.com/
content/medical‐devices‐market‐china‐2009‐2013‐0, accessed Feb 2012.
Thomas Alured Faunce, Toward a treaty on safety and cost‐effectiveness of pharmaceuticals and medical devices: enhancing an endangered global public good, Globalization and health, 2006.
UN, Comtrade http://comtrade.un.org, accessed Jan 2012.
U.S. International Trade Commission, Medical Devices and Equipment: Competitive Conditions Affecting U.S. Trade in Japan and Other Principal Foreign Markets Investigation No. 332‐
474, Publication 3909, 2007.
米国医潦機器‐IVD工業会, Comparison of market environment for medical devices in Japan,
China, and Korea, AMDD, 2011.
국문초록
한ᆞ중ᆞ일 의료기기 무역분석
배 홍 균*
4)
본 연구는 2국간 의료기기무역흐름(international trade flow)에 관한 무역결합도이론(Intensity Approach)을 통해 우리나라의 의료기기수출구조(export structure)와 중국과 일본의 수입구조(import structure)를 상호유기적으로 연계시킴으로써 한ㆍ중ㆍ일 의료기기 무역의 흐름을 보다 이론적이고 체계적으로 분석하였다. 또한, 우리의 대중국과 일본의 의료기기 수출증대(boost exports)에 기여할 수 있는 방안을 모색하는데 의의가 있다. 이에 본고에서는 한국과 의료기기(medical device) 시장에 서 주요한 경쟁관계에 있는 중국과 일본의료기기 시장의 중요성을 인식하고 특별히 의료기기의 한 ㆍ중ㆍ일 무역현황(situation of trade)을 살펴본다. 이어서 삼국의 의료기기에 있어서 상대적인 시장 흐름(market stream)과 주요 의료기기 품목의 무역결합도(trade intensity)를 알아보고, 한ㆍ중ㆍ일 의 료기기 시장의 지속적인 성장방안을 찾고자 한다.
주제어 : Medical device, Intensity Approach, Trade intensity, Medical device market, Comparative analysis
* 교수, 상지대학교 경상대학 무역학과