• 검색 결과가 없습니다.

Survey on Public Responses to Odor Produced at Jangrim-Sinpyoeng Municipal and Industrial Wastewater Treatment Plant in Busan

N/A
N/A
Protected

Academic year: 2021

Share "Survey on Public Responses to Odor Produced at Jangrim-Sinpyoeng Municipal and Industrial Wastewater Treatment Plant in Busan"

Copied!
8
0
0

로드 중.... (전체 텍스트 보기)

전체 글

(1)

신평장림 공단 폐수처리장 발생의 악취 조사연구

손현근·

Subpiramaniyam Sivakumar

· 윤영훈*

고신대학교 보건환경학부, *한국환경산업기술원 녹색기술개발실

Survey on Public Responses to Odor Produced at Jangrim-Sinpyoeng Municipal and Industrial Wastewater Treatment Plant in Busan

Hyun-Keun Son, Subpiramaniyam Sivakumar

, and Young Hun Yoon

*

Department of Health and Environment, Kosin University, Busan, Korea

*

Green Technology Development Office, Korea Environmental Industry and Technology Institute, Seoul, Korea

ABSTRACT

Objective: Emissions of volatile organic compounds (VOCs) from municipal wastewater treatment plants and industrial wastewater are often overlooked as sources of exposure to toxic chemicals. VOCs from such sources evaporate readily into the air and may have significantly adverse impacts on public health. The present study aimed to establish the concentration of VOCs released from Jangrim-sinpyoeng Municipal and Industrial Wastewater Treatment plant (JWTP) in Busan, South Korea and assess the causes of the odor/stench in the surrounding residential facilities. Stench intensity, frequency and release time, and wind direction were also monitored.

Methods: Onsite data were collected on a daily basis from a laboratory located on the JWTP premises through a period spanning 2006 to 2010. A second set of data was obtained in 2006 by conducting a questionnaire survey with 210 respondents living near JWTP. The experimental and survey data were analysed statistically using the SPSS package.

Results: The survey results showed that people residing around JWTP strongly perceive a stench from the plant. The intensity of the stench was influenced significantly by wind direction and the location of the apartments facing the JWTP. Public participation formed a significant step in determining the quality of the study environment.

Conclusion: Onsite data and survey data obtained in 2006 indicate that the nature of the odor experienced by residents is due to the intensity of total VOCs released by JWTP. However, additional research is needed to determine the effects of the VOC pollution on public health and quality of life.

Key words: Volatile organic compounds, Wastewater, Odor, Stench, VOCs I. Introduction

Various domestic and industrial activities result in the production of industrial and municipal wastes which then act as emission sources of hazardous substances.

1)

Decomposition of these municipal

and industrial wastes results in the release of odor into the surrounding air thus impacting residentials.

2-6)

Odor nuisances are becoming more frequent because of urbanization and the consequent location of treatment sites near residential places.

7)

Efforts to reduce emissions are very limited since protests

Corresponding author: Department of Health and Environment, Kosin University, Busan 606-701, Korea, Tel:+82-10-8108-4978, Fax: +82-51-911-2514, E-mail: [email protected]

Received: 16 March 2011, Revised: 18 May 2011, Accepted: 17 June 2011

(2)

from people perceiving the odor is also very limited.

8)

Odor is a sensation caused by odorant molecules in the air. Odor perception is the result of reaction between volatile molecules inhaled through the air by the human nose and olfactory sensory neurons situated in the upper parts of the nasal cavity in man.

8)

Pilpel

et al.9)

described the transduction mechanisms involved in the stimulus generation at a molecular level in humans. The degree of odor perception by humans is determined by several factors such as individual physiology, individual perception of smell and interaction with factors such as physiology, weather phenomena, and various other odors

10-12)

Estimation of odor intensity using instrumental techniques have been reported.

13,14)

Similar studies were carried out in swine farms in upper mid West USA.

15)

According to analysis of ambient odors from air samples collected from feeding yards, pen yards, and a wastewater storage site in USA, such odors were dominated by hydrogen sulphides and ammonia, in excess of EPA guideline levels. Lim

et al.15)

found that the intensity of stench/odor in the study area was significantly influenced by the direction of the wind.

Volatile organic compounds (VOCs) are known to produce the widest range of odors in the air

16)

with their inorganic counterparts like hydrogen sulfide and ammonia. Generally, odor is perceived physically by the nose receptors and psychologically processed in the brain, thus rendering it difficult for quantitative measurements. Odor perception is personal and is confounded by a number of factors such as gender, age, state of health and individual effects which is why people may not be bothered by odors from their own bodies.

Wind speed and direction can exert a direct effect on the dispersion of odorous compounds.

17)

High speed winds will spread the odor rapidly, thereby diluting its intensity over a wider area under the low wind speed conditions; the odor is close to the ground, thereby strengthening its intensity. The specific weight/density of the odorant molecule will also influence its dispersion by wind. As heavy odors stay close to the ground they can be detected more easily by humans.

During decomposition of organic waste (such as sewage), 80 to 200 different gases are produced.

18)

A combination of several gases together can

produce odors either higher intensity or lower intensity than the individual gases.

18,19)

Studies on Creeks that acted as open sewers carrying wastewater from industry and residential areas in Izmir city in Turkey revealed that volatile sulphur compounds caused most of the odor.

20)

A similar study, on the effects of exposure to biosolids used on farms in Wood County in Ohio, USA, reported that health hazards were significantly elevated among the residents.

21)

The symptoms reported included increased secretion of tears, abdominal bloating, jaundice, skin ulcers, dehydration, weight loss and general body weakness. The report also showed increased cases of bronchitis, upper respiratory infection and giardiasis.

22)

Little information is available on the relationship between odor and human, as most studies emphasize the effect of individual gases like ammonia rather than the odor as a whole.

18)

The aim of this research was 1) to establish if the Jangrim-Sinpyoeng Municipal and Industrial Wastewater Treatment Plant (JWTP) in Busan City release any bad odor and 2) if they are released, how serious it will be on the local residents. It was also intended to assess the possible management practices to mitigate the effects.

II. Materials and Methods

1. Data from onsite laboratory

The 5 years data (2006 to 2010) in this study was collected from two major sources. The first form of the data with different chemical parameters were obtained from the onsite laboratory at the Jangrim-Sinpyoeng area in Busan city (035

o

04' 51''N and 128

o

58' 18''E), which was maintained by the Korea Institute of Public Health and Environment.

The detailed information about the data collection of chemical and physical parameters is given in Table 1. The sampling was done every hours by the instrument installed at the onsite laboratory was online gas chromatography – flame ionization detector (GC-FID) for the analysis of VOC sub- stances. All data were calculated to average ppm per day. All the VOC compounds were computed as prescribed by Son and Striebig

7)

(2003) (Table 1). Also, the release of odor substances was correlated with wind direction and speed.

The stench/odor intensity (Y) data for all VOC

(3)

Table 1. Sampling period and parameters of interest on onsite data Year Sampling period Total

operating

time (hrs) VOC type Physical

parameters Start

Month/day End Month/day

2006 01/01 12/31

8760

Class 1: toluene, m/p-xylene, styrene, o-xylene,

Class 2-3: ethane, ethylene, propane, propylene, acetylene, Class 4: iso-Butane, n-butane, trans-2-butene, 1-butene, cis-2-butene, Class 5: cyclopentane, iso-pentane, n-pentane, trans-2-pentene,

1-pentene, cis-2-pentene, iso-prene,

Class 6: 2,2-dimethylbutane, 2,3-dimethylbutane, 2-methylpentane, 3-methylpentane, n-hexane, 1-hexene, methylcylopentane, benzene, cyclohexane,

Class 7: 2,4-dimethylpentane, 2-methylhexane, 2,3-dimethylpentane, 3-methylhexame, n-heptane, methylcyclohexane,

Class 8: 2,2,4-trimethylpentane, 2,3,4-trimethylpentane, 2-methylheptane, 3-methylheptane, n-octane, ethylbenzene, Class 9: n-nonane, isopropylbenzene, n-propylbenzene, m-

ethyltoluene, p-ethyltoluene 1,3,5-trimethylbenzene, o-ethy;

toluene, 1,2,4-trimethylbenzene, 1,2,3-trimethylbenze Class 10-12: n-decane, m-diethylbenzene, p-diethylbenzene,

n-undecane, n-dodecane

Wind direction, wind speed, temperature humidity and

2007 01/01 12/31

2008 01/01 12/31

2009 01/01 12/31

2010 01/01 12/31

Table 2. Variables included in the questionnaire

Sl. No. Variables Value

1. Sex Male (1), Female (2)

2. Age >20 (1), 21-30 (2), 31-40 (3), 41-50 (4), 51-60 and above (5)

3. Living area Dongwon royal (1), Jangrim-dong (2), Business area (3), working area (4), others (5) 4. Frequency Every day (1), 4-5 times per day (2), 2-3 times per day (3), weekly once (4), 1 or 2 days

(5), does not occur (6)

5. Responses about smell Every day (1), 4-5 times per day (2), 2-3 times per day (3), weekly once (4), 1 or 2 days (5), does not occur (6)

6. Happening time 6-12 am (1), 12-18 pm (2), 12-24 pm (3), 0-6 am (4), irregular (5)

7. Duration of happening One or more days per week (1), less then one day bur more than 1 hr (2), less than 1 hr but more than 15 min (3), less than 15 minutes (4), not feel any odor (5), does not occur 8. Wind direction East (1), west (2), south (3), north (4), northwest (5), southwest (6), northeast (7),

southeast (8)

9. Displeasure level Not at all unpleasant (1), Almost does not offend (2), yes I just (3), somewhat Offensive (4), very offensive (5)

10. Seriousness Not at all serious (1), almost no serious (2), serious (3), less seriousness (4), very seriousness (5)

11. Living environment Very satisfied (1), somewhat satisfied (2), usual (3), somewhat dissatisfied (4), very dissatisfied (5)

12. Air environment Very satisfied (1), somewhat satisfied (2), usual (3), somewhat dissatisfied (4), very dissatisfied (5)

13. Who’s responsibility to

protect the environment Municipal corporation (1), NGOs (2), Media (3), Residents (4), factories (5), Others (6) 14. Regulation status Very weak (1), slightly weak (2), keep current (3), slightly enhanced (4), much enhanced (6) 15. Way of handling by the

environmental protection authority

Very satisfied (1), satisfied (2), usual (3), some dissatisfied (4), very dissatisfied (5) 16. Involvement of local

residents to protect the environment

Do not participate (1), depends on the situation (2), active participation (3)

(4)

substances were calculated from the following formulae,

Y = [a

×

Log (X) + b]

1

+ [a

×

Log (X) + b]

2

+ …..[a

×

Log (X) + b]

n

X: headspace in ppm, a and b: threshold level in ppm, Y: higher than fixed ppm level based on smell)

2. Data from questionnaire

The second source of data was surveyed in the year 2006 from individuals living around JWTP area. Two types of respondents were selected, one category was native residents (experimental group) and other was floating population (control group), working in that area for a long time. Totally 210 residents were interviewed

23,24)

(Table 2). The questionnaire data were correlated using the statistical package for social sciences (SPSS 12.1).

III. Results

1. Onsite laboratory analysis

The summary of the concentration data for the VOC substances in air is shown in Table 3. VOC concentrations in the air varied widely in the measuring site with an overall range from less than1 ppm to >9 ppm (Table 3) with a mean of 3.0 to 3.1 ppm (Table 4). Data clearly show that the maximum intensity of total VOCs released every year (2006 to 2010) into the air was >9 ppm (Table 3). At >9 ppm, the highest duration of VOC release (400 and 360 hrs) was observed in

Table 3. Annual VOC intensity level Intensity

level (ppm)

2006 2007 2008 2009 2010

Time

(hours) %* Time

(hours) %* Time

(hours) %* Time

(hours) %* Time

(hours) %*

> 1 8595 98.1 8592 98.1 6792 77.3 7056 80.5 7015 80.1

> 2 4677 53.9 4680 53.4 5016 57.1 5184 59.2 5281 60.3

> 3 3301 37.7 3312 37.8 3696 42.1 3384 38.6 3655 41.7

> 4 2326 26.5 2376 27.1 2616 29.8 2352 26.8 2214 26.5

> 5 1739 19.8 1728 19.7 1608 18.3 1704 19.5 1672 19.1

> 6 1255 14.3 1248 14.2 1008 11.5 1152 13.2 1456 16.6

> 7 857 9.8 864 9.9 528 6.0 648 7.4 1264 14.4

> 8 560 6.4 600 6.8 264 3.0 384 4.4 386 4.4

> 9 400 4.6 360 4.1 168 1.9 216 2.5 272 3.1

* % = (total hours released / hours per year) × 100

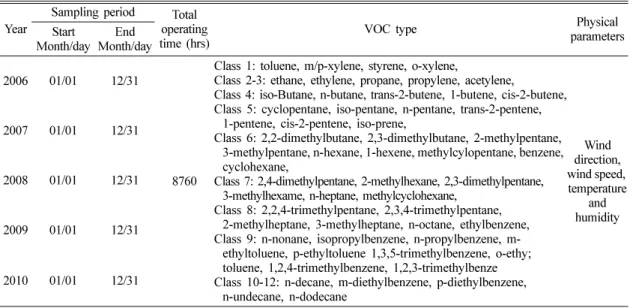
Table 4. Annual mean values of VOC’s released from Jangrim-Sinpyoeng Municipal and Industrial Wastewater Treatment Plant, Busan

Year Mean (ppm)

2006 3.0

2007 3.0

2008 3.0

2009 3.1

2010 3.1

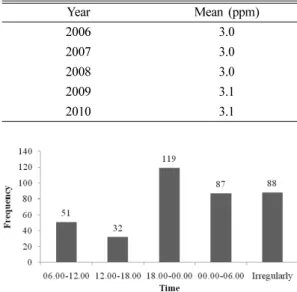
Fig. 1. Frequency of odor in different time period.

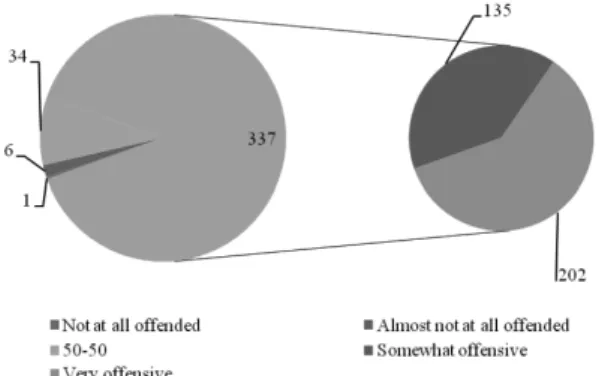
Fig. 2. Resident responses about the industrial stench.

(5)

the year 2006 and 2007 (Table 3). At above 1 ppm level, the highest duration occurred in the year 2006 (8595 hrs) and 2007 (8592 hrs).

2. Responses to questionnaire

The result from the questionnaires were analyzed and represented in graphs (Figs. 1 to 9). The results of the study showed that most of the residents (119) living in Jamgrim-Sinpyoeng area felt the stench between 6 to 12 pm (18.00 to 00.00). Eighty eight (88) residents felt heavy and irregular stench between 0.00 to 6.00 o’clock.

Less than 51 residents felt the stench between 6.00 to 18.00 o’clock. Fig. 2 illustrates how the residents coped with the industrial stench. This section had five options (very satisfied, a little satisfied, normal, some what dissatisfied and very dissatisfied) and the respondents were required to choose only one.

The results clearly show that more than 40 per cent of the residents were moderately dissatisfied or very dissatisfied in their daily life because of the stench. The next section of the questionnaire dealt with the relationship between the wind direction and stench perception (Fig. 3). The respondents were required to choose the direction in which they felt the stench came from. The feedback from the questionnaire indicated that most of the residents (24%) felt the wind come from west. However, less than 13% of the residents felt different directions like northwest (12.7), southwest (12.4), south (7.1), north (6.6), east (4.5%), southeast (3.7%) and northeast (3.2%).

The questionnaire also asked the respondents to find the intensity of the stench at 6 scale levels based on the resident responses (Fig. 4). Responses were given a 6 point scale ranging from not at all offended, almost not at all offended, 50-50, somewhat

offensive, and very offensive. The results are shown in Fig. 4. The results indicate that most respondents (337) felt that it was very offensive (202) and somewhat offensive (135). Thirty five (35) respondents felt 50-50, 6 respondents felt

Fig. 3. Relationship between wind direction and stench perception.

Fig. 4. Residents responses about the degree of nuisance.

Fig. 5. Resident satisfaction about their living environ- ment.

Fig. 6. Resident satisfaction about the air environment.

(6)

almost not at all offended and 1 respondent felt not at all offended. The next section of the questionnaire indicates the residents satisfaction with the environment in relation to the presence of the stench (Fig. 5). The order of satisfaction based on their living environment was: some what dissatisfied (41%) > very dissatisfied (38.4%) >

normal (17.5%) > a little satisfied (2.6%) > very satisfied (0.5%). The next part of the questionnaire was sorted to find out the resident satisfaction of air quality with respect to presence of stench (Fig.

6). Many residents who participated in this programme felt that their air quality is somewhat dissatisfied (135) and very dissatisfied (206). The resident’s satisfaction in the questionnaire about the agencies involved with the regulation of their living environment air quality is shown in Fig. 7.

Most respondents (>84 percent) felt that they were somewhat dissatisfied and very dissatisfied with the agencies involved in this issue to minimize risk.

This section of the questionnaire was sorted to assess the resident’s view of which organization should be responsible for clearing the stench off the area. Forty percent of residents who participated in the questionnaire survey felt that the Busan city agency would have the major response to maintain the healthy air environment, and 29 and 19% felt responsibility of Sahagucheong Agency and local Environment Agency (Fig. 8). However, some residents (<10%) felt responsibility of other agencies like Corporate agency, Dongsamuso agency and Local residents. This part of the questionnaire was concerned with the residents’ view in identifying the most effective way of dealing with the stench

problem (Fig. 9). Most respondents (176) recom- mended “stink prevention facilities enlarged” and prior leather factory (83) or strengthening crackdown (48) to control the stench problem. However, less than 25 respondents felt “stench toxicity inves- tigation”, “strengthen civil group”, “promote understanding” and “tree planting” is most effective way of dealing the stench problem.

Responses to the questionnaire indicates that the people living close to the plant receive odor/stench of varying intensities at different times of the day depending on where their apartments are located in relation to the plant. People living in apartments situated at the West seemed to be affected the most. Physicochemical factors like wind speed, specific weight/density of the odorising molecules, temperature and humidity were found to affect the intensity of stench.

The results show that people living close to the plant receive higher concentration of the stench.

Residents who felt the stench between 18.00 to 0.0 hours may be daily worker, and they felt the

Fig. 7. Residents satisfaction about the agencies involved in the regulation of air quality.

Fig. 8. Residents view of responsible organization to maintain the air quality.

Fig. 9. Residents view about the stench problem.

(7)

stench after returning to home at evening, even though the stench was frequently released on that day. In addition, house wives and others those who stay at home felt stench at different time periods.

IV. Discussion

The data on the chemical composition of the ambient odorant molecules in terms of VOCs present here (Table 1) were in agreement with analytical data obtained in similar studies such as those by Kim

et al.

and Aysen.

20,25)

The present study results indicate that the JWTP release VOCs into the air at a wide range of concentrations (Table 3). Generally, the VOC’s released in lower concentration (>1 ppm) level is high (8595 hrs) and it decreased with increasing concentration in all years (Table 3). As per data, it can be concluded that VOC’s released at different concentration levels, even though the duration of release of higher concentration was low, may be very harmful to the people living in that area. As shown in Table 4, the annual mean value of total VOC is above 3.0 ppm in all durations (2006 to 2010). This finding indicates that VOC emission is static in origin.

Surveys by questionnaire are probably the most common design in environmental research. In the present study, questionnaire survey was conducted in the year 2006 with residents at five different apartments in and around Jamgrim-Sinpyoeng area (Table 2). The questionnaire indicates the nature of the odor felt by the residents. The final result was then represented as odor frequency versus time (Fig. 1). The majority of residents reported unpleasant living environment. None of the residents took up the very satisfied option about the agencies.

The questionnaire data collected from the year 2006 concluded that the majority (very dissatisfied 38.4% and somewhat dissatisfied 41%) of respondents felt dissatisfied about their living environment. An onsite data and survey data obtained the same year 2006 indicates that the nature of the odor felt by the residents was due to the intensity of total VOCs released by JWTP.

V. Conclusion

Our study results from onsite monitoring as well

as questionnaire suggests that the air quality in Jangrim-sinpyoeng industrial area should be imme- diately responded. The need for public involvement in decision making process is emphasized. The annual mean value of total VOC is above 3.0 ppm in all years indicates that VOC emission is static in origin. Therefore, further research need to be done to assess the effect of the volatile organic compound on people’s health and quality of life.

There is need to ensure that the plant releases of volatile organic compound should be negligible if not zero in the near future and this means more advanced filtering of air from the area.

References

1. Bianchi AP, Varney MS. Volatalisation processes in wastewater treatment plants as a source of potential exposure to VOCs. Ann Occup Hyg.

1997; 41: 437-454.

2. Pellizzzari ED. Volatile organics in aeration gases at municipal treatment plants. USEPA, Washing- ton DC, EPA Report-600/2-82-056. PB82-227760, 1982.

3. Namkung E, Rittman BE. Estimating volatile organic compounds from publicly owned treat- ment works. J Water Pollut Control Ass. 1987; 59:

670-678.

4. Ciccioli P. VOCs and air pollution. In: Bloemen HJTh, Burn J. editors. Chemistry and analysis of volatile organic compounds in the environment, Blackie Academic press, London; 1993. p.92-165.

5. Wallace L. Indoor particles: A review. J Air Waste Manag Assoc. 1996; 46: 98-126.

6. Vandergheynst JS, Cogan DJ, Defelice PJ, Gosset JM, Walker LP. Effect of process management on the emission of organosulfur compounds and gas- eous antecedents from composting process. Envi- ron Sci Technol . 1988; 32: 3713-3718.

7. Son HK, Striebig BA. Quantification and treat- ment of sludge odor. Environ Eng Res. 2003; 8:

252-258.

8. Davoli ML, Gangai L, Morselli D, Tonelli D.

Characterisation of odorants emissions from land- fills by SPME and GC/MS. Chemosphere . 2003;

51: 357-368.

9. Pilpel Y, Sosinsky Y, Lancet D. Molecular biol- ogy of olfactory receptors. Essays Biochem . 1998;

33: 93-104.

10. Cometto-Muniz E, William SC, Abraham MH.

Quantification of chemical vapors in chemosen-

(8)

sory research. Chem Senses. 1998; 28: 467-477.

11. Firestein S. How the olfactory system makes sense of scents. Nature . 2001; 413: 211-218.

12. Noble R, Hobbs PJ, Dobrovin-Pennington A, Mis- selbrook TH, Mead A. Olfactory response to mushroom composting emissions as a function of chemical concentration. J Environ Qual . 2001; 30:

760-767.

13. Chen LY, Jeng J, Ming-Whei C, Shui-Hway Y.

Rationalization of an odor monitorig system: a case study of Lin-Yuan Petrochemical Park. Envi- ron Sci Technol . 2000; 34: 1166-1173.

14. Giavini M, Benfenati E, Fanelli R, Davoli E. A mass spectrometric approach in odor impact assessment. A mass spectrometric approach in odor impact assessment. ASMS Conference. Long.

Beach, CA, 2000.

15. Lim TT, Heber AJ, Ni JQ, Sutton AL, Kelly DT.

Characteristics and emission rates of odor from commercial swine nurseries. Amer Soc Agr Eng . 2001; 44(5): 1275-1282.

16. Kamadia VV, Yoon Y, Schilling MW, Marshall DL. Relationships between odorant concentration and aroma intensity. J Food Sci . 2006; 71: 193-97.

17. De Bode MJC. Odour and ammonia emissions from manure storage. In: Nielsen VC, Voorburg JH, L’Hermite P. editors. Odour and Ammonia Emissions from Livestock Farming, Elsevier Applied Science Publishers, New York. 1990.

p.59-67.

18. Schmidt DR. Livestock and poultry odor emis- sions database. In: Proceedings of the Water Envi-

ronment Federation symposium on Odors and VOC Emissions 2000, Hyatt Regency, Cincinnati, Ohio. 2000. p.16-19.

19. De Bode MJC. Odour and ammonia emissions from manure storage. In: Nielsen VC, Voorburg JH, Hermite PL. editors. Odour prevention and control of organic sludge and livestock farming.

Appl Sci . 1991; 59-66.

20. Aysen M. A study of volatile organic sulfur emis- sions causing Urban Odors. Chemosphere. 2003;

51: 245-252.

21. Burton NC, Trout D. Health Hazard Evaluation Report HETA 98-0118-2748, Bio-solids Applica- tion Process Le Sourdsville, Ohio, Health Hazard Evaluation, NIOSH, Report 98, 0118-2748, 1998.

22. Sadik K, Sheryl AM, Michael B, Robert V, McNulty W, Kevin C. Health survey of residents living near farm fields permitted to receive biosol- ids. Arch Environ Occup Health . 2007; 62: 5-11.

23. Parker DB, Rhoades, Schuster GL, Koziel JA, Per- schbacher-Buser ZL. Odor characterization at open-lot beef cattle feedyards using triangular forced-choice olfactometry. Amer Soc Agr Eng . 2003; 48: 1527-1535.

24. Segala CD Poizeau, Mace JM. Odors and health: a descriptive epidemiological study around a waste- water treatment plant. Revue d’epidemologie Sante Publique. 2003; 51: 201-214.

25. Ki-Hyun K, Choi YJ, Jeon EC Sunwoo Y. Char-

acterization of malodorous sulfur compounds in

landfill gas. Atmos Environ. 2005; 39: 1103-1112.

수치

Table 1.  Sampling period and parameters of interest on onsite data Year Sampling period Total
Table 3.  Annual VOC intensity level  Intensity  level (ppm) 2006 2007 2008 2009 2010Time  (hours) %* Time  (hours) %* Time  (hours) %* Time  (hours) %* Time  (hours) %* &gt; 1 8595 98.1 8592 98.1 6792 77.3 7056 80.5 7015 80.1 &gt; 2 4677 53.9 4680 53.4 50
Fig. 3. Relationship between wind direction and stench perception.
Fig. 7. Residents satisfaction about the agencies involved in the regulation of air quality.

참조

관련 문서

• Controlled decomposition of organic materials such as plant materials, animal waste, food.. waste, and wastewater sludge

Sources: metal plating, rechargeable batteries, smelting (제련), refining, mine drainage, industrial wastewater, corrosion of galvanized pipe in the water distribution

페놀에 오염된 수돗물 을 마신 수돗물을 마신 시민들은 구토・설사・복통으로 고통을 겪었으며 수 돗물로 만든 두부・김치・콩나물 등은 악취 때문에 폐기

• Stormwater treatment.. 1) Domestic wastewater: Wastewater discharged from residences and from commercial, institutional, and similar facilities.. 2) Industrial

Protecting the aquatic ecosystem in the water body Recover water and resources from wastewater and. produce renewable energy using wastewater constituents.. • So, the goal

Based on the introduction of industrial wastewater TOC effluent standard, the distribution characteristics of organic matter according to the type of business

Underground Sewage Treatment Plant, Trondheim, Norway 19.. Underground Sewage Treatment Plant,

At first, I arranged the current conditions and function of container terminal in the port of Busan through the existing literature study on the function