Introduction
Titanium dioxide (TiO 2 ) is an important biomaterial with its advantages in chemical stability, high refractive index [1,2]
and photocatalytic activity [3-5]. Several crystal forms of TiO 2
including anatase, brookite, and rutile are known to exist with different physiochemical properties. The anatase and brookite are less stable than the rutile and transform to the rutile by heat or other environmental conditions [6]. Rutile phase TiO 2
(R-TiO 2 ) was widely used in pigment and cosmetic industry [7].
R-TiO 2 provides the white opacity with high refractive index and protects paints from chalking due to low photocatalytic activity [8]. Similarly R-TiO 2 protects the skin from ultraviolet
light and reduce the potential risk effect of free radicals on skin aging, which makes R-TiO 2 useful for the sunscreens [9,10].
For therapeutic point, TiO 2 was reported to have anti-bacteria, anti-fungal and anti-cancer effects [5,11,12]. In dental field, TiO 2 was used for oral hygiene as an ingredient of toothpaste or mouthwash [13,14] and for polymeric resin-based compos- ites [15]. Since R-TiO 2 has beneficial advantages in chemical stability, low photocatalytic activity and anti-infection activ- ity, we proposed an idea that TiO 2 NPs in rutile phase might be suitable for the aesthetic white pigmentation at the site of tooth decay. To pursuit this idea further, we initiated the syn- thetic process of R-TiO 2 NPs and attempted to characterize its properties by various methods. Here, we report the prepara- Int J Oral Biol 44:108-114, 2019
pISSN: 1226-7155 • eISSN: 2287-6618 https://doi.org/10.11620/IJOB.2019.44.3.108
Preparation and characterization of rutile phase TiO 2 nanoparticles and their cytocompatibility with oral cancer cells
Vu Phuong Dong, Nguyen Thi Kieu Trang, and Hoon Yoo*
Department of Pharmacology and Dental Therapeutics, College of Dentistry, Chosun University, Gwangju 61452, Republic of Korea
In the present study, rutile phase titanium dioxide nanoparticles (R-TiO 2 NPs) were prepared by hydrolysis of titanium tetrachloride in an aqueous solution followed by calcination at 900℃. The composition of R-TiO 2 NPs was determined by the analysis of X-ray diffraction data, and the characteristic features of R-TiO 2 NPs such as the surface functional group, particle size, shape, surface topography, and morphological behavior were analyzed by Fourier-transform infrared spectroscopy, scanning electron microscopy and energy dispersive X-ray spectroscopy, transmission electron microscopy, dynamic light scattering, and zeta potential measurements. The average size of the prepared R-TiO 2
NPs was 76 nm, the surface area was 19 m 2 /g, zeta potential was −20.8 mV, and average hydrodynamic diameter in dimethyl sulfoxide (DMSO)–H 2 O solution was 550 nm. The 3-(4,5-dimethylthiazol-2-yl)-2,5-diphenyltetrazolium bromide (MTT) assay and morphological observations revealed that R-TiO 2 NPs were cytocompatible with oral cancer cells, with no inhibition of cell growth and proliferation. This suggests the efficacy of R-TiO 2 NPs for the aesthetic white pigmentation of teeth.
Keywords: Titanium dioxide nanoparticles, Rutile, Cytocompatibility, FaDu cells, YD-15 cells
Received August 16, 2019; Revised September 15, 2019; Accepted September 18, 2019
*Correspondence to: Hoon Yoo, E-mail: [email protected] https://orcid.org/0000-0002-9249-1446 Copyright © The Korean Academy of Oral Biology
Original Article IJOB
tion of TiO 2 NPs in rutile phase by the fast and simple method:
boiling TiCl 4 solution in the air, adjusting pH with NH 4 OH and calcinating at 900℃. The physiochemical properties of the prepared R-TiO 2 NPs were examined by Fourier transform in- frared spectroscopy (FT-IR), X-ray diffraction (XRD), scanning electron microscopy and energy dispersive X-ray spectroscopy (SEM-EDS), transmission electron microscopy (TEM), dynamic light scattering (DLS), and zeta potential measurement. Finally R-TiO 2 NPs were tested on two oral cancer cell lines, FaDu and YD-15, for the evaluation of cytocompatibility.
Materials and Methods
1. Preparation of rutile phase titanium dioxide nanoparticles
10 mL of TiCl 4 (99.9%; Sigma-Aldrich, St. Lous, MO, USA) was slowly added to 100 mL of cold water, stirred for 2 hours at room temperature and then refluxed at 100℃ for 1 hour to form a milky slurry suspension. After cooling down the suspension, 10 mL of (NH 4 ) 2 SO 4 was added and the pH was adjusted to 7.0 with NH 4 OH solution. Excess of chlorine and sulfate was removed by the centrifugation with distilled water before heating at 100℃ for 12 hours. The dried white cake of TiO 2 was grinded and calcinated at 900℃ for 2 hours.
2. Fourier transform infrared spectroscopy
FT-IR spectrum was recorded in the range of 400–4000 cm –1 by using a Nicolet 6700 FT-IR spectrometer (ThermoFisher, Waltham, MA, USA) with 32 scans for each sample.
3. X-ray diffraction
XRD from 20° to 80° was carried out by an X’Pert PRO Al- pha-1 instrument (Malvern Panalytical, Almelo, Netherlands) with the diffractometer using Cu K α radiation (wavelength λ = 1.54056 Å). The measurement was done with the step-size of 0.02° and scan step-time of 1 second. Data was collected based on angle (2 θ) between diffracted X-ray with incident X-ray beam. The crystallinity of TiO 2 was estimated from the specific peak intensity. The particle size and specific surface area of the TiO 2 were assessed by using following equations:
D = K λ / βcosθ S = 6 × 10 3 / dD
D is the crystal size (nm). K is Scherrer’s constant (0.89). λ is the X-ray wavelength of Cu K α radiation (λ = 1.54 Å). β is the line width of half maximum (radian). θ is Bragg’s diffraction angle. S is specific surface area. d is the theoretical density of TiO 2 particles (for rutile, d = 4.25 g/cm 3 ).
4. Scanning electron microscopy and energy dispersive X-ray spectroscopy
SEM-EDS analysis was carried out by using Hitachi S-4800 SEM (Hitachi, Tokyo, Japan) equipped with X-ray microanalysis to determine the surface topography and analyze the element of the prepared TiO 2 .
5. Transmission electron microscopy and selected area electron diffraction
TEM were recorded from a Hitachi H-9500 high resolution 300 kV analytical TEM system (Hitachi). The sample for TEM was placed on carbon-coated copper grids and dispersed into ethanol.
6. Dynamic light scattering and zeta potential
DLS and zeta potential measurement were performed by us- ing the high performance particle size analyzer Malvern Zeta- sizer (Malvern Panalytical), dispersing 0.01 mg of TiO 2 in 1 mL of solvent (dimethyl sulfoxide [DMSO]: H 2 O, 1:9 (v/v)).
7. Cell culture
FaDu human hypopharyngeal adenocarcinoma and YD-15 human tongue cancer cells, supplied by the Korean Cell Line Bank, were cultured in MEM and RPMI-1640 media (WEL- GENE, Gyeongsan, Korea), supplemented with 10 % fetal bo- vine serum and 100 units/mL penicillin/streptomycin, respec- tively. The cells were seeded to the density of 2 × 10 5 cells/mL and incubated for 24 hours in an incubator with 5 % CO 2 .
8. Cytotoxicity assay
The cytotoxicity of TiO 2 NPs in rutile phase was evaluated by
an 3-(4,5-dimethylthiazol-2-yl)-2,5-diphenyltetrazolium bro-
mide (MTT) assay (Sigma-Aldrich). Briefly, cells were seeded
at the density of 4 × 10 4 cells per well in 96-well plates and
incubated overnight. Cells were treated with various concen-
trations of TiO 2 NPs in suspension and incubated for 24 or 48 hours. After incubation, the media was removed and 50 µL of MTT solution (0.5 mg/mL) was added and kept in dark for 4 hours at 37℃. MTT solution in each well was replaced by 100 µL of DMSO to dissolve crystal violet formazan. The formazan solutions, after centrifugation, was used to measure the ab- sorbance at 570 nm on Multiskan TM FC Microplate Photometer (ThermoFisher).
Results
1. Preparation of rutile phase titanium dioxide nanoparticles
TiO 2 was prepared by the hydrolysis reaction of TiCl 4 in strong acidic environment (pH < 1) as described in the reaction scheme below.
TiCl 4 + 2H 2 O → TiO 2 + 4H + + 4Cl –
The nucleated TiO 2 were initially amorphous but, after ad- justing pH to 7 with NH 4 OH solution, converted into the mixed composition of rutile and anatase phase (named as raw TiO 2 ).
The transformation of raw TiO 2 into phase-pure rutile TiO 2 was achieved by the calcination at 900℃ for 2 hours (Fig. 1).
2. Phase composition analysis of rutile phase titanium dioxide nanoparticles
The calcination at 900℃ for 2 hours caused dramatic phase transformation in crystal structure, converting raw TiO 2 into
highly pure rutile form of R-TiO 2 as shown in the XRD pattern (Fig. 1). The characteristic XRD peaks of R-TiO 2 NPs were consistent with the ones of standard rutile phases from the database of the Joint Committee on Powder Diffraction Stan- dards [JCPDS 21-1276: 2 θ = 27.47°(110), 36.11°(101), 39.21°
(200), 41.27°(111), 44.11°(210), 54.33°(211), 56.63°(220), 62.79°(002), 64.08°(310), 69.05°(301), 69.87°(112), 72.83°
(320), and 76.87°(202)]. The appearance of high and sharp diffraction peaks after calcination at 900℃ indicated the pure crystalline of R-TiO 2 NPs. Average crystal size of the R-TiO 2 NPs, after calcination at 900℃, increased from 27 to 76 nm while specific surface area was reduced from 57 to 19 m 2 /g (Table 1).
3. Surface function analysis of R-TiO 2 NPs
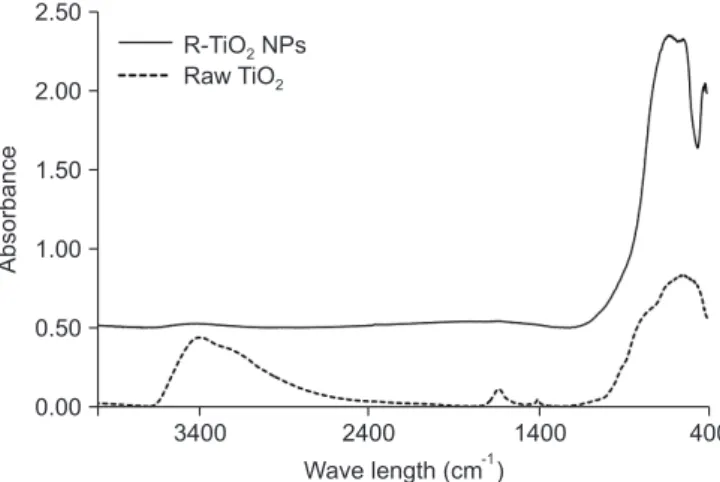
FT-IR spectrum of R-TiO 2 NPs showed a dramatic change in the relative intensity and the number of bands after calcination (Fig. 2). The characteristic broad bands at 400 to 1000 cm –1 , corresponding to Ti-O-Ti vibration of the mixed polymorphic phases of TiO 2 , and bands at 3,600–3,100 cm –1 and 1,660–
1,640 cm –1 , due to the hydrated water, were appeared in raw
Intensity (au)
20 30 40 50 60 70
2,000
1,000
2 ( ) 0
R-TiO NPs Raw TiO
2 2
80
Fig. 1. X-ray diffraction pattern of rutile phase titanium dioxide nanopar-
Table 1. Calculated crystallite size, specific surface area, and per- cent of rutile form of TiO 2 NPs
TiO 2 Peak width
(°) 2θ (°) Average
size (nm)
Specific surface area (m 2 /g)
Raw TiO 2 0.315 25.38 27 57
R-TiO 2 NPs 0.138 27.45 76 19
R-TiO 2 NPs, rutile phase titanium dioxide nanoparticles.
Absorbance
3400 2400 1400
2.50
2.00
1.50
1.00
0.50
Wave length (cm ) 0.00
R-TiO NPs Raw TiO
2 2
400
-1
Fig. 2. Fourier transform infrared spectroscopy spectrum of rutile phase
TiO 2 . However, TiO 2 after calcination at 900℃ for 2 hours, re- vealed a simple broad band only at 400 to 1000 cm –1 , support- ing the phase transformation into the rutile phase.
4. Morpholoical feature, element analysis and crystallinity of rutile phase titanium dioxide nanoparticles
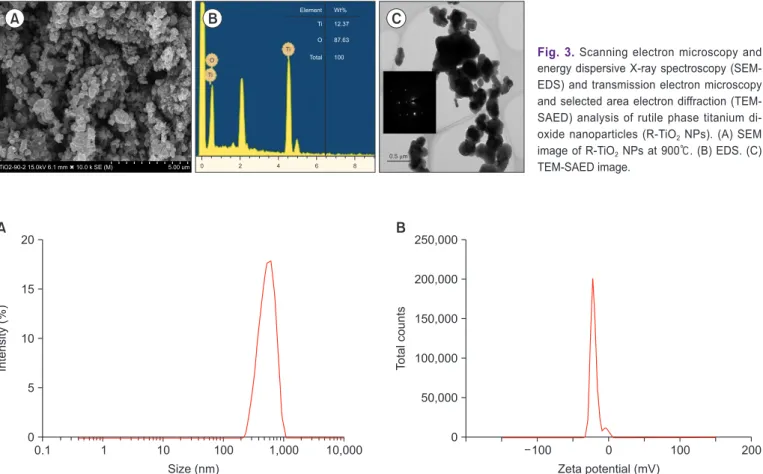
The shape of R-TiO 2 NPs was spherical as shown in SEM image (Fig. 3A). The elemental composition of R-TiO 2 NPs, which was analyzed by EDS, showed two characteristic peaks at 0.2 keV and 4.5 keV corresponding to Ti-O and Ti with the weight percent of Ti and O at 12.4 and 87.6%, respectively (Fig. 3B). In addition, the morphology and inset image in TEM- SAED showed partly nonhomogeneous agglomeration with single rutile crystalline of TiO 2 NPs (Fig. 3C).
5. Particle size and zeta potential rutile phase titanium dioxide nanoparticles
DLS and zeta potential was measured to estimate the nature
of hydrodynamic size and the suspension stability. The R-TiO 2 NPs formed a stable dispersion in aqueous suspension with no precipitation. The average hydrodynamic diameter was 550 nm (Fig. 4A) and the zeta potential at –20.8 mV with the conduc- tivity of 0.00816 mS/cm (Fig. 4B).
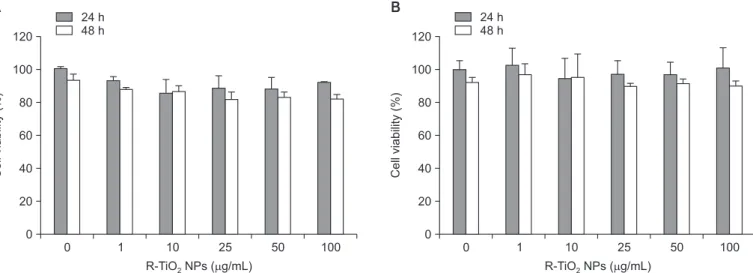
6. Cytotoxicity of rutile phase titanium dioxide nanoparticles
The cell morphology of FaDu and YD-15 cells, observed at 24 and 48 hours after treating with 100 µg/mL of R-TiO 2 NPs, showed no significant change (Fig. 5). Also cytotoxic effect of R-TiO 2 NPs on oral cancer cells was not found in an MTT assay which was carried out by treating FaDu and YD-15 cells with various concentrations of R-TiO 2 NPs. Both cell growth and proliferation were not affected by R-TiO 2 NPs (Fig. 6).
Discussion
In this study, we prepared and characterized R-TiO 2 NPs and evaluated its cytocompatibility on oral cancer cells. In the prep-
Intensity (%)
10,000
T otal counts
250,000
200,000
150,000
100,000
50,000
Zeta potential (mV) 0
100 0 100 200
A B
0.1 1 10 100 1,000
20
15
10
5
Size (nm) 0
Fig. 4. Dynamic light scattering analysis (A) and zeta potential (B) of rutile phase titanium dioxide nanoparticles (R-TiO 2 NPs).
TiO2-90-2 15.0kV 6.1 mm 10.0 k SE (M)
A B C
5.00 um 0 2 4 6 8
Element Wt%
Ti O Total
12.37 87.63 100 Ti
O Ti
0.5 m