Vol. 26, No. 11 (2016)
644
Fluctuation of Solid-Liquid Interface of Faceted Phase and Nonfaceted Phase by Periodic Temperature Variation
Sung-Tag Oh 1 , Young Do Kim 2 , Young-Jun Song 3 and Myung-Jin Suk 3†
1Department of Materials Science and Engineering, Seoul National University of Science and Technology, Seoul 01811, Republic of Korea
2Department of Materials Science and Engineering, Hanyang University, Seoul 04763, Republic of Korea
3Department of Materials and Metallurgical Engineering, Kangwon National University, Samcheok 25913, Republic of Korea
(Received August 29, 2016 : Revised October 18, 2016 : Accepted October 18, 2016)
Abstract
In order to examine how the solid-liquid interface responds to temperature variation depending on the materials characteristics, i.e. faceted phase or nonfaceted phase, the moving solid-liquid interface of transparent organic material, as a model substance for metallic materials (pivalic acid, camphene, salol, and camphor-50wt% naphthalene) was observed in-situ.Plots of the interface movement distance against time were obtained. The solid-liquid interface of the nonfaceted phase is atomically rough; it migrates in continuous mode, giving smooth curves of the distance-time plot. This is the case for pivalic acid and camphene. It was expected that the faceted phases would show different types of curves of the distance-time plot because of the atomically smooth solid-liquid interface. However, salol (faceted phase) shows a curve of the distance-time plot as smooth as that of the nonfaceted phases. This indicates that the solid-liquid interface of salol migrates as continuously as that of the nonfaceted phases. This is in contrast with the case of naphthalene, one of the faceted phases, for which the solid- liquid interface migrates in “stop and go” mode, giving a stepwise curve of the distance-time plot.
Key words
solidification, faceted phase, nonfaceted phase, solid-liquid interface, fluctuation.1. Introduction
When a specimen does not move in the temperature gradient field of Bridgeman-type unidirectional solidifi- cation apparatus and thermal equilibrium is established, the solid-liquid interface remains stationary. If the temperature of the system rises or falls, the thermal equilibrium being no more maintained, then the solid- liquid interface migrates toward solid or liquid; the solid melts or the liquid solidifies. How swiftly the solid-liquid interface moves when the thermal equilibrium is no longer preserved depends on the mobility of the inter- face. The interface mobility is different depending on the materials concerned. The materials are generally classified into two types according to the solidified morphologies;
faceted and nonfaceted. It is well known that the faceted phase has an atomically smooth solid-liquid interface and it grows by lateral growth mechanism for which the
formation of ledge is essential at the interface. On the other hand, the nonfaceted phase has an atomically rough interface, and its growth is continuous because the atoms jumping from the liquid can be accommodated at any site on the interface continuously. The atomically smooth interface has inherently low accommodation factor leading to low interfacial mobility, whereas the atomically rough interface gives high accommodation factor, being approximately unity, to result in high interfacial mobility.
Concerning the movement of the solid-liquid interface the faceted phase will be, therefore, much less sensitive to temperature variation than the nonfaceted phase. One of the authors has examined the oscillation of dendrite tip position during unidirectional solidification of some of the transparent organic materials, revealing the characteristic growth behavior of the faceted phase and nonfaceted phase.
1,2)In the present work, the solid-liquid interface kept stationary initially and after thermal equilibrium was
†
Corresponding author
E-Mail : [email protected] (M. J. Suk, Kangwon Nat'l Univ.)
© Materials Research Society of Korea, All rights reserved.
This is an Open-Access article distributed under the terms of the Creative Commons Attribution Non-Commercial License (http://creative-
commons.org/licenses/by-nc/3.0) which permits unrestricted non-commercial use, distribution, and reproduction in any medium, provided the
original work is properly cited.
attained the temperature of the system was changed to examine how the solid-liquid interface responds to the temperature variation depending on the materials charac- teristics, i.e. faceted or nonfaceted. Some of the transparent organic materials as a model substance for metallic materials were used for in situ observation of the moving solid-liquid interface. The materials used are pivalic acid, camphene, salol, and camphor-50wt% naphthalene, and the first two are known as nonfaceted materials,
3-5)the salol
6-8)and the primary naphthalene
9,10)in the camphor- 50wt% naphthalene being faceted ones.
2. Experimental Procedure
The transparent materials(Aldrich) except for camphene are used as received without any further purification. The purity of the materials are as follows; pivalic acid 99 %, salol 99 %, camphor 98 %, and naphthalene 99 %. As- received camphene has a purity of 95 %, and it was purified twice by vacuum sublimation method. The materials were melted in the nitrogen atmosphere in a glass chamber, and after melting the chamber was evacuated at around 10
3Pa by a diaphragm pump. The materials were then encapsulated in the rectangular shaped thin glass cells (4 × 0.2 × 300 mm
3) by nitrogen pressure in the evacuated glass chamber. The glass cells were put into the temperature gradient stage, which was mounted between the objective and the light source of the transmission optical microscope. The general procedure for the preparation of the glass cells and dealing with the transparent organic materials are described elsewhere.
9,11,12)Temperatures of the hot chamber and the cold chamber of the temperature gradient stage were controlled by circulating hot oil and coolant(anti-freeze solution) from the hot bath and cold bath, which were nominally set at 70
oC and 20
oC, respectively. The solid-liquid interface then existed between the chambers which are 12 mm apart from each other. The temperature of the hot chamber was periodically varied with a nominal amplitude of 5 K after homogenization of the specimen for 24 hours while the temperature of the cold chamber remaining constant.
The digital images of the solid-liquid interface from CCD camera were captured in a PC at every 20 seconds, and the position of the solid-liquid interface was traced by identifying the X-coordinate at a fixed Y-coordinate using image analyzing software. The exact position of the interface is dependent on the resolution of the captured image, and therefore the decision of the interface position involves some degree of subjectivity. However, the mea- surement was reproducible within 1 pixel (1.6 µm in the present optic system), and this uncertainty is much smaller than the measured amplitude of the interface fluctuation.
3. Results and Discussion
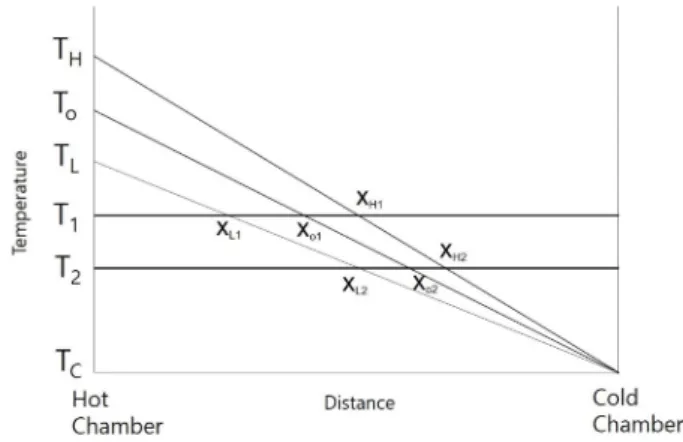
Fig. 1 shows a typical solid-liquid interface which moves either left or right depending on the temperature variation. Fig. 2 is a hypothetical schematic diagram showing the temperature profile between the hot chamber and the cold chamber of the temperature gradient stage.
Actual temperature profile will not be entirely linear, but partly curved near the hot chamber and the cold chamber.
Initially the temperature of the hot chamber was T
O, and the temperature was periodically varied between T
H(the highest temperature of the hot chamber) and T
L(the lowest temperature of the hot chamber), the period being 2,400s after the initial 1,200s elapsed. Temperature variation continued by 2.5 cycles, and T
Hand T
Lwere attained 3 times during the cycles. The solid-liquid interface moves towards the liquid or the solid while the Fig. 1. Micrograph showing typical solid-liquid interface(camphene) which fluctuates according to the temperature variation of hot chamber.
Fig. 2. Hypothetical schematic diagram for temperature profile bet-
ween the hot chamber and the cold chamber of the temperature
gradient stage. T
H, T
O, and T
Lare the temperatures of the hot
chamber, and T
Cis the temperature of the cold chamber. T
1and T
2are the melting temperatures of the materials.
temperature of the hot chamber is varied between T
Hand T
L. If a material has a melting temperature T
1, the position of the solid-liquid interface(the melting isotherm) would be X
O1when the temperature of the hot chamber is T
O. When the temperature of the hot chamber falls or rises to T
Land T
H, then the position of the interface is X
L1and X
H1, respectively. Here, we assume that the solute effect which affects the melting isotherm due to the solute accumulation in front of the interface during growth of solid is negligible for commercially pure substances (pivalic acid, camphene, and salol). If the melting temperature of the material is T
2which is lower than T
1, then the distance over which the solid-liquid interface traverses, X
L2-X
H2, is shorter than the distance, X
L1-X
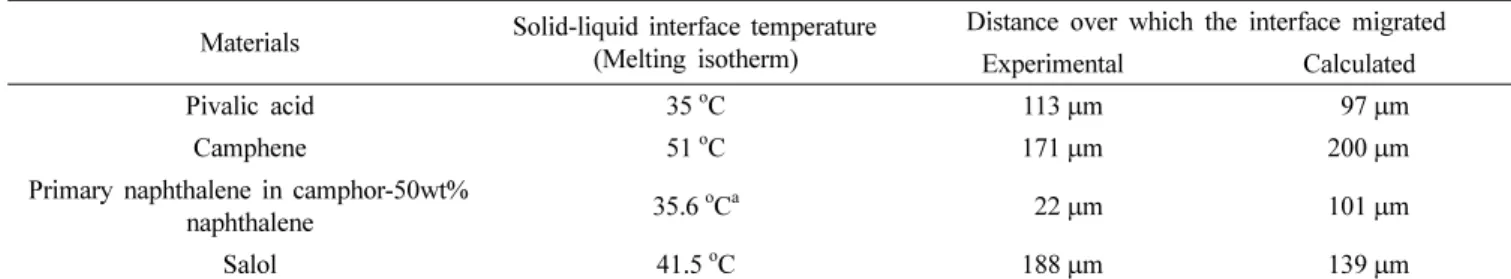
H1. Table 1 shows the measured distances over which the
solid-liquid interface migrated during temperature variation of the hot chamber for the materials used. The distances for the materials with lower melting point(pivalic acid, primary naphthalene) is shorter than those for the materials with higher melting point(camphene, salol).
With the assumption that the temperature of the cold chamber is 20
oC and the temperature profile is linear from the cold chamber to the hot chamber, and with the temperature gradient data as stated below, one can calculate the distances of the interface movement for the materials with various melting points. The calculated values are given in the last column in Table 1. The dis- crepancy between the experimental values and the calcu- lated ones is mainly attributed to the actual temperature profile that is not linear near both the cold chamber and Fig. 3. Plots of the interface movement distance against the time. (a) Pivalic acid, (b) Camphene, (c) Primary naphthalene in camphor- 50wt% naphthalene, (d) Salol.
Table 1. The measured distances over which the solid-liquid interface migrated during temperature variation of the hot chamber. Calculated values are also given.
Materials Solid-liquid interface temperature (Melting isotherm)
Distance over which the interface migrated
Experimental Calculated
Pivalic acid 35
oC 113 µm 97 µm
Camphene 51
oC 171 µm 200 µm
Primary naphthalene in camphor-50wt%
naphthalene 35.6
oC
a22 µm 101 µm
Salol 41.5
oC 188 µm 139 µm
a
Estimated from the position of the melting isotherm of the primary naphthalene layer ahead of the eutectic interface. According to phase
diagram
9)the liquidus temperature is estimated to be around 48
oC, but in general the temperature of the stationary solid-liquid interface under
the temperature gradient approaches to the solidus temperature, in this case eutectic temperature, 31.9
oC.
hot chamber. Partly it is due to that the temperature gradient values were obtained using dummy specimen.
They would not be always the same at every experimental runs. The bath temperature for the hot chamber was set at T
O70
oC, T
H72.5
oC, and T
L67.5
oC. The actual temperatures of the hot chamber measured were lower by around 4-5
oC than the set temperatures of the bath, depending on the ambient temperature. The temperature gradient at the solid-liquid interface was measured using K-type sheathed thermocouple (0.5 mm in diameter) to be 2.4 K/mm when the temperature of the hot chamber increased to T
H(72.5
oC), and 2.14 K/mm when it de- creased to T
L(67.5
oC).
Plots of the interface movement distance against the time are shown in Fig. 3. In these plots the periodic temperature variation of the hot chamber is also depicted.
Because the solid-liquid interface of the nonfaceted phase is atomically rough, it migrates by continuous mode, being smooth during solidification and melting. Therefore the curves of the distance-time plot of the nonfaceted phases(pivalic acid and camphene) should be smooth, as shown in Figs. 3a and 3b. However, the faceted phase has an atomically smooth solid-liquid interface, and its growth requires ledge on the interface. The solid-liquid interface then migrates by lateral growth of the ledges, resulting in a faceted morphology of the solid. In naph- thalene the ledges are known to be formed by 2- dimensional nucleation in the solidi-liquid interface.
1,10,13)The growth of the primary naphthalene involves repeated nucleation of the ledges, and is thus characterized by the repetition of alternating “stop and go”. This growth mode corresponds to alternating “fast growth” and “slow growth” observed during unidirectional solidification ex- periment.
1)The “stop and go” growth mode is reflected on Fig. 3c for the primary naphthalene in the camphor- 50wt% naphthalene, leading to the stepwise curve of the distance-time plot. Stepwise curve is more vivid in the magnified plot(Fig. 4a). Migration of the solid-liquid interface would show the stepwise feature during melting as well as growth. Detachment of atoms from the solid during melting is as difficult as attachment of atoms into solid during solidification in the atomically smooth inter- face. Once a cluster of atoms are detached from the atomically smooth interface, forming a pit, the further lateral detachment process will be facilitated.
On the other hand, salol, one of the faceted phases, shows a curve of the distance-time plot as smooth as that of the nonfaceted phases, and this is contrary to the case of naphthalene. Salol is known to have ledges formed by a screw dislocation intersecting the solid-liquid interface.
6,7)The addition of atoms to the ledge causes a spiral growth around the screw dislocation, and the ledges are self- propagating, never running out of the interface. This is
contrasted with the case of 2-dimensional nucleation of ledges where a certain degree of interface undercooling would be required and ledges do not always sufficiently exist. The growth of salol is thus continuous because of the ledges always existing during entire growth process, even though the morphology of the solid is faceted due to a limited growth direction. The magnified plot(Fig.
4b) shows a smoothness of the curve of the salol, contrasted with naphthalene(Fig. 4a).
The mobility of the interface is defined as the velocity
divided by the driving force.
14)In the present work, the
melting isotherms of the materials used are in the range
of 35
oC to 51
oC, the difference being negligible, and
hence the driving force for the migration of the interface
by the temperature variation of 5 K would be considered
the same. Therefore the migration distance at a given
interval(Table 1) will be a measure of the mobility of the
solid-liquid interface. With taking into consideration the
almost same melting isotherms of pivalic acid(35
oC) and
primary naphthalene(35.6
oC) in camphor-50wt% naph-
thalene and by comparing the migration distance of the
two materials one can see that the mobility of the solid-
Fig. 4. (a) and (b) are the magnified plots of Fig. 3(c) and (d),
respectively, by reducing the scale of distance axis(left Y-axis).
liquid interface for primary naphthalene is much poorer than pivalic acid.
Conclusively, the mobility of the solid-liquid interface is good for pivalic acid, camphene, and salol, whereas it is poor for primary naphthalene in camphor-50wt%
naphthalene.
The distance-time plot in all cases shows a serrated curve exclusively near the highest temperature. It is due to the crude temperature control at the highest turning point, and this has always occurred in the present experiment.
With regard to the distance over which the interface migrated, the primary naphthalene shows much smaller value than the other materials. This is related with the sluggish motion of the solid-liquid interface. The interface will have not sufficient time to effectively arrive at the position otherwise it would have arrived.
As back-and-forth migration of the interface proceeded, the position of the interface was gradually shifted into the solid side from the initial position. (The maximum and the minimum in the distance curve of Fig. 3c rise with the cycle proceeding.) It is due to the solute accumulation in front of the solid-liquid interface during growth. The solute enriched layer causes the drop of the melting point which in turn brings about the shift of the melting isotherm into solid side.
4. Conclusions
The mobility of the solid-liquid interface is good for pivalic acid, camphene and salol, whereas it is poor for primary naphthalene in camphor-50wt% naphthalene.
Salol, one of the faceted phases, shows a curve of the distance-time plot as smooth as that of the nonfaceted phases, implying that its solid-liquid interface responses to the temperature variation as swiftly as the nonfaceted phases. The growth of salol is continuous, because the ledges are formed by screw dislocation mechanism and thus always exist during entire growth process, even though the morphology of the solid is faceted due to a limited growth direction. This is contrary to the case of naphthalene which is also one of the faceted phases. The primary naphthalene in the camphor-50wt% naphthalene will have a low accommodation factor due to the limited formation of ledges formed by 2-dimensional nucleation mechanism, and this results in stepwise and sluggish
response of the solid-liquid interface to the temperature variation. This feature holds true for the melting process as well as for the growth process.
Acknowledgement
This work was supported by the National Research Foundation of Korea(NRF) grant funded by the Korea government(MSIP) (No. 2012R1A2A2A02046179) and 2015 research grant from Kangwon National University (No. 201510031). The authors acknowledge the assistant of Mr. S. H. Joo, Mr. H. S. Lee and Ms. G. H. Lee during experimental work.
References
1. M. J. Suk and S. Liu, Met. Mater. Int., 15, 379 (2009).
2. M. J. Suk and K. Leonartz, J. Cryst. Growth, 208, 809 (2000).
3. C. Giummarra, J. C. LaComb, M. B. Koss, J. E. Frei, A.
O. Luplescu and M. E. Glicksman, J. Cryst. Growth, 274, 317 (2005).
4. M. J. Suk, Y. M. Park, S. T. Oh and S. Y. Chang, Korean J. Met. Mater., 49, 570 (2011).
5. E. R. Rubinstein and M. E. Glicksman, J. Cryst. Growth, 112, 97 (1991).
6. N. Dey and J. A. Sekhar, Acta Metall. Mater., 41, 409 (1993).
7. N. Dey and J. A. Sekhar, Microstructural Design by Solidification Processing, eds. E. J. Lavernia and M. N.
Gungor, p. 1, TMS, Warrendale (1992).
8. D. Shangguan and J. D. Hunt, Metall. Trans., 22A, 941 (1991).
9. M. J. Suk and K. Leonartz, J. Cryst. Growth, 213, 141 (2000).
10. L. M. Fabietti and R. Trivedi, Metall. Trans., 22A, 249 (1991).
11. M. J. Suk, Y. M. Park and Y. D. Kim, Scripta Mater., 57, 985 (2007).
12. S. Liu, M. J. Suk, L. Fabietti and R. Trivedi, Solidification Process and Microstructure: A Symposium in Honor of Wilfried Kurz, eds. M. Rappaz, C. Beckermann and R.
Trivedi, p. 211, TMS, Warrendale (2004).
13. L. M. Fabietti, Metall. Mater. Trans. A, 33, 2678 (2000).
14. J. W. Christian, The Theory of Transformations in Metals and Alloys (Vol. 1-2), p. 480, Pergamon, Oxford (2002).