Introduction
Appropriate gestational weight gain (GWG) is an important indicator of maternal and fetal well-being during pregnancy [1]. Excessive maternal weight gain leads to gestational hy- pertensive disorders and diabetes, increased risk of cesarean section, large for gestational age (LGA) infants, and higher postpartum weight retention, while inadequate weight gain could be the cause of preterm birth and infants who are small for gestational age (SGA) [2-5]. To highlight and
Gestational weight gain in twin pregnancies in
Korea: application of the 2009 Institute of Medicine recommendations
Bo Young Choi, MD
1, Subeen Hong, MD
2, Minhee Jeon, MS
3, Jee Yoon Park, MD
1, Kyung Joon Oh, MD, PhD
1, Joon-Seok Hong, MD, PhD
1Department of Obstetrics and Gynecology, 1Seoul National University Bundang Hospital, Seoul National University College of Medicine, Seongnam,
2College of Medicine, The Catholic University of Korea, Seoul; 3Department of Statistics, Medical Research Collaborating Center, Seoul National University Bundang Hospital, Seoul National University College of Medicine, Seongnam, Korea
Objective
To investigate the effect of gestational weight gain (GWG) on maternal and neonatal outcomes based on the Institute of Medicine (IOM) guidelines for twin pregnancies.
Methods
This study included women with twin pregnancies who delivered at Seoul National University Bundang Hospital.
Based on the weight gain per gestational week according to the 2009 IOM guidelines, the subjects were divided into the following 3 groups: inadequate, adequate, and excessive GWG. We compared the maternal and neonatal outcomes of each group.
Results
A total of 1,738 twin pregnancies were included in our study. Of these cases, 881, 694, and 163 (50.7%, 39.9%, and 9.4%, respectively) twin pregnancies were categorized into the inadequate, adequate, and excessive GWG groups, respectively. In the inadequate GWG group, the risks of preterm birth <34 weeks (aOR, 2.33, 95% confidence interval [CI], 1.63–3.34) and delivering neonates who were small for gestational age (aOR, 1.92, 95% CI, 1.42–2.60) were increased, and the risk of preeclampsia (aOR, 0.49, 95% CI, 0.32–0.76) was decreased. The excessive GWG group had an increased risk of the neonates being large for gestational age (aOR, 1.79, 95% CI, 1.15–2.81).
Conclusion
The 2009 IOM recommendations for GWG can be applied to Korean women with twin pregnancies to help achieve optimal maternal and neonatal outcomes. However, more than half of the women were categorized as having inadequate weight gain according to the guidelines. Further studies should be performed to obtain Korean national references for GWG in twin pregnancies.
Keywords: Gestational weight gain; Twin pregnancy; Institute of Medicine; Pregnancy outcome
Received: 2020.05.21. Revised: 2020.08.18. Accepted: 2020.09.08.
Corresponding author: Subeen Hong, MD
Department of Obstetrics and Gynecology, College of Medicine, The Catholic University of Korea, 222 Banpo-daero, Seocho-gu, Seoul 06591, Korea
E-mail: [email protected]
https://orcid.org/0000-0002-1027-7981
Articles published in Obstet Gynecol Sci are open-access, distributed under the terms of the Creative Commons Attribution Non-Commercial License (http://creativecommons.
org/licenses/by-nc/3.0/) which permits unrestricted non-commercial use, distribution, and reproduction in any medium, provided the original work is properly cited.
Copyright © 2020 Korean Society of Obstetrics and Gynecology https://doi.org/10.5468/ogs.20133
pISSN 2287-8572 · eISSN 2287-8580
suggest adequate weight gain goals during pregnancy, rec- ommendations for GWG were published by the Institute of Medicine (IOM), now renamed the National Academy of Medicine, in 1990 [6]. According to the guidelines, a total GWG of 11.5–16 kg is considered adequate for women of normal weight with singleton pregnancies. Many studies have revealed that weight gain outside of these guidelines in singleton pregnancies is associated with adverse pregnancy outcomes [7].
The IOM committee also provided a recommendation for adequate GWG in twin pregnancies [6]. However, it is dif- ficult to directly apply these guidelines to Korean women for the following reasons. First, the guidelines published by the IOM are solely based on the data of American women [8].
Since GWG may be influenced by various factors, which may be social, environmental, or genetic, the values for appropri- ate GWG are different for each ethnic group [9-13]. Second, the World Health Organization (WHO) has set the cutoff for the overweight body mass index (BMI) category at 23 for the Asian population, which is different from Western standards [14]. Third, there is a lack of research addressing whether it is appropriate to apply these guidelines to Korean women with twin pregnancies.
To address these issues, the purpose of this study is to in- vestigate the effect of GWG on maternal and neonatal out- comes based on the IOM guidelines for Korean women with twin pregnancies and to determine whether these guidelines can be applied to this group of women.
Materials and methods
1. Study population and study design
This retrospective study included women with twin pregnan- cies who delivered at Seoul National University Bundang Hospital between January 2005 and June 2019. Among them, cases with circumstances that may have affected the GWG, such as single fetal demise, delivery before 24 weeks of gestation, delayed interval delivery, major fetal anomalies, and cases with an unknown pre-pregnancy BMI and GWG;
and cases with twin-specific complications, such as severely weight discordant twins (>30%), twin-to-twin transfusion syndrome (TTTS), and monochorionic monoamniotic (MCMA) twins, were excluded from the analysis. Based on the weight gain per gestational week according to the 2009 IOM guide-
lines, the cases were divided into the following 3 groups:
inadequate, adequate, and excessive GWG. We compared the maternal and neonatal outcomes of each group and calculated the adjusted odds ratios (aORs) for each outcome, which were then compared to the reference group (adequate GWG group) by multiple logistic regression analysis after ad- justing for confounding factors.
2. Setting of the inadequate, adequate, and excessive gestational weight gain groups
The rate of weight gain (kg/week) in each mother was cal- culated by dividing the total gestational weight by the ges- tational age at delivery in weeks. According to the method proposed by Fox et al. [15,16], an adequate GWG per ges- tational week was defined as the value obtained by dividing the IOM recommended weight gain by 37 weeks. The value was dependent on the pre-pregnancy BMI group, as speci- fied in Supplementary Table 1. For example, if a woman who delivered at 38 weeks had a 30 kg weight increase in pregnancy, her rate of weight gain would be 30 kg/38 weeks (i.e., 0.789 kg/week). If the mother’s pre-pregnancy BMI was within the normal range, adequate GWG would be 0.454–
0.662 kg/week. If the calculated value was greater than 0.662 kg/week, the mother would be classified into the ex- cessive GWG group.
3. Clinical factors, maternal outcomes, and neonatal outcomes
The baseline characteristics in each pregnancy including the maternal age, height, pre-pregnancy weight, parity, chorion- icity, and presence of preexisting such as hypertension (HTN) and diabetes mellitus (DM) were evaluated at the initial pre- natal visit. Because it is common to visit the outpatient clinic after the first trimester, we asked the mothers for their pre- pregnancy weight and recorded it. The pre-pregnancy BMI was calculated as the maternal pre-pregnancy weight (kg)/
height (m2). We used the BMI classification for an Asian pop- ulation according to the WHO [14]. The categories of under- weight, normal weight, overweight, and obese were defined as BMI <18.5 kg/m2, 18.5–23 kg/m2, 23–25 kg/m2,and ≥25 kg/m2, respectively.
When the mother was hospitalized for delivery, the pre- delivery weight was measured. The total gestational weight was calculated by subtracting the self-reported pre-pregnan- cy weight from the pre-delivery weight. Each case’s medical
charts were reviewed to obtain the delivery method and complications during pregnancy, including preterm labor, preterm premature rupture of membranes (PPROM), HTN, preeclampsia (PE), and gestational DM (GDM). HTN during pregnancy included gestational HTN, PE, eclampsia, and su- perimposed PE. The mode of delivery for women with twin pregnancies was decided after consulting with the mothers.
Essentially, if both fetuses had vertex presentations, vagi- nal deliveries could be attempted. The neonatal outcomes included the birth weight, whether the infant was SGA or LGA, neonatal intensive care unit (NICU) admission, and low Apgar scores (Apgar score <7 at 1 minute or 5 minutes). We defined SGA as a weight lower than the 10th percentile for the gestational age and LGA as a weight greater than the 90th percentile for the gestational age, based on the Korean twin growth curves [17].
4. Statistical analysis
Continuous data are presented as mean±standard deviation, and categorical data are presented as number (%). To com- pare the 3 groups, analysis of variance was used for continu-
ous variables and the χ2 test or Fisher’s exact test was used for categorical variables. Using the adequate GWG group as the reference group for comparison, the unadjusted OR and aOR for each maternal outcome in the inadequate and excessive GWG groups were calculated using univariate and multivariate logistic regression analysis, respectively. For the analysis of the neonatal outcomes, a generalized estimating equation (GEE) was used to adjust for the familial correlation between twins from a single mother. The Firth correction was used to calculate the aOR for rare-event data [18]. A P-value of <0.05 was considered statistically significant. IBM SPSS Statistics version 23.0 software (IBM Inc., Armonk, NY, USA) and SAS version 9.4 (SAS Institute, Cary, NC, USA) were used for the analyses.
Results
A total of 2,088 women with twin pregnancies gave birth at Seoul National University Bundang Hospital between 2005 and 2019. Among these women, 350 women (45 with a
Fig. 1. Study flow chart and population. GA, gestational age; BMI, body mass index; GWG, gestational weight gain; MCMA, monochori- onic monoamniotic twin; TTTS, twin-to-twin transfusion syndrome.
2,088 twins deliveries between 2005-2019
1,738 twins deliveries included for analysis
Inadequate GWG n=881 (50.7%) Underweight
Normal Overweight Obese
120 628 80 53
(13.6%) (71.3%) (9.1%) (4.0%)
Adequate GWG n=694 (39.9%) Underweight
Normal Overweight Obese
90 439 96 69
(13.0%) (63.3%) (13.8%) (9.9%)
Excessive GWG n=163 (9.4%) Underweight
Normal Overweight Obese
120 628 80 53
(13.6%) (71.3%) (9.1%) 4.0%) 350 excluded
Single fetal demised, n=45 Delivery before GA 24 weeks, n=33 Delayed interval delivery, n=5 Major fetal anomaly, n=8 Unknown BMI, n=106 Unknown GWG, n=9
Twin specific complications, n=144 - MCMA, TTTS, severe discordant twin
single fetal demise, 33 who delivered before 24 weeks of gestation, 5 with delayed interval delivery, 8 with major fe- tal anomalies, 106 without pre-pregnancy BMI data, 9 who could not calculate their GWG, 123 with severely discordant twins, 21 with TTTS, and 2 with MCMA twins) were exclud- ed from the final analysis. Of the 1,738 patients who met the inclusion criteria, 881, 694, and 163 (50.7%, 39.9%, and
9.4%, respectively) were categorized into the inadequate, adequate, and excessive GWG groups, respectively. The dis- tribution of the GWG for each BMI category is detailed in Fig. 1.
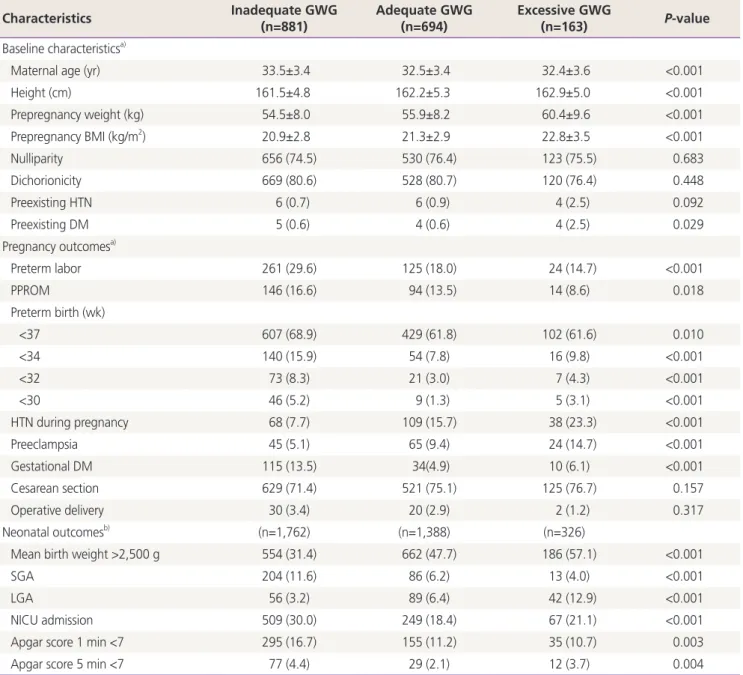
Table 1 presents the demographic characteristics, and ma- ternal and neonatal outcomes for each group. The maternal age, height, pre-pregnancy weight, and BMI were different
Table 1. The baseline characteristics, pregnancy and neonatal outcomes according to the gestational weight gain (GWG) groups
Characteristics Inadequate GWG
(n=881)
Adequate GWG (n=694)
Excessive GWG
(n=163) P-value
Baseline characteristicsa)
Maternal age (yr) 33.5±3.4 32.5±3.4 32.4±3.6 <0.001
Height (cm) 161.5±4.8 162.2±5.3 162.9±5.0 <0.001
Prepregnancy weight (kg) 54.5±8.0 55.9±8.2 60.4±9.6 <0.001
Prepregnancy BMI (kg/m2) 20.9±2.8 21.3±2.9 22.8±3.5 <0.001
Nulliparity 656 (74.5) 530 (76.4) 123 (75.5) 0.683
Dichorionicity 669 (80.6) 528 (80.7) 120 (76.4) 0.448
Preexisting HTN 6 (0.7) 6 (0.9) 4 (2.5) 0.092
Preexisting DM 5 (0.6) 4 (0.6) 4 (2.5) 0.029
Pregnancy outcomesa)
Preterm labor 261 (29.6) 125 (18.0) 24 (14.7) <0.001
PPROM 146 (16.6) 94 (13.5) 14 (8.6) 0.018
Preterm birth (wk)
<37 607 (68.9) 429 (61.8) 102 (61.6) 0.010
<34 140 (15.9) 54 (7.8) 16 (9.8) <0.001
<32 73 (8.3) 21 (3.0) 7 (4.3) <0.001
<30 46 (5.2) 9 (1.3) 5 (3.1) <0.001
HTN during pregnancy 68 (7.7) 109 (15.7) 38 (23.3) <0.001
Preeclampsia 45 (5.1) 65 (9.4) 24 (14.7) <0.001
Gestational DM 115 (13.5) 34(4.9) 10 (6.1) <0.001
Cesarean section 629 (71.4) 521 (75.1) 125 (76.7) 0.157
Operative delivery 30 (3.4) 20 (2.9) 2 (1.2) 0.317
Neonatal outcomesb) (n=1,762) (n=1,388) (n=326)
Mean birth weight >2,500 g 554 (31.4) 662 (47.7) 186 (57.1) <0.001
SGA 204 (11.6) 86 (6.2) 13 (4.0) <0.001
LGA 56 (3.2) 89 (6.4) 42 (12.9) <0.001
NICU admission 509 (30.0) 249 (18.4) 67 (21.1) <0.001
Apgar score 1 min <7 295 (16.7) 155 (11.2) 35 (10.7) 0.003
Apgar score 5 min <7 77 (4.4) 29 (2.1) 12 (3.7) 0.004
Data are presented as mean±standard deviation or number (%) for variables, unless otherwise indicated.
BMI, body mass index; HTN, hypertension; DM, diabetes mellitus; PPROM, preterm premature rupture of membranes; SGA, small for gesta- tional age; LGA, large for gestational age; NICU, neonatal intensive care unit.
a)P-value from analysis of variance, χ2 test or Fisher’s exact test; b)P-value from generalized estimating equation.
between the 3 groups. The maternal age was highest in the inadequate GWG group; and the height, pre-pregnancy weight, and BMI were highest in the excessive GWG group (P<0.001). The excessive GWG group had a higher preva- lence of preexisting DM than the other 2 groups (P=0.029).
There were no significant differences in the prevalence of nulliparity, dichorionicity, and preexisting HTN between the 3 groups.
There were significantly higher incidences of preterm labor, PPROM, preterm birth, and GDM in the inadequate GWG group than in the other 2 groups (all P<0.001 except for PPROM [P=0.018]). However, the prevalences of HTN during pregnancy and PE were highest in the excessive GWG group (all P<0.001). The mode of birth differed slightly between the 3 groups; for example, cesarean section was more prevalent in the excessive GWG group and operative deliveries were more common in the inadequate GWG group; however, the results were statistically insignificant.
Regarding neonatal outcomes, the incidences of infants who were SGA, required NICU admission, or had Apgar scores <7 at 1 minute and 5 minutes were highest in the in- adequate GWG group; the proportions of infants who had a mean birth weight >2,500 g and were LGA were highest in the excessive GWG group (all P<0.001 except Apgar scores
<7 at 1 minute [P=0.003] and 5 minutes [P=0.004]). The adequate GWG group showed the lowest NICU admission
rate (18.4% vs. 30.0% in the inadequate GWG group and 21.1% in the excessive GWG group).
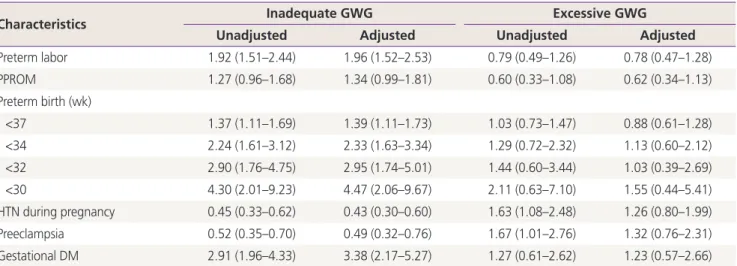
We performed multivariate logistic regression analysis us- ing variables that showed significant differences between the 3 groups. The results of the maternal and neonatal out- comes are summarized in Tables 2 and 3, respectively. The patients in the inadequate GWG group were more likely to have preterm labor (aOR, 1.96, 95% confidence interval [CI], 1.52–2.53), preterm birth (<37 weeks, aOR, 1.39, 95%
CI, 1.11–1.73; <34 weeks, aOR, 2.33, 95% CI, 1.63–3.34;
<32 weeks, aOR, 2.95, 95% CI, 1.74–5.01; and <30 weeks, aOR, 4.47, 95% CI, 2.06–9.67), and GDM (aOR, 3.38, 95%
CI, 2.17–5.27), even after adjusting for all confounders. In contrast, the likelihoods of developing HTN during preg- nancy and PE (aOR, 0.43 and 0.49, 95% CI, 0.30–0.60 and 0.32–0.76, respectively) were lower in the inadequate GWG group. There were no significant associations between each maternal outcome and excessive GWG (Table 2).
The neonates of mothers in the inadequate GWG group were more likely to be SGA and require admission to the NICU (aOR, 1.92 and 1.44, 95% CI, 1.42–2.60 and 1.01–
1.95, respectively). Twins of mothers with excessive GWG tended to be LGA (aOR, 1.79, 95% CI, 1.15–2.81). The odds of lower Apgar scores were higher in the inadequate GWG group; however, they were not significant after considering other confounders (Table 3).
Table 2. The risks for the maternal outcomes in the inadequate and excessive gestational weight gain (GWG) groups compared to the adequate GWG group (reference group)
Characteristics Inadequate GWG Excessive GWG
Unadjusted Adjusted Unadjusted Adjusted
Preterm labor 1.92 (1.51–2.44) 1.96 (1.52–2.53) 0.79 (0.49–1.26) 0.78 (0.47–1.28)
PPROM 1.27 (0.96–1.68) 1.34 (0.99–1.81) 0.60 (0.33–1.08) 0.62 (0.34–1.13)
Preterm birth (wk)
<37 1.37 (1.11–1.69) 1.39 (1.11–1.73) 1.03 (0.73–1.47) 0.88 (0.61–1.28)
<34 2.24 (1.61–3.12) 2.33 (1.63–3.34) 1.29 (0.72–2.32) 1.13 (0.60–2.12)
<32 2.90 (1.76–4.75) 2.95 (1.74–5.01) 1.44 (0.60–3.44) 1.03 (0.39–2.69)
<30 4.30 (2.01–9.23) 4.47 (2.06–9.67) 2.11 (0.63–7.10) 1.55 (0.44–5.41)
HTN during pregnancy 0.45 (0.33–0.62) 0.43 (0.30–0.60) 1.63 (1.08–2.48) 1.26 (0.80–1.99)
Preeclampsia 0.52 (0.35–0.70) 0.49 (0.32–0.76) 1.67 (1.01–2.76) 1.32 (0.76–2.31)
Gestational DM 2.91 (1.96–4.33) 3.38 (2.17–5.27) 1.27 (0.61–2.62) 1.23 (0.57–2.66)
Data are presented as odds ratio (95% confidence interval), calculated using univariate and multivariate logistic regression analysis. Adjusted for age, nulliparity, prepregnancy body mass index, preexisting HTN, preexisting DM, and dichorionicity.
PPROM, preterm premature rupture of membranes; HTN, hypertension; DM, diabetes mellitus.
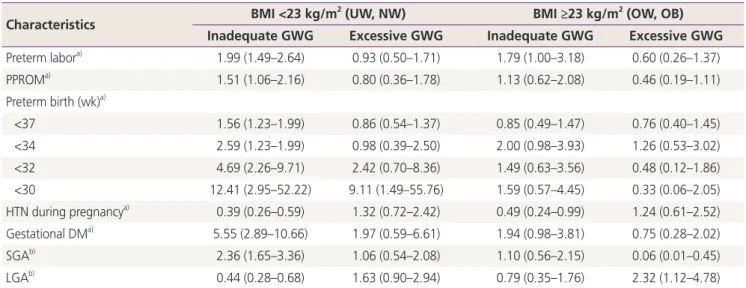
Table 4 presents the aORs for the major maternal and neo- natal outcomes according to the BMI and GWG categories.
The risks of major outcomes in women who had inadequate GWG and BMIs under 23 kg/m2 were similar to those in the total population. In women with BMIs over 23 kg/m2, only preterm labor and HTN during pregnancy were associated with inadequate GWG. In particular, there was a higher risk of preterm birth before 30 weeks in women with both ex-
cessive GWG and BMIs under 23 kg/m2 (aOR, 9.11, 95% CI, 1.49–55.76), which was different from the original results showing no association between preterm birth and excessive GWG. Women with excessive GWG and BMIs over 23 kg/m2 showed an increased risk of the infants being LGA and a de- creased risk of the infants being of SGA.
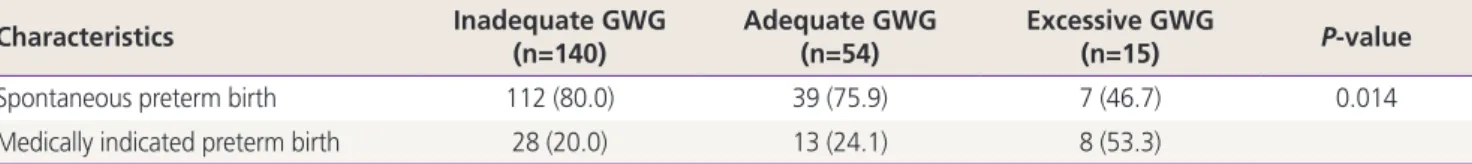
Sub-group analysis was conducted to evaluate the etiolo- gies of preterm birth according to the GWG groups of the
Table 3. The risks for the neonatal outcomes in the inadequate and excessive gestational weight gain (GWG) groups compared to the adequate GWG group (reference group)
Characteristics Inadequate GWG Excessive GWG
Unadjusted Adjusted Unadjusted Adjusted
Mean birth weight >2,500 g 0.50 (0.41–0.62) 0.56 (0.43–0.72) 1.46 (1.03–2.06) 1.94 (1.22–3.07)
SGA 1.99 (1.50–2.63) 1.92 (1.42–2.60) 0.63 (0.35–1.14) 0.54 (0.29–1.03)
LGA 0.48 (0.34–0.69) 0.51 (0.35–0.74) 2.16 (1.41–3.30) 1.79 (1.15–2.81)
NICU 1.90 (1.52–2.39) 1.44 (1.01–1.95) 1.19 (0.80–1.77) 1.02 (0.64–1.63)
Apgar score 1 min <7 1.60 (1.25–2.05) 1.12 (0.84–1.48) 0.96 (0.60–1.54) 0.65 (0.38–1.13) Apgar score 5 min <7 2.14 (1.32–3.48) 1.52 (0.88–2.62) 1.79 (0.82–3.90) 1.47 (0.66–3.24) Data are presented as odds ratio (95% confidence interval), calculated using a generalized estimating equation. Adjusted for age, nulliparity, pre-pregnancy body mass index, gestational age at birth, preeclampsia, gestational diabetes mellitus, dichorionicity, and fetal sex.
SGA, small for gestational age; LGA, large for gestational age; NICU, neonatal intensive care unit.
Table 4. The risks for the maternal and neonatal outcomes in the inadequate and excessive gestational weight gain (GWG) groups com- pared to the adequate GWG group (reference group): subgroup analysis according to the body mass index (BMI) categorization (cut-off:
23 kg/m2)
Characteristics BMI <23 kg/m2 (UW, NW) BMI ≥23 kg/m2 (OW, OB) Inadequate GWG Excessive GWG Inadequate GWG Excessive GWG
Preterm labora) 1.99 (1.49–2.64) 0.93 (0.50–1.71) 1.79 (1.00–3.18) 0.60 (0.26–1.37)
PPROMa) 1.51 (1.06–2.16) 0.80 (0.36–1.78) 1.13 (0.62–2.08) 0.46 (0.19–1.11)
Preterm birth (wk)a)
<37 1.56 (1.23–1.99) 0.86 (0.54–1.37) 0.85 (0.49–1.47) 0.76 (0.40–1.45)
<34 2.59 (1.23–1.99) 0.98 (0.39–2.50) 2.00 (0.98–3.93) 1.26 (0.53–3.02)
<32 4.69 (2.26–9.71) 2.42 (0.70–8.36) 1.49 (0.63–3.56) 0.48 (0.12–1.86)
<30 12.41 (2.95–52.22) 9.11 (1.49–55.76) 1.59 (0.57–4.45) 0.33 (0.06–2.05)
HTN during pregnancya) 0.39 (0.26–0.59) 1.32 (0.72–2.42) 0.49 (0.24–0.99) 1.24 (0.61–2.52) Gestational DMa) 5.55 (2.89–10.66) 1.97 (0.59–6.61) 1.94 (0.98–3.81) 0.75 (0.28–2.02)
SGAb) 2.36 (1.65–3.36) 1.06 (0.54–2.08) 1.10 (0.56–2.15) 0.06 (0.01–0.45)
LGAb) 0.44 (0.28–0.68) 1.63 (0.90–2.94) 0.79 (0.35–1.76) 2.32 (1.12–4.78)
UW, underweight; NW, normal weight; OW, overweight; OB, obese; PPROM, preterm premature rupture of membranes; HTN, hypertension;
DM, diabetes mellitus; SGA, small for gestational age; LGA, large for gestational age.
a)Data are presented as odds ratio (95% confidence interval), calculated using univariate and multivariate logistic regression analysis. Adjusted for age, nulliparity, pre-pregnancy BMI, preexisting HTN, preexisting DM, and dichorionicity; b)Data are presented as odds ratio (95% confi- dence interval), calculated using a generalized estimating equation. Adjusted for age, nulliparity, pre-pregnancy BMI, gestational age at birth, preeclampsia, gestational DM, dichorionicity, and fetal sex.
women who gave birth before 34 weeks (Table 5). According to the GWG groups, the frequency of spontaneous preterm birth (due to preterm labor or PPROM) showed a linear as- sociation, which was the highest in the inadequate GWG group (80% vs. 75.9% vs. 46.7% for inadequate vs. ad- equate vs. excessive GWG, P<0.05).
Discussion
According to the results of this study, in terms of the mater- nal outcomes, women with inadequate GWG had a higher risk of preterm birth and preterm labor, and a lower risk of HTN during pregnancy, including PE, than women with ad- equate GWG.
Preterm birth is the most important obstetric outcome.
Many previous studies have investigated this subject and have found an association between GWG and preterm birth [15,19-22]. However, the results are conflicting. A strong association between GWG and preterm birth was first dem- onstrated by Fox et al. [15]. According to their study, women with inadequate GWG had an incidence of preterm birth that was 3 times higher than women with normal weight gain. Subsequent studies have also shown an increased risk of preterm birth in women with low GWG [15,19,23]. How- ever, some studies have reported that there is no association between GWG and preterm birth [20,21]. These conflicting results might have stemmed from differences in the research populations and methods. In our study, most of the study population comprised Korean women who had delivered in the past 14 years. Such a large monoethnic population can provide more accurate results about the relationship between GWG and preterm birth in modern Korean mothers with twin pregnancies. According to our results, after subgroup analysis according to the BMI categorization, the risk of pre- term birth was increased in women with inadequate GW, in those who had normal weights (BMI under 23 kg/m2), and
in those with excessive GWG. These results were consistent with those in large studies conducted for singleton pregnan- cies in Korea and China [12,24]. Taken together, both inad- equate and excessive GWG might be risk factors for preterm birth.
According to the subgroup analysis of women with pre- term births, the rate of spontaneous preterm birth (preterm labor and PPROM) was increased, but that of medically indicated preterm birth (HTN, SGA, etc.) was decreased in the inadequate GWG group. In addition, the etiologies of preterm birth showed a linear association according to the GWG group. Fox et al. [15] and Kosinska-Kaczynska et al.
[21] reported similar results to those in our study. Based on these results, the increase in preterm birth in women with inadequate GWG was attributed more to preterm labor than to SGA.
Many studies have reported that excess GWG can increase the risk of GDM [25-27]. However, our study showed that the proportion of women with GDM was higher in the in- adequate GWG group. Women who were diagnosed with GDM tended to control their weight more than others; thus, women with GDM were likely to have been assigned to the inadequate GWG group. Similar findings were reported by Lee et al. [28]. As lower GWG is a crucial factor for optimal outcomes in mothers with GDM [29,30], these women strive to reduce their GWG. According to a study by Katon et al.
[31], women with GDM gained weight at an average of 9.1 kg before being diagnosed with GDM, but after diagno- sis the average weight gain was 2.02 kg. These findings sup- port our results. However, we have considered that further analysis and investigations are required to evaluate these contradictory results.
Regarding the neonatal outcomes, when compared to the normal reference population, neonates who were born to women with inadequate GWG had a higher risk of being SGA, and those born to women with excessive GWG had a higher risk of being LGA. Previous studies have already
Table 5. Etiologies of preterm birth <34 weeks of gestation according to the gestational weight gain (GWG) group
Characteristics Inadequate GWG
(n=140)
Adequate GWG (n=54)
Excessive GWG
(n=15) P-value
Spontaneous preterm birth 112 (80.0) 39 (75.9) 7 (46.7) 0.014
Medically indicated preterm birth 28 (20.0) 13 (24.1) 8 (53.3)
Data are presented as number (%) for variable. The P-value from χ2 test was used for the trend.
reported an association between inadequate GWG and neo- nates who are SGA, and excessive GWG and neonates who are LGA [32-35]. Li et al. [32] analyzed the data from 33,973 pregnancies in the Chinese population and reported that the aORs for LGA infants with excessive GWG and SGA infants with inadequate GWG were 2.32 and 1.41, respectively (95%
CI, 2.12–2.53 and 1.26–1.57, respectively). Another study of 1,482 twins indicated that the inadequate GWG group had a higher risk of being SGA (aOR, 1.44; 95% CI, 1.01–2.06) [35]. Our results were consistent with previous study find- ings. These findings are meaningful for Korean women with twin pregnancies as they indicate that the IOM guidelines may be used appropriately for counseling about the weight of newborn babies.
There are several risk factors for adverse maternal and infant outcomes. Some of these risk factors, such as GWG, are modifiable, meaning they can be changed to help reduce risk. Several studies reported that having a weight gain goal played an important part in gaining an appropriate amount of gestational weight. Therefore, physicians should suggest lifestyle interventions to patients for optimal GWG.
To our knowledge, this study included the largest study population in a recent period to evaluate whether the IOM guidelines can be applied to Korean women with twin pregnancies. In addition, our study provided reliable results through multivariate analysis of factors such as maternal outcomes through binary logistic regression and neonatal outcomes by the GEE. Although the gestational age at birth, chorionicity, and fetal sex are important variables that can lead to adverse outcomes, many previous studies did not cor- rect for them [34,36-39]. In addition, GEE analysis, which is a method used to adjust for the correlation between twins, was not performed in previous studies despite its necessity [22,34,36,39].
However, there are some limitations to this study. Due to the retrospective nature of our study, we calculated GWG/
week using the methods proposed by Fox et al. [15]. It is a simple method, but it cannot provide the exact GWG/week because the increase in the rate of weight gain in the 1st trimester is different from that in 2nd and 3rd trimesters [40].
Therefore, it is necessary to identify the relationship between weight gain and outcomes by separating the weight gain in the 1st trimester from that after the 2nd trimester. When we addressed weight gain issues, we did not consider caloric excess and fluid overload. To do this, the maternal diet and
amount of generalized edema need to be assessed, but data on these factors could not be obtained due to the retrospec- tive nature of the study. In addition, there were not enough women in the excessive GWG group to obtain significant findings. Moreover, a large number of the women were classified into the inadequate GWG group. Furthermore, al- though an association between GWG and adverse outcomes was identified, a cause-and-effect association was not clear.
This means that it was unclear if the baby was small because of low GWG or if the GWG was low because the baby was small. Further prospective studies are necessary to analyze this association and set a clear standard for GWG while con- sidering this point, as well as to set an appropriate standard for weight gain specifically for Korean women with twin pregnancies.
Conflict of interest
No potential conflicts of interest relevant to this article were reported.
Ethical approval
The Institutional Review Board of Seoul National Bundang University Hospital approved the collection of the informa- tion for this study (B-1907-553-101). We followed the ethi- cal standards for human experimentation established in the Declaration of Helsinki.
Supplementary material
Supplementary Table 1 associated with this article can be found online at https://doi.org/10.5468/ogs.20133.
References
1. American College of Obstetricians and Gynecologists.
ACOG Committee opinion No. 548: weight gain during pregnancy. Obstet Gynecol 2013;121:210-2.
2. Nohr EA, Vaeth M, Baker JL, Sørensen TI, Olsen J, Ras- mussen KM. Combined associations of prepregnancy
body mass index and gestational weight gain with the outcome of pregnancy. Am J Clin Nutr 2008;87:1750-9.
3. LifeCycle Project-Maternal Obesity and Childhood Out- comes Study Group, Voerman E, Santos S, Inskip H, Amiano P, Barros H, et al. Association of gestational weight gain with adverse maternal and infant outcomes.
JAMA 2019;321:1702-15.
4. Diemert A, Lezius S, Pagenkemper M, Hansen G, Dro- zdowska A, Hecher K, et al. Maternal nutrition, inad- equate gestational weight gain and birth weight: results from a prospective birth cohort. BMC Pregnancy Child- birth 2016;16:224.
5. Viswanathan M, Siega-Riz AM, Moos MK, Deierlein A, Mumford S, Knaack J, et al. Outcomes of maternal weight gain. Evid Rep Technol Assess (Full Rep) 2008:1- 223.
6. Institute of Medicine. Nutrition during pregnancy: part I:
weight gain, part II: nutrient supplements. Washington, D.C.: The National Academies Press; 1990.
7. Rogozińska E, Zamora J, Marlin N, Betrán AP, Astrup A, Bogaerts A, et al. Gestational weight gain outside the Institute of Medicine recommendations and adverse pregnancy outcomes: analysis using individual partici- pant data from randomised trials. BMC Pregnancy Child- birth 2019;19:322.
8. Luke B, Hediger ML, Nugent C, Newman RB, Mauldin JG, Witter FR, et al. Body mass index--specific weight gains associated with optimal birth weights in twin pregnancies. J Reprod Med 2003;48:217-24.
9. Arora P, Tamber Aeri B. Gestational weight gain among healthy pregnant women from Asia in comparison with Institute of Medicine (IOM) guidelines-2009: a system- atic review. J Pregnancy 2019;2019:3849596.
10. Goldstein RF, Abell SK, Ranasinha S, Misso ML, Boyle JA, Harrison CL, et al. Gestational weight gain across conti- nents and ethnicity: systematic review and meta-analysis of maternal and infant outcomes in more than one mil- lion women. BMC Med 2018;16:153.
11. Denize KM, Acharya N, Prince SA, da Silva DF, Harvey AL, Ferraro ZM, et al. Addressing cultural, racial and ethnic discrepancies in guideline discordant gestational weight gain: a systematic review and meta-analysis.
PeerJ 2018;6:e5407.
12. Wie JH, Park IY, Namkung J, Seo HW, Jeong MJ, Kwon JY. Is it appropriate for Korean women to adopt the
2009 Institute of Medicine recommendations for gesta- tional weight gain? PLoS One 2017;12:e0181164.
13. Schieve LA, Cogswell ME, Scanlon KS. An empiric evalu- ation of the Institute of Medicine’s pregnancy weight gain guidelines by race. Obstet Gynecol 1998;91:878- 84.
14. WHO Expert Consultation. Appropriate body-mass index for Asian populations and its implications for policy and intervention strategies. Lancet 2004;363:157-63.
15. Fox NS, Rebarber A, Roman AS, Klauser CK, Peress D, Saltzman DH. Weight gain in twin pregnancies and ad- verse outcomes: examining the 2009 Institute of Medi- cine guidelines. Obstet Gynecol 2010;116:100-6.
16. Fox NS, Saltzman DH, Kurtz H, Rebarber A. Excessive weight gain in term twin pregnancies: examining the 2009 Institute of Medicine definitions. Obstet Gynecol 2011;118:1000-4.
17. Lee JJ. Birth weight for gestational age patterns by sex, plurality, and parity in Korean population. Korean J Pedi- atr 2007;50:732.
18. Firth D. Bias reduction of maximum likelihood estimates.
Biometrika 1993;80:27-38.
19. Pettit KE, Lacoursiere DY, Schrimmer DB, Alblewi H, Moore TR, Ramos GA. The association of inadequate mid-pregnancy weight gain and preterm birth in twin pregnancies. J Perinatol 2015;35:85-9.
20. Simões T, Cordeiro A, Júlio C, Reis J, Dias E, Blickstein I. Perinatal outcome and change in body mass index in mothers of dichorionic twins: a longitudinal cohort study. Twin Res Hum Genet 2008;11:219-23.
21. Kosinska-Kaczynska K, Szymusik I, Kaczynski B, Wielgos M. Observational study of associations between gesta- tional weight gain and perinatal outcomes in dichorionic twin pregnancies. Int J Gynaecol Obstet 2017;138:94-9.
22. Algeri P, Pelizzoni F, Bernasconi DP, Russo F, Incerti M, Cozzolino S, et al. Influence of weight gain, accord- ing to Institute of Medicine 2009 recommendation, on spontaneous preterm delivery in twin pregnancies. BMC Pregnancy Childbirth 2018;18:6.
23. Fox NS, Stern EM, Saltzman DH, Klauser CK, Gupta S, Rebarber A. The association between maternal weight gain and spontaneous preterm birth in twin pregnan- cies. J Matern Fetal Neonatal Med 2014;27:1652-5.
24. Huang A, Ji Z, Zhao W, Hu H, Yang Q, Chen D. Rate of gestational weight gain and preterm birth in relation to
prepregnancy body mass indices and trimester: a follow- up study in China. Reprod Health 2016;13:93.
25. Kabiru W, Raynor BD. Obstetric outcomes associated with increase in BMI category during pregnancy. Am J Obstet Gynecol 2004;191:928-32.
26. Hedderson MM, Gunderson EP, Ferrara A. Gestational weight gain and risk of gestational diabetes mellitus.
Obstet Gynecol 2010;115:597-604.
27. Simmons D. Diabetes and obesity in pregnancy. Best Pract Res Clin Obstet Gynaecol 2011;25:25-36.
28. Lee KH, Han YJ, Chung JH, Kim MY, Ryu HM, Kim JH, et al. Treatment of gestational diabetes diagnosed by the IADPSG criteria decreases excessive fetal growth. Obstet Gynecol Sci 2020;63;19-26.
29. Viecceli C, Remonti LR, Hirakata VN, Mastella LS, Gniel- ka V, Oppermann ML, et al. Weight gain adequacy and pregnancy outcomes in gestational diabetes: a meta- analysis. Obes Rev 2017;18:567-80.
30. Harper LM, Tita A, Biggio JR. The institute of medicine guidelines for gestational weight gain after a diagnosis of gestational diabetes and pregnancy outcomes. Am J Perinatol 2015;32:239-46.
31. Katon J, Reiber G, Williams MA, Yanez D, Miller E.
Weight loss after diagnosis with gestational diabetes and birth weight among overweight and obese women.
Matern Child Health J 2013;17:374-83.
32. Li N, Liu E, Guo J, Pan L, Li B, Wang P, et al. Maternal prepregnancy body mass index and gestational weight gain on pregnancy outcomes. PLoS One 2013;8:e82310.
33. Cedergren M. Effects of gestational weight gain and body mass index on obstetric outcome in Sweden. Int J
Gynaecol Obstet 2006;93:269-74.
34. Chen Y, Liu Y, Zhang Y, Hu R, Qian Z, Xian H, et al. Ges- tational weight gain per pre-pregnancy body mass index and birth weight in twin pregnancies: a cohort study in Wuhan, China. Sci Rep 2018;8:12496.
35. Lutsiv O, Hulman A, Woolcott C, Beyene J, Giglia L, Armson BA, et al. Examining the provisional guidelines for weight gain in twin pregnancies: a retrospective co- hort study. BMC Pregnancy Childbirth 2017;17:330.
36. González-Quintero VH, Kathiresan AS, Tudela FJ, Rhea D, Desch C, Istwan N. The association of gestational weight gain per institute of medicine guidelines and prepreg- nancy body mass index on outcomes of twin pregnan- cies. Am J Perinatol 2012;29:435-40.
37. Bodnar LM, Himes KP, Abrams B, Lash TL, Parisi SM, Eckhardt CL, et al. Gestational weight gain and adverse birth outcomes in twin pregnancies. Obstet Gynecol 2019;134:1075-86.
38. Lin D, Fan D, Wu S, Chen G, Li P, Ma H, et al. The effect of gestational weight gain on perinatal outcomes among Chinese twin gestations based on Institute of Medicine guidelines. BMC Pregnancy Childbirth 2019;19:262.
39. Gavard JA, Artal R. Gestational weight gain and mater- nal and neonatal outcomes in term twin pregnancies in obese women. Twin Res Hum Genet 2014;17:127-33.
40. Rasmussen KM, Yaktine AL; Institute of Medicine; Na- tional Research Council (US) Committee to Reexamine IOM Pregnancy Weight Guidelines. Weight gain during pregnancy: reexamining the guidelines. Washington, D.C.: The National Academies Press; 2009.