Introduction
Right ventricular (RV) function is an important determi- nant of clinical status and prognosis of patients with various conditions, including pulmonary hypertension.1-3) There are many studies showing the functional analysis of RV and some of them revealed regional analysis of RV using strain analysis in patients undergoing long term exercise.4-6) However, little study is known to analyze RV function with 2-dimensional (2D) strain echocardiography before and just after treadmill test. Treadmill exercise is very similar with usual and non-spe- cific activity most people can easily experience and we tried to evaluate importance of an acute cardiovascular adjustment of RV function to meet these needs which requires an integrated neural and hormonal responses that increase heart rate and stroke volume of RV. Some researches showed the change of echocardiography just after exercise.7)8) The aim of this study is
ORIGINAL ARTICLE J Cardiovasc Ultrasound 2016;24(1):35-39
to show the change of regional RV function just after tread- mill exercise with strain analysis.
Methods
Patients population
Data from 38 consecutive patients who visited hospital for hypertension, chest pain or dyspnea between January 2007 and December 2010 were retrospectively analyzed. Patients with heart failure, coronary artery occlusive disease, pulmo- nary thromboembolism, pulmonary hypertension of any cause, renal disorder or liver disease were excluded.
Treadmill exercise test
Symptom-limited graded treadmill exercise testing was per- formed with a standard Bruce protocol in a fasting state, and a
2-Dimensional Strain Analysis of Regional Change in Right Ventricular Function
after Treadmill Exercise
Se-Jung Yoon, MD1, Hye-Sun Seo, MD2, Sujung Park, MD2, and Wook-Jin Chung, MD3
1Division of Cardiology, Ilsan Hospital, National Health Insurance Service, Goyang, Korea
2Division of Cardiology, Department of Internal Medicine, Soonchunhyang University Hospital, Bucheon, Korea
3Division of Cardiology, Gachon University, Gil Medical Center, Incheon, Korea
Background: Function of right ventricle (RV) influences on symptoms and prognosis in various diseases. However the regional RV function analyzed with 2-dimensional (2D) strain echocardiography before and just after treadmill test has not been evaluated. The aim of this study was to show the change of regional RV function just after treadmill exercise with strain analysis.
Methods: A total of thirty eight patients who visited hospital for hypertension, chest pain or dyspnea between January 2007 and December 2010 were retrospectively analyzed (men, 47.4%; mean age, 54.9 ± 7.2 years). Treadmill exercise test and pre and post echocardiography were performed. 2D strain echocardiography was analyzed off line in RV free wall and septum.
Results: Mean exercise duration was 737 ± 132 sec. Tissue velocity in lateral tricuspid annulus is significantly increased in post exercise (initial, 10.5 ± 2.4 cm/sec vs. post exercise, 12.2 ± 1.8 cm/sec, p = 0.006). Systolic strain of RV free wall apex and mid portion were significantly changed in post exercise stage (free wall apex, -18.2 ± 7.6% vs. -22.3 ± 5.8%, p = 0.010; free wall mid, -14.1 ± 6.7% vs. -22.6 ± 6.8%, p = 0.022).
Conclusion: 2D strain imaging provides a precise tool to quantify regional RV function and reveals a characteristic regional pattern of RV after treadmill exercise.
KEY WORDS: Exercise test · Right ventricular function · 2-dimensional strain echocardiography.
• Received: July 13, 2015 • Revised: October 30, 2015 • Accepted: February 1, 2016
• Address for Correspondence: Hye-Sun Seo, Division of Cardiology, Department of Internal Medicine, Soonchunhyang University Hospital, 170 Jomaru-ro, Wonmi-gu, Bucheon 14584, Korea Tel: +82-32-621-5138, Fax: +82-32-621-6461, E-mail: [email protected]
• This is an Open Access article distributed under the terms of the Creative Commons Attribution Non-Commercial License (http://creativecommons.org/licenses/by-nc/3.0) which permits unrestricted non-commercial use, distribution, and reproduction in any medium, provided the original work is properly cited.
post-treatment treadmill exercise test was repeated at the same time of day as the baseline test.9) A 12-lead electrocardiogram was recorded at rest and 1-minute intervals until onset of lim- iting chest pain, leg fatigue or ≥ 0.2-mV ST-segment depres- sion. Blood pressure was measured with a sphygmomanometer during each minute of exercise and recovery. Time to 0.1-mV ST-segment depression was defined as the elapsed time from initiation of exercise to the occurrence of horizontal or down- sloping 0.1-mV ST-segment depression measured at 80 ms af- ter the J point. In this study, heart rate and systolic blood pressure at onset of 0.1-mV ST-segment depression were mea- sured to determine the ischemic threshold. All exercise tests and ST-segment evaluations were performed by investigators blinded to results of coronary angiograms and treatment status.
Echocardiographic data
Transthoracic echocardiography was performed at baseline and just after exercise test (within 2–3 minutes). With the subject in the left lateral position, transthoracic examinations were conducted according to current guidelines.10-12) Echocar- diographic studies were performed in all subjects and all re- cordings were stored digitally and analyzed offline. Measure- ments of left ventricular (LV) function included: LV outflow tract velocity time integral, LV end diastolic dimension, LV volume (diastolic and systolic), ejection fraction. Measure- ments of diastolic function, tricuspid regurgitation (TR), RV outflow tract velocity time integral (RVOT VTI), tissue Dop- pler peak systolic velocity of tissue Doppler imaging at the tricuspid annulus (S’) velocity were performed.
Pulmonary vascular resistance (PVR) was calculated as per Abbas et al.:13)
PVR (wood units) = 10 × (TR velocity / RVOT VTI) To estimate systolic function of RV, RV tissue Doppler im- aging (S’) was measured in RV free wall. The 6 × 6 mm sam- ple volume was placed directly underneath the mitral or tri- cuspid annulus in the basal myocardium in an apical four- chamber view.
Two-dimensional speckle-tracking echocardiography
Dynamic 2D ultrasound images of three cardiac cycles from apical two-, three-, and four chamber views were acquired us- ing conventional ultrasound, with a frame rate of 57 to 72 frames per second. To measure strain and strain rate, the im- age analysis was performed offline using customized software within the EchoPAC work station (EchoPAC, GE Vingmed Ultrasound, Milwaukee, WI, USA). The endocardial bound- ary of the LV was delineated manually, after which the soft- ware automatically drew the epicardial boundary. The widths of the regions of interest were adjusted manually to match the actual endocardial and epicardial boundaries. Automatic frame by frame tracking of speckle patterns during the cardiac cycle yielded a measure of strain and strain rate at any part of the
myocardium. On 2D global longitudinal strain analysis, echo- cardiographic machine with a 3.5-MHz transducer and high frame rate (50 or more Hz) was used to image the RV in apical views. 2D global longitudinal strain of whole RV (6 segments) and RV free wall only not including inter-ventricular septum (3 segments), were calculated using the EchoPAC. The longi- tudinal strain and strain rate of the basal, middle, and apical portions of RV free wall and septum were obtained in apical four-chamber view. By averaging these segmental values, RV peak systolic longitudinal velocity, strain and strain rate were calculated. The peak systolic longitudinal strain and strain rate represent ventricular longitudinal systolic function.
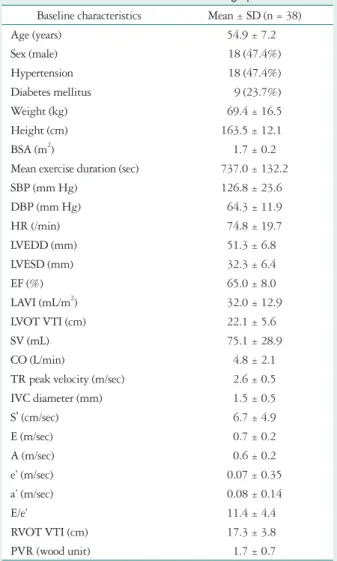
Table 1. Baseline characteristics of echocardiographic data Baseline characteristics Mean ± SD (n = 38)
Age (years) 54.9 ± 7.2
Sex (male) 18 (47.4%)
Hypertension 18 (47.4%)
Diabetes mellitus 9 (23.7%)
Weight (kg) 69.4 ± 16.5
Height (cm) 163.5 ± 12.1
BSA (m2) 1.7 ± 0.2
Mean exercise duration (sec) 737.0 ± 132.2
SBP (mm Hg) 126.8 ± 23.6
DBP (mm Hg) 64.3 ± 11.9
HR (/min) 74.8 ± 19.7
LVEDD (mm) 51.3 ± 6.8
LVESD (mm) 32.3 ± 6.4
EF (%) 65.0 ± 8.0
LAVI (mL/m2) 32.0 ± 12.9
LVOT VTI (cm) 22.1 ± 5.6
SV (mL) 75.1 ± 28.9
CO (L/min) 4.8 ± 2.1
TR peak velocity (m/sec) 2.6 ± 0.5
IVC diameter (mm) 1.5 ± 0.5
S’ (cm/sec) 6.7 ± 4.9
E (m/sec) 0.7 ± 0.2
A (m/sec) 0.6 ± 0.2
e’ (m/sec) 0.07 ± 0.35
a’ (m/sec) 0.08 ± 0.14
E/e’ 11.4 ± 4.4
RVOT VTI (cm) 17.3 ± 3.8
PVR (wood unit) 1.7 ± 0.7
Data are presented as mean ± SD or number of patients (%). BSA: body surface area, SBP: systolic blood pressure, DBP: diastolic blood pres- sure, HR: heart rate, LVEDD: left ventricular end diastolic dimension, LVESD: left ventricular end systolic dimension, EF: ejection fraction, LAVI: left atrial volume index, LVOT VTI: left ventricular outflow tract velocity time integrals, SV: stroke volume, CO: cardiac output, TR: tri- cuspid regurgitation, IVC: inferior vena cava, S’: peak systolic velocity of tissue Doppler imaging at the tricuspid annulus, E: early diastolic flow velocity, A: late diastolic flow velocity, e’: early diastolic annular velocity, a’: late diastolic annular velocity, RVOT: right ventricular outflow tract, PVR: pulmonary vascular resistance
Statistical analysis
Categorical variables were expressed as numbers and percent- ages. Continuous variables were analyzed using one sample t tests and are expressed as mean ± SD. Paired t test was used to compare between strain echocardiographic data of pre- and post exercise. All analyses were performed using SPSS version 20.0 (IBM, Armonk, NY, USA). p values < 0.05 were consid- ered statistically significant, and all p values are two sided.
Results
Baseline demographic and echocardiographic data
A total of 38 patients were studied. Mean age was 54.9 ± 7.2 years and male was 18 (47.4%). Patients showed good ex- ercise tolerance (exercise duration, 737.0 ± 132.2 sec) and pre- served systolic ejection fraction (65.0 ± 8.0%). Systolic blood pressure was 126.8 ± 23.6 mm Hg and diastolic blood pres- sure was 64.3 ± 11.9 mm Hg with mean heart rate was 74.8 ± 19.7/min. Left atrial volume index was 32.0 ± 12.9 mL/m2 and TR peak velocity was 2.6 ± 0.5 m/sec. early diastolic flow veloci- ty/early diastolic annular velocity was 11.4 ± 4.4 and S’ velocity was 6.7 ± 4.9 cm/sec (Table 1).
Change of echocardiographic index and strain data of pre and post exercise (n = 38)
There was no significant change of ejection fraction or cham- ber size except for RV tissue Doppler imaging (S’). S’ velocity of tricuspid annulus was significantly increased after exercise (pre vs. post, 7.5 ± 2.4 cm/sec vs. 12.2 ± 1.8 cm/sec, p = 0.006) (Ta-
Table 2. General echocardiographic change after exercise
Index Baseline
mean ± SD After exercise mean ± SD p-value SBP (mm Hg) 120.3 ± 21.7 149.9 ± 82.1 0.921
DBP (mm Hg) 65.7 ± 11.5 78.3 ± 9.2 0.655
HR (/min) 72.1 ± 16.8 92.7 ± 32.4 0.198
LVEDD (mm) 51.5 ± 6.6 50.8 ± 11.2 0.622
LVESD (mm) 33.3 ± 7.4 31.1 ± 7.2 0.391
EF (%) 65.0 ± 7.9 72.1 ± 12.5 0.284
LAVI (mL/m2) 32.5 ± 12.2 29.1 ± 6.6 0.795 LVOT VTI (cm) 22.9 ± 3.3 21.4 ± 11.2 0.615
SV (mL) 76.1 ± 24.2 73.4 ± 33.1 0.477
CO (L/min) 4.8 ± 1.7 4.5 ± 1.9 0.185
TR peak velocity (m/sec) 2.3 ± 1.1 2.9 ± 1.4 0.081
S’ (cm/sec) 7.5 ± 2.4 12.2 ± 1.8 0.006*
E (m/sec) 0.7 ± 0.1 0.6 ± 0.1 0.647
A (m/sec) 0.5 ± 0.1 0.6 ± 0.3 0.800
e’ (m/sec) 0.06 ± 0.41 0.04 ± 0.24 0.195
a’ (m/sec) 0.07 ± 0.22 0.08 ± 0.19 0.058
E/e’ 10.8 ± 1.2 13.4 ± 5.1 0.102
RVOT VTI (cm) 14.3 ± 2.4 12.1 ± 9.8 0.252
PVR (wood unit) 1.6 ± 0.9 1.8 ± 0.6 0.786
Data are presented as mean ± SD or number of patients (%). *p < 0.05.
SBP: systolic blood pressure, DBP: diastolic blood pressure, HR: heart rate, LVEDD: left ventricular end diastolic dimension, LVESD: left ven- tricular end systolic dimension, EF: ejection fraction, LAVI: left atrial vol- ume index, LVOT VTI: left ventricular outflow tract velocity time inte- grals, SV: stroke volume, CO: cardiac output, TR: tricuspid regurgitation, S’: peak systolic velocity of tissue Doppler imaging at the tricuspid annu- lus, E: early diastolic flow velocity, A: late diastolic flow velocity, e’: early diastolic annular velocity, a’: late diastolic annular velocity, RVOT: right ventricular outflow tract, PVR: pulmonary vascular resistance
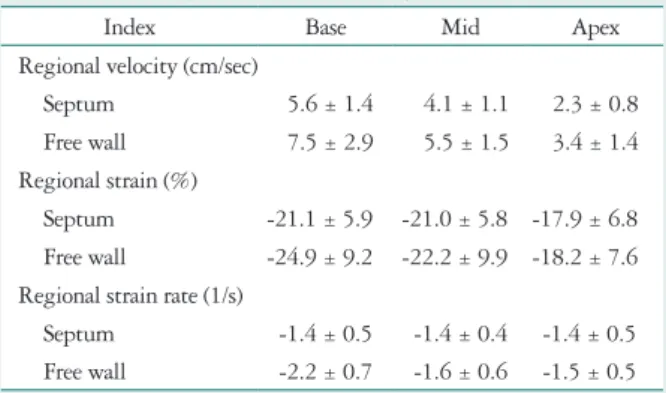
Table 3. Baseline systolic strain data of right ventricle (n = 38)
Index Base Mid Apex
Regional velocity (cm/sec)
Septum 5.6 ± 1.4 4.1 ± 1.1 2.3 ± 0.8
Free wall 7.5 ± 2.9 5.5 ± 1.5 3.4 ± 1.4
Regional strain (%)
Septum -21.1 ± 5.9 -21.0 ± 5.8 -17.9 ± 6.8 Free wall -24.9 ± 9.2 -22.2 ± 9.9 -18.2 ± 7.6 Regional strain rate (1/s)
Septum -1.4 ± 0.5 -1.4 ± 0.4 -1.4 ± 0.5
Free wall -2.2 ± 0.7 -1.6 ± 0.6 -1.5 ± 0.5 Data are presented as mean ± SD
Table 4. Echocardiographic change of systolic right ventricular strain data after exercise
Baseline Follow-up p-value Regional velocity (cm/sec)
Septum
Base 4.5 ± 1.2 5.7 ± 2.0 0.312
Mid 4.5 ± 1.2 4.8 ± 1.8 0.637
Apex 2.4 ± 1.1 2.6 ± 0.8 0.818
Lateral
Base 4.0 ± 2.0 6.8 ± 1.8 0.058
Mid 4.0 ± 1.2 5.1 ± 2.5 0.307
Apex 2.5 ± 0.9 3.9 ± 1.4 0.038*
Regional strain (%) Septum
Base -18.1 ± 3.1 -19.7 ± 5.9 0.976
Mid -14.2 ± 3.7 -20.5 ± 7.8 0.321
Apex -17.6 ± 4.8 -19.2 ± 9.0 0.688
Lateral
Base -17.5 ± 5.5 -18.5 ± 7.6 0.795
Mid -14.1 ± 6.7 -22.6 ± 6.8 0.022*
Apex -18.2 ± 7.6 -22.3 ± 5.8 0.010*
Regional strain rate (1/s) Septum
Base -1.3 ± 0.5 -1.6 ± 0.6 0.154
Mid -1.1 ± 0.4 -1.2 ± 0.6 0.699
Apex -1.1 ± 0.4 -1.2 ± 0.6 0.778
Lateral
Base -2.0 ± 0.7 -2.6 ± 0.5 0.095
Mid -1.3 ± 0.5 -1.4 ± 0.4 0.782
Apex -1.2 ± 0.8 -1.7 ± 0.5 0.290
Data are presented as mean ± SD. *p < 0.05
ble 2). There was increasing tendency of absolute values in systolic velocity, strain and strain rate of RV base level (Table 3). In follow-up data, there was significant change of systolic velocity at lateral apex of RV after exercise (pre vs. post, 2.5 ± 0.9 cm/sec vs. 3.9 ± 1.4 cm/sec, p = 0.038) and significant change of systolic strain at mid portion of lateral wall (pre vs.
post, -14.1 ± 6.7% vs. -22.6 ± 6.8%, p = 0.022) and lateral apex (pre vs. post, -18.2 ± 7.6% vs. -22.3 ± 5.8%, p = 0.010) after ex- ercise. There was no significant change of systolic regional strain rate of RV after exercise (Table 4, Fig. 1, 2, and 3).
Discussion
The anatomy and complex geometry of the RV confer sig- nificant limitations to 2D echocardiography.14)15) Current stud- ies use many novel technique including 3-dimensional or strain to analyze RV systolic function.16-19) Speckle tracking echocar- diography is a highly sensitive technique used to detect subtle myocardial dysfunction of systolic abnormalities.20-22) Many studies revealed regional analysis of RV using strain analysis in patients undergoing long term exercise.4-6)23) Anjak et al.23) demonstrated that tricuspid annular plane systolic excursion (TAPSE) and tricuspid annular systolic velocity are reliable
and accurate measures of the RV response to exercise during a supine bicycle stress echocardiography protocol. In that study, authors showed activated RV contraction during exercise through significantly increased TAPSE, tissue Doppler image velocity and peak RV strain compared with baseline (-34 ± 5%
vs. -40 ± 5%, baseline vs. 75 W). However, there is little study to show the regional analysis of RV with strain imaging before and just after treadmill exercise. Here we analyzed the systolic RV function with strain both pre and post exercise in non-coronary artery disease population. In this study, there was significant change of systolic velocity and strain at lateral apex and mid portion of RV after treadmill exercise. More sig- nificant activation was noted in RV free wall apex and mid portion via strain analysis. S’ velocity of tricuspid annulus was significantly increased after exercise.
The dynamic movement of RV has some different character- istics from LV. Compared with free wall, septal movement of RV is extremely dependent on LV movement, so septal wall motion is much more limited than the free wall of RV. The change of strain data at basal level of free wall between pre and post exercise is not significant. The absolute value of velocity and strain data of basal free wall is already larger even before exercise rather than mid or apex. For this reason, the difference between pre and post exercise may be relatively small.
Lord et al.24) revealed a similar study for RV function analy- sis within 30 minutes after ultra-endurance exercise, but it was performed to see the impact of ultra-marathon running on RV structure and function in highly trained runners. The subjects and type of exercise was difference from those of cur- rent study. In addition, it used mean global strain data other than regional analysis. La Gerche et al.4) showed a similar data for strain analysis immediate after endurance race (3–11 hours duration), the subjects were not a normal group but endurance athletes and the data was mean global strain data. In another report,25) improvement of RV strain was noted after chronic exercise training of 8 weeks, however we tried to evaluate re- gional RV function just after treadmill exercise.
Fig. 1. Systolic regional velocity of right ventricle after exercise. There is significant change of systolic velocity at right ventricular free wall apex after exercise. *p < 0.05.
7 6 5 4 3 2 1
0 Septum base
Septum mid
Septum apex
Free wall apex
Free wall mid
Free wall base
Regional velocity (cm/sec)
Pre Post
Fig. 2. Systolic regional strain of right ventricular after exercise. There is significant change of systolic strain at right ventricular free wall apex and mid portion after exercise. *p < 0.05.
0 -5 -10 -15 -20 -25
Septum base Septum
mid Septum apex Free wall
apex Free wall mid Free wall
base
Regional strain (%)
Pre Post
Fig. 3. Systolic regional strain rate of right ventricle after exercise. There is no significant change of systolic strain rate of right ventricle after exercise.
0 -0.5 -1 -1.5 -2 -2.5 -3
Septum base Septum
mid Septum apex Free wall
apex Free wall mid Free wall
base
Regional strain rate (1/s)
Pre Post
The present study had some limitations. First, the number of patients enrolled was small, and our results should be con- firmed in a larger population. Second, we excluded patients in whom suitable views could not be obtained even by shifting or moving the echo probe from the standard 4 chamber view po- sition. Furthermore, the feasibility of 2D strain analysis soft- ware applied to RV has remained unclear, although this soft- ware has been applied to RV in several clinical studies. Finally, the present study does not include long-term follow-up data.
Conclusion
2D strain imaging provides a precise tool to quantify re- gional RV function and reveals a characteristic regional pat- tern of RV after treadmill exercise. Our study demonstrates for the first time the regional change of RV just after treadmill exercise.
References
1. Benza RL, Miller DP, Barst RJ, Badesch DB, Frost AE, McGoon MD. An evaluation of long-term survival from time of diagnosis in pulmo- nary arterial hypertension from the REVEAL Registry. Chest 2012;
142:448-56.
2. Brili S, Stamatopoulos I, Misailidou M, Chrysohoou C, Tousoulis D, Tatsis I, Stefanadis C. Longitudinal strain curves in the RV free wall dif- fer in morphology in patients with pulmonary hypertension compared to con- trols. Int J Cardiol 2013;167:2753-6.
3. Simon MA, Pinsky MR. Right ventricular dysfunction and failure in chronic pressure overload. Cardiol Res Pract 2011;2011:568095.
4. La Gerche A, Burns AT, Mooney DJ, Inder WJ, Taylor AJ, Bogaert J, Macisaac AI, Heidbüchel H, Prior DL. Exercise-induced right ven- tricular dysfunction and structural remodelling in endurance athletes. Eur Heart J 2012;33:998-1006.
5. Oxborough D, Shave R, Warburton D, Williams K, Oxborough A, Charlesworth S, Foulds H, Hoffman MD, Birch K, George K. Dila- tation and dysfunction of the right ventricle immediately after ultraendurance exercise: exploratory insights from conventional two-dimensional and speckle tracking echocardiography. Circ Cardiovasc Imaging 2011;4:253-63.
6. Simsek Z, Tas MH, Gunay E, Degirmenci H. Speckle-tracking echo- cardiographic imaging of the right ventricular systolic and diastolic parame- ters in chronic exercise. Int J Cardiovasc Imaging 2013;29:1265-71.
7. Dalla Vecchia L, Traversi E, Porta A, Lucini D, Pagani M. On site as- sessment of cardiac function and neural regulation in amateur half mara- thon runners. Open Heart 2014;1:e000005.
8. Knebel F, Schimke I, Schroeckh S, Peters H, Eddicks S, Schattke S, Brechtel L, Lock J, Wernecke KD, Dreger H, Grubitz S, Schmidt J, Baumann G, Borges AC. Myocardial function in older male amateur marathon runners: assessment by tissue Doppler echocardiography, speckle tracking, and cardiac biomarkers. J Am Soc Echocardiogr 2009;22:803-9.
9. Quyyumi AA, Panza JA, Diodati JG, Lakatos E, Epstein SE. Circa- dian variation in ischemic threshold. A mechanism underlying the circadian variation in ischemic events. Circulation 1992;86:22-8.
10. Rudski LG, Lai WW, Afilalo J, Hua L, Handschumacher MD, Chandrasekaran K, Solomon SD, Louie EK, Schiller NB. Guidelines for the echocardiographic assessment of the right heart in adults: a report from the American Society of Echocardiography endorsed by the European Association of Echocardiography, a registered branch of the European Society of Cardiology, and the Canadian Society of Echocardiography. J Am Soc Echocardiogr 2010;23:685-713; quiz 786-8.
11. Lang RM, Bierig M, Devereux RB, Flachskampf FA, Foster E, Pel- likka PA, Picard MH, Roman MJ, Seward J, Shanewise J, Solomon
S, Spencer KT, St John Sutton M, Stewart W; American Society of Echocardiography’s Nomenclature and Standards Committee; Task Force on Chamber Quantification; American College of Cardiology Echocardiography Committee; American Heart Association; Euro- pean Association of Echocardiography, European Society of Cardiol- ogy. Recommendations for chamber quantification. Eur J Echocardiogr 2006;7:79-108.
12. Gardin JM, Adams DB, Douglas PS, Feigenbaum H, Forst DH, Fraser AG, Grayburn PA, Katz AS, Keller AM, Kerber RE, Khand- heria BK, Klein AL, Lang RM, Pierard LA, Quinones MA, Schnitt- ger I; American Society of Echocardiography. Recommendations for a standardized report for adult transthoracic echocardiography: a report from the American Society of Echocardiography’s Nomenclature and Standards Committee and Task Force for a Standardized Echocardiography Report. J Am Soc Echocardiogr 2002;15:275-90.
13. Abbas AE, Fortuin FD, Schiller NB, Appleton CP, Moreno CA, Lester SJ. A simple method for noninvasive estimation of pulmonary vascu- lar resistance. J Am Coll Cardiol 2003;41:1021-7.
14. Ho SY, Nihoyannopoulos P. Anatomy, echocardiography, and normal right ventricular dimensions. Heart 2006;92 Suppl 1:i2-13.
15. Mertens LL, Friedberg MK. Imaging the right ventricle--current state of the art. Nat Rev Cardiol 2010;7:551-63.
16. Focardi M, Cameli M, Carbone SF, Massoni A, De Vito R, Lisi M, Mondillo S. Traditional and innovative echocardiographic parameters for the analysis of right ventricular performance in comparison with cardiac magnetic resonance. Eur Heart J Cardiovasc Imaging 2015;16:47-52.
17. Knight DS, Grasso AE, Quail MA, Muthurangu V, Taylor AM, Toumpanakis C, Caplin ME, Coghlan JG, Davar J. Accuracy and re- producibility of right ventricular quantification in patients with pressure and volume overload using single-beat three-dimensional echocardiography. J Am Soc Echocardiogr 2015;28:363-74.
18. Portnoy SG, Rudski LG. Echocardiographic evaluation of the right ven- tricle: a 2014 perspective. Curr Cardiol Rep 2015;17:21.
19. Smith BC, Dobson G, Dawson D, Charalampopoulos A, Grapsa J, Nihoyannopoulos P. Three-dimensional speckle tracking of the right ven- tricle: toward optimal quantification of right ventricular dysfunction in pul- monary hypertension. J Am Coll Cardiol 2014;64:41-51.
20. Dandel M, Lehmkuhl H, Knosalla C, Suramelashvili N, Hetzer R.
Strain and strain rate imaging by echocardiography - basic concepts and clinical applicability. Curr Cardiol Rev 2009;5:133-48.
21. Mor-Avi V, Lang RM, Badano LP, Belohlavek M, Cardim NM, De- rumeaux G, Galderisi M, Marwick T, Nagueh SF, Sengupta PP, Sic- ari R, Smiseth OA, Smulevitz B, Takeuchi M, Thomas JD, Vannan M, Voigt JU, Zamorano JL. Current and evolving echocardiographic techniques for the quantitative evaluation of cardiac mechanics: ASE/EAE consensus statement on methodology and indications endorsed by the Japanese Society of Echocardiography. Eur J Echocardiogr 2011;12:167-205.
22. Serrano-Ferrer J, Walther G, Crendal E, Vinet A, Dutheil F, Naugh- ton G, Lesourd B, Chapier R, Courteix D, Obert P. Right ventricle free wall mechanics in metabolic syndrome without type-2 diabetes: effects of a 3-month lifestyle intervention program. Cardiovasc Diabetol 2014;13:
116.
23. Anjak A, López-Candales A, Lopez FR, Harris D, Elwing J. Objective measures of right ventricular function during exercise: results of a pilot study.
Echocardiography 2014;31:508-15.
24. Lord R, Somauroo J, Stembridge M, Jain N, Hoffman MD, George K, Jones H, Shave R, Haddad F, Ashley E, Oxborough D. The right ventricle following ultra-endurance exercise: insights from novel echocardiogra- phy and 12-lead electrocardiography. Eur J Appl Physiol 2015;115:71-80.
25. Leggio M, Mazza A, Cruciani G, Sgorbini L, Pugliese M, Bendini MG, Severi P, Jesi AP. Effects of exercise training on systo-diastolic ven- tricular dysfunction in patients with hypertension: an echocardiographic study with tissue velocity and strain imaging evaluation. Hypertens Res 2014;37:649-54.