ABSTRACT
BACKGROUND: CHA2DS2-VASc is the most widely accepted scoring system for atrial fibrillation (AF) to assess stroke risk, although little has been revealed regarding the accompanying cardiac functional/structural changes. This echocardiography study was undertaken to understand the changes related to CHA2DS2-VASc scores.
METHODS: A total of 4,795 nonvalvular AF patients were enrolled for the cohort, from which 591 were excluded as they did not meet the inclusion criteria. Based on the CHA2DS2-VASc scores, the remaining 4,204 patients included in the study were divided into 4 groups: 0 to 1 (n = 991); 2 to 3 (n = 1,642); 4 to 6 (n = 1,407); 7 to 9 (n = 164).
RESULTS: Increase in the left ventricular mass index and prevalence of left ventricular hypertrophy (LVH) were observed with elevating CHA2DS2-VASc scores (p < 0.05 for all).
Diastolic parameters such as left atrial volume index (LAVI) and the ratio of early diastolic mitral inflow velocity to early diastolic velocity of the mitral annulus (E/E′) also increased significantly in the higher CHA2DS2-VASc score groups (p < 0.001 for all), although two-way ANOVA analysis showed that such incremental diastolic impairment was independent of hypertension. LVH (hazard ratio [HR], 3.609; confidence interval [CI], 2.426–5.369; p < 0.001) and E/E′ (HR, 1.087;
CI, 1.054–1.121; p < 0.001) were independent risk factors for CHA2DS2-VASc scores 2 or higher.
CONCLUSIONS: Our findings suggest that increasing CHA2DS2-VASc scores are associated with impaired diastolic function that may represent high left atrial pressure favoring thrombogenic propensity.
Keywords: Atrial fibrillation; Left ventricular hypertrophy; CHA2DS2-VASc score;
Diastolic dysfunction; Hypertension
INTRODUCTION
CHA2DS2-VASc score is the most widely accepted predictor for stroke in patients with atrial fibrillation (AF).1) Although previous studies have shown associated functional/structural changes of the heart in AF patients with thromboembolic events, little is known regarding the link between such transformations and CHA2DS2-VASc scores.2-5) Hence, understanding
Original Article
Received: Jul 25, 2018 Revised: Aug 31, 2018 Accepted: Sep 4, 2018 Address for Correspondence:
Jeonggeun Moon, MD, PhD
Cardiology Division, Department of Internal Medicine, Gachon University Gil Medical Center, 21 Namdong-daero 774beon-gil, Namdong-gu, Incheon 21565, Korea.
E-mail: [email protected] Copyright © 2018 Korean Society of Echocardiography
This is an Open Access article distributed under the terms of the Creative Commons Attribution Non-Commercial License (https://
creativecommons.org/licenses/by-nc/4.0/) which permits unrestricted non-commercial use, distribution, and reproduction in any medium, provided the original work is properly cited.
ORCID iDs
Albert Youngwoo Jang
https://orcid.org/0000-0002-8802-268X Jongwook Yu
https://orcid.org/0000-0001-7489-2222 Mi Seung Shin
https://orcid.org/0000-0002-0273-0109 Wook-Jin Chung
https://orcid.org/0000-0002-9767-7098 Jeonggeun Moon
https://orcid.org/0000-0001-6431-2802 Conflict of Interest
The authors have no financial conflicts of interest.
Albert Youngwoo Jang , MD, Jongwook Yu , MD, Ye Min Park, MD, Mi Seung Shin , MD, PhD, Wook-Jin Chung , MD, PhD, and
Jeonggeun Moon , MD, PhD
Division of Cardiology, Department of Internal Medicine, Gachon University Gil Medical Center, Incheon, Korea
Cardiac Structural or Functional
Changes Associated with CHA 2 DS 2 -VASc Scores in Nonvalvular Atrial Fibrillation:
A Cross-Sectional Study Using
Echocardiography
how clinical attributes in higher CHA2DS2-VASc scores translate to a structurally/
functionally thrombogenic heart is of great clinical significance, and may add a predictive value to the traditional scoring system. This study therefore undertook to determine the echocardiographic differences within each CHA2DS2-VASc score group in patients with non- valvular AF (NVAF) using well-defined echocardiographic criteria.
METHODS
Study sample
This study was approved by the institutional Review Board of Gachon University Gil hospital (GDIRB2018-305). We retrospectively analyzed medical charts and echocardiography of AF patients at Gachon University Medical Center between January 1st, 2007 and May 15th, 2018.
Inclusion criteria were (1) having an ICD10 coded diagnosis of AF; (2) AF rhythm confirmed during echocardiographic exam; (3) age ≥18 years. Exclusion criteria were (1) patients with more than moderate severity of either mitral or aortic valvular disease except for functional mitral regurgitation; (2) history of surgery to either mitral or aortic valves.6) Comorbidity for calculating CHA2DS2-VASc scores was obtained from medical records. Hypertension (HTN) was defined as either having an ICD10 code of hypertension (I109 or I159) or blood pressure over 140 and/or 90 mmHg regardless of antihypertensive medication intake.
Congestive heart failure (CHF) was defined as patients with ICD10 codes of heart failure (I110, I119, I130, I132, I5004, I5008, and I5004). Patients who had any ICD10 codes from E1 were diagnosed as diabetes mellitus (DM). Stroke, peripheral artery disease, non-pulmonary thromboembolism, pulmonary thromboembolism, and aortic plaque were defined by ICD10 codes of I63, I73, I74, I26, and I7, respectively. Transient ischemic attack (TIA) was defined as ICD10 codes of G45.9. Myocardial infarction (MI) was defined as patients having any of the ICD10 codes related to MI (I210, I211, I212, I213, I214, I219, I220, I221, I228, I229, I231, I233, I234, I235, I238 or I252). Based on their CHA2DS2-VASc scores from 0 to 9, patients were divided into 4 groups: group 1 (0 to 1), group 2 (2 to 3), group 3 (4 to 6), and group 4 (7 to 9).
Selection of patients and their sub-division is presented in Figure 1. Based on the inherent nature of CHA2DS2-VASc scores, females have a higher CHA2DS2-VASc score by a margin of 1.0 than the males.
All 4,204 participated in cohort
Group 1:
CHA2DS2 VASc Score 0–1 (n = 991)
Group 2:
CHA2DS2 VASc Score 2–3 (n = 1,642)
Group 3:
CHA2DS2 VASc Score 4–6 (n = 1,407)
Group 4:
CHA2DS2 VASc Score 7–9 (n = 164) All 4,795 consecutive AF patients enrolled
through January 1st, 2011 to May 15th, 2018
481 with valvular disease excluded 77 with valvular operation excluded
33 with missing LVM or BSA information excluded
Figure 1. Diagram for detalied enrollement of patients. A total of 4,795 patients were enrolled for the cohort.
After excluding 591 patients with either missing data or valvular disease or surgery, 4,204 patients were allocated in each group according to their CHA2DS2 VASc scores.
Echocardiography
Two-dimensional transthoracic echocardiography performed at initial presentation with AF was utilized. The left ventricular ejection fraction (LVEF), left ventricular end diastolic volume (LVEDV) and left ventricular end systolic volume (LVESV) was calculated using the modified Simpson's method. Left ventricular end-diastolic dimension (LVEDD) and left ventricular end-systolic dimension (LVESD) was measured in the two-dimensional mode in the parasternal long axis view. Maximal left atrial (LA) volume was calculated using the prolate ellipsoid model3 and indexed to the body surface area (LA volume index [LAVI]). A 1–2 mm pulsed Doppler sample volume was located at the tip of mitral valve, where velocities were measured from the apical window. The peak early diastolic filling velocity (E) was divided by the early diastolic mitral annulus velocity (E′) measured by Doppler tissue imaging at the medial mitral annulus for E/E′ calculation. All echocardiographic examinations were performed by two highly trained echocardiographers who were unaware of the patient's clinical information. Valvular heart diseases were diagnosed according to established guidelines.7) LV mass was calculated by the formula 0.8[1.04(SWTd + LVEDD + PWTd)3 − LVEDD3] + 0.6 (g), where PWTd and SWTd were posterior wall thicknesses and septal wall thickness at the end diastole, respectively.8) LV mass was indexed to the body surface area (LVMI). Left ventricular hypertrophy (LVH) was defined as >115 g/m2 for male patients and
>95 g/m2 for female patients.9) We defined the relative wall thickness (RWT) as the ratio of twice the LV inferolateral wall thickness to the LV internal diameter measured at end-diastole.
RWT was used to further categorize LV mass as either concentric (RWT > 0.42) or eccentric (RWT ≤ 0.42).
Statistical analysis
Data analysis was performed using IBM SPSS Statistics (IBM Corp. Released 2014. IBM SPSS Statistics for Windows, Version 23.0. Armonk, NY: IBM Corp.). Continuous normally- distributed data are expressed as means ± standard deviation. Student's one-way ANOVA test was applied for comparing inter-group differences for normally distributed variables, where post-hoc Tukey's test was utilized to determine inter-group statistical significance. To examine whether HTN was a confounding factor for progression of diastolic dysfunction in increasing CHA2DS2-VASc scores, two-way ANOVA was conducted. Categorical variables were analyzed by Pearson χ2 test. To evaluate the independent effect of each echocardiographic parameter on patients having CHA2DS2-VASc scores of 2 or higher, we performed a univariable and multivariable-adjusted binary logistic regression analysis.
RESULTS
Baseline characteristics
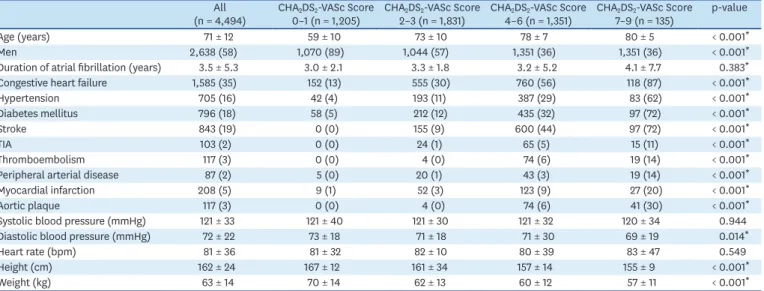
Demographic data of all CHA2DS2-VASc score groups are shown in Table 1. A total of 4,180 patients were evaluated, where the overall age was 71 years and 59% were men. Patient age significantly increased with increasing CHA2DS2-VASc scores, whereas a decrease was observed in the percentage of afflicted males. A rising trend was also observed in the percentage of CHF, HTN, DM, stroke, TIA, peripheral artery disease, MI, non-pulmonary thromboembolism, pulmonary thromboembolism, and aortic plaque with increasing CHA2DS2-VASc scores (p < 0.001 for all).
The duration of AF were comparable among CHA2DS2-VASc score categories.
Echocardiographic data
The echocardiographic parameters of each CHA2DS2-VASc score group are presented in Table 2. LVEF, LVEDD, LVESD, LVEDV, and LVESV show decreasing values (p < 0.001 for all), whereas LVMI and LVH increase with the higher CHA2DS2-VASc scores (Table 2 and Figure 2).
A similar increasing trend was observed in left atrial anterior posterior dimension suggesting a rise in LA size with higher CHA2DS2-VASc scores. Diastolic parameters such as LAVI and E/E′ are also significantly increased. LVEDD, LVESD, LVEDV, and LVESV indexed by body surface area showed decreasing trends with higher CHA2DS2-VASc scores (p < 0.05 for all).
Table 1. Baseline characteristics of nonvalvular atrial fibrillation patients with 4 different CHA2DS2-VASc score categories All
(n = 4,494) CHA2DS2-VASc Score
0–1 (n = 1,205) CHA2DS2-VASc Score
2–3 (n = 1,831) CHA2DS2-VASc Score
4–6 (n = 1,351) CHA2DS2-VASc Score
7–9 (n = 135) p-value
Age (years) 71 ± 12 59 ± 10 73 ± 10 78 ± 7 80 ± 5 < 0.001*
Men 2,638 (58) 1,070 (89) 1,044 (57) 1,351 (36) 1,351 (36) < 0.001*
Duration of atrial fibrillation (years) 3.5 ± 5.3 3.0 ± 2.1 3.3 ± 1.8 3.2 ± 5.2 4.1 ± 7.7 0.383*
Congestive heart failure 1,585 (35) 152 (13) 555 (30) 760 (56) 118 (87) < 0.001*
Hypertension 705 (16) 42 (4) 193 (11) 387 (29) 83 (62) < 0.001*
Diabetes mellitus 796 (18) 58 (5) 212 (12) 435 (32) 97 (72) < 0.001*
Stroke 843 (19) 0 (0) 155 (9) 600 (44) 97 (72) < 0.001*
TIA 103 (2) 0 (0) 24 (1) 65 (5) 15 (11) < 0.001*
Thromboembolism 117 (3) 0 (0) 4 (0) 74 (6) 19 (14) < 0.001*
Peripheral arterial disease 87 (2) 5 (0) 20 (1) 43 (3) 19 (14) < 0.001*
Myocardial infarction 208 (5) 9 (1) 52 (3) 123 (9) 27 (20) < 0.001*
Aortic plaque 117 (3) 0 (0) 4 (0) 74 (6) 41 (30) < 0.001*
Systolic blood pressure (mmHg) 121 ± 33 121 ± 40 121 ± 30 121 ± 32 120 ± 34 0.944
Diastolic blood pressure (mmHg) 72 ± 22 73 ± 18 71 ± 18 71 ± 30 69 ± 19 0.014*
Heart rate (bpm) 81 ± 36 81 ± 32 82 ± 10 80 ± 39 83 ± 47 0.549
Height (cm) 162 ± 24 167 ± 12 161 ± 34 157 ± 14 155 ± 9 < 0.001*
Weight (kg) 63 ± 14 70 ± 14 62 ± 13 60 ± 12 57 ± 11 < 0.001*
Values are presented as means ± standard deviation or number (%).
TIA: transient ischemic attack.
*p < 0.05.
Table 2. Echocardiographic parameters of nonvalvular atrial fibrillation patients with 4 different CHA2DS2-VASc score categories All
(n = 4,494) CHA2DS2-VASc Score
0–1 (n = 1,205) CHA2DS2-VASc Score
2–3 (n = 1,831) CHA2DS2-VASc Score
4–6 (n = 1,351) CHA2DS2-VASc Score
7–9 (n = 135) p-value
LVEF (%) 43 ± 28 46 ± 27 44 ± 29 41 ± 29 39 ± 31 < 0.001*
LVEDD (mm) 50 ± 7 51 ± 6 50 ± 7 49 ± 7 49 ± 6 < 0.001*
LVESD (mm) 35 ± 10 36 ± 8 35 ± 12 34 ± 8 34 ± 6 0.001*
LVEDV (mL) 68 ± 44 79 ± 48 66 ± 42 62 ± 44 55 ± 35 < 0.001*
LVESV(mL) 38 ± 33 44 ± 36 37 ± 31 34 ± 32 30 ± 25 < 0.001*
BSA (m2) 1.7 ± 0.2 1.8 ± 0.2 1.7 ± 0.2 1.6 ± 0.2 1.6 ± 0.2 0.025*
LVEDD/BSA (cm/m2) 3.03 ± 0.62 3.14 ± 0.57 3.02 ± 0.69 3.00 ± 0.55 2.93 ± 0.52 < 0.001*
LVESD/BSA (cm/m2) 2.13 ± 0.70 2.21 ± 0.57 2.12 ± 0.87 2.09 ± 0.55 2.02 ± 0.44 < 0.001*
LVEDV/BSA (mL/m2) 45.3 ± 23.5 53.0 ± 24.2 44.0 ± 22.5 41.3 ± 23.2 37.7 ± 18.9 < 0.001*
LVESV/BSA (mL/m2) 22.6 ± 18.8 27.0 ± 19.9 21.6 ± 18.0 20.7 ± 18.7 18.8 ± 14.5 < 0.001*
LA diameter (mm) 45 ± 16 43 ± 16 46 ± 16 45 ± 17 46 ± 16 0.009*
LVMI (g/m2) 99 ± 51 96 ± 31 100 ± 60 101 ± 54 101 ± 32 0.085
RWT 0.37 ± 0.12 0.36 ± 0.08 0.37 ± 0.13 0.37 ± 0.14 0.38 ± 0.07 0.008*
LAVI (mL/m2) 54 ± 52 50 ± 61 53 ± 43 58 ± 49 63 ± 83 < 0.001*
E/E' 13.7 ± 7.0 11.5 ± 6.1 13.5 ± 6.5 15.4 ± 7.6 17.2 ± 8.5 < 0.001*
TEI 0.02 ± 0.16 0.03 ± 0.22 0.01 ± 0.14 0.02 ± 0.14 0.00 ± 0.01 0.497
High LVMI 1,637 (34) 274 (22) 656 (34) 629 (43) 78 (53) < 0.001*
High RWT 919 (19) 217 (18) 350 (18) 312 (21) 40 (27) 0.002
Values are presented as means ± standard deviation or number (%).
BSA: body surface area, E/E′: the ratio of early diastolic mitral inflow velocity to early diastolic velocity of the mitral annulus, LA: left atrial, LAVI: left atrial volume index, LVEDD: left ventricular end diastolic dimension, LVEDV: left ventricular end diastolic volume, LVEF: left ventricular ejection fraction, LVESD: left ventricular end systolic dimension, LVESV: left ventricular end systolic volume, LVMI: left ventricular mass index, RWT: relative wall thickness, TEI: TEI index.
*p < 0.05.
Progression of diastolic dysfunction in increasing CHA
2DS
2-VASc scores is independent of HTN
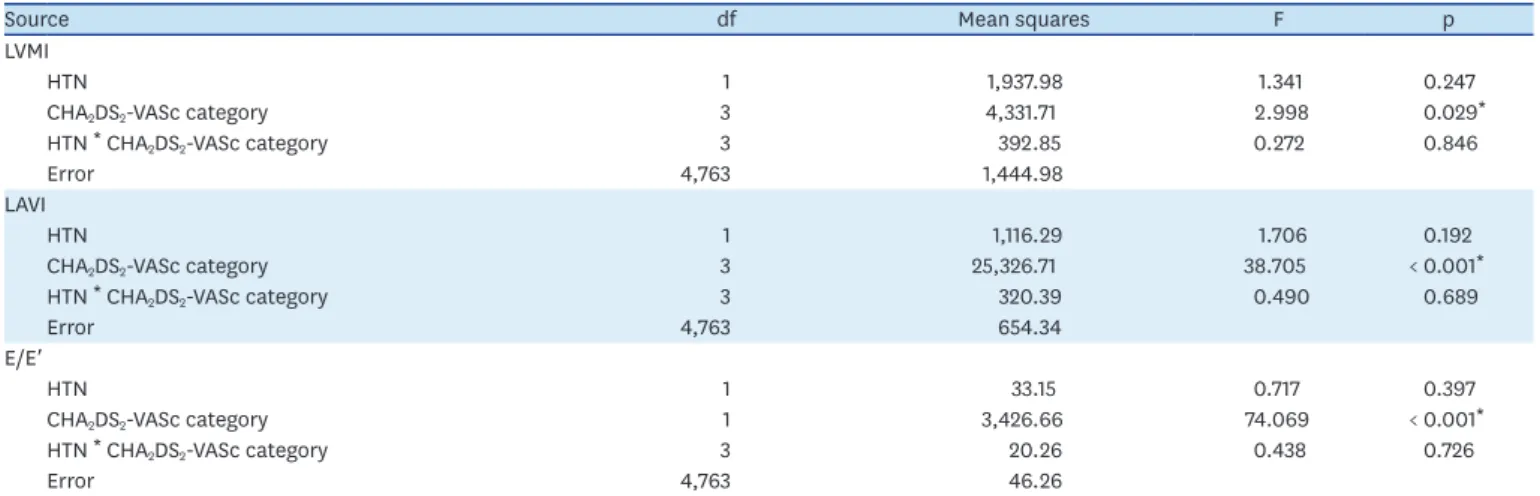
To determine whether the progressive diastolic dysfunction with incremental CHA2DS2-VASc scores were affected by HTN, CHA2DS2-VASc score or the interaction of both entities, we performed a two-way ANOVA as shown in Table 3. There was significant main effect by CHA2DS2-VASc score categories to LVMI (F=2.998, p = 0.029), LAVI (F= 38.705, p < 0.001),
Group 1 Group 2 Group 3 Group 4 102
2LVMI (g/m) 96
108 *
*
* 99
93 105
A
Group 1 Group 2 Group 3 Group 4 46
LAD (mm)
50
44 42 48
B *
*
*
Group 1 Group 2 Group 3 Group 4 60
2LAVI (mL/m) 45 55
70 *
*
*
50
40 65
C
Group 1 Group 2 Group 3 Group 4 18
E/E′
24
12 9 15 21
D *
*
* * * *
Figure 2. Trends of each echocardiographic parameter. Tukey's post hoc test results for left ventricular mass index (A), left atrial dimension (B), left atrial volume index (C), and the ratio of early diastolic mitral inflow velocity to early diastolic velocity of the mitral annulus (D) are shown. E/E′: the ratio of early diastolic mitral inflow velocity to early diastolic velocity of the mitral annulus, LAD: left atrial anterior posterior dimension, LAVI: left atrial volume index, LVMI: left ventricular mass index.
*p < 0.05.
Table 3. Two-way ANOVA analysis for diastolic parameters and their independence to hypertension and CHA2DS2-VASc scores
Source df Mean squares F p
LVMI
HTN 1 1,937.98 1.341 0.247
CHA2DS2-VASc category 3 4,331.71 2.998 0.029*
HTN * CHA2DS2-VASc category 3 392.85 0.272 0.846
Error 4,763 1,444.98
LAVI
HTN 1 1,116.29 1.706 0.192
CHA2DS2-VASc category 3 25,326.71 38.705 < 0.001*
HTN * CHA2DS2-VASc category 3 320.39 0.490 0.689
Error 4,763 654.34
E/E′
HTN 1 33.15 0.717 0.397
CHA2DS2-VASc category 1 3,426.66 74.069 < 0.001*
HTN * CHA2DS2-VASc category 3 20.26 0.438 0.726
Error 4,763 46.26
df: degree of freedom, E/E′: the ratio of early diastolic mitral inflow velocity to early diastolic velocity of the mitral annulus, HTN: hypertension, LAVI: left atrial volume index, LVMI: left ventricular mass index.
*p < 0.05.
and E/E′ (F=74.069, p < 0.001). HTN or the interaction between both factors, however, did not affect any of the diastolic parameters, suggesting that the progressive impairment of diastolic function in incremental CHA2DS2-VASc scores were independent of HTN.
Prediction of CHA
2DS
2-VASc score 2 or higher by diastolic parameters
In order to examine whether echocardiographic parameters can predict CHA2DS2-VASc scores 2 or higher where anticoagulation treatment is required, we implemented a univariate and multivariate-adjusted binary logistic regression analysis. Table 4 shows that all variables associated with CHA2DS2-VASc score 2 or higher in the univariate analysis are included in the multivariate-adjusted binary logistic regression analysis. In the multivariate analysis adjusted by clinical parameters, echocardiographic parameters such as LVH, E/E′ and LVEDD are seen to be significantly associated with CHA2DS2-VASc scores 2 or higher.
DISCUSSION
Principle findings
The present analysis of an NVAF population at a single center cohort helps identify the structure/function of the heart in different CHA2DxS2-VASc score groups. In our study, we found (1) a significantly higher prevalence of LVH, (2) significant impairment of the diastolic parameters in NVAF patients with increasing CHA2DS2-VASc scores, and (3) predictive value of echocardiographic profile per se (such as LVH and E/E′) for determining CHA2DS2-VASc scores 2 or higher.
Limitations of CHA
2DS
2-VASc scores
The CHA2DS2-VASc scores provide a clinically handy, easy-to-use stratification scoring system to assess thromboembolic risk in patients with NVAF. A combination of equally weighted clinical parameters, with the exception of age and stroke/TIA, consist the scoring system. However, it may be an over-simplification of the patients at risk and may not reflect the structure or function of the heart that is prone to thromboembolism regardless of the CHA2DS2-VASc scores.10) For example, a patient with CHA2DS2-VASc scores of 3, with or without functional impairment of the heart, may not have the same risk for stroke. Thus, it Table 4. Univariate and multivariate logistic regression for the prediction of CHA2DS2-VASc score 2 or higher
Univariate Multivariate
Odds ratio (95% confidence interval) p Odds ratio (95% confidence interval) p
LVH 2.031 (1.696 – 2.431) < 0.001* 3.609 (2.426 – 5.367) < 0.001*
LAVI (mL/m2) 1.012 (1.008 – 1.016) < 0.001* 1.009 (1.001 – 1.016) 0.066
E/E′ 1.087 (1.070 – 1.103) < 0.001* 1.087 (1.054 – 1.121) < 0.001*
LVEF (%) 0.999 (0.993 – 1.005) 0.734
LVEDD (mm) 0.969 (0.955 – 0.983) < 0.001* 0.887 (0.860 – 0.915) < 0.001*
LVESD (mm) 0.995 (0.985 – 1.004) 0.276
LADAP (mm) 1.006 (0.998 – 1.013) 0.138
CHF 5.036 (4.137 – 6.130) < 0.001* 88.498 (53.142 – 146.385) < 0.001*
HTN 3.968 (2.904 – 5.421) < 0.001* 41.060 (26.257 – 64.744) < 0.001*
Age 1.116 (1.103 – 1.128) < 0.001* 1.346 (1.310 – 1.382) < 0.001*
DM 5.420 (4.278 – 6.867) < 0.001* 48.862 (26.396 – 89.146) < 0.001*
Stroke related diseases 5.226 (4.499 – 6.071) < 0.001* 18.057 (9.689 – 51.263) < 0.001*
CHF: congestive heart failure, DM: diabetes mellitus, E/E′: the ratio of early diastolic mitral inflow velocity to early diastolic velocity of the mitral annulus, HTN:
hypertension, LADAP: left atrial diameter in AP, LAVI: left atrial volume index, LVEDD: left ventricular end diastolic dimension, LVEF: ejection fraction, LVESD: left ventricular end systolic dimension, LVH: left ventricular hypertrophy, defined as left ventricular mass index > 115 for men and left ventricular mass index > 95 for women, Stroke related diseases: defined as a combination of stroke, thromboembolism, and transient ischemic attack.
*p < 0.05.
is possible that the traditional CHA2DS2-VASc scores may be an indirect indicator for stroke, which may be benefited by corresponding echocardiographic findings.
Higher CHA
2DS
2-VASc scores converge to LVH and diastolic dysfunction
Our data suggests that NVAF with increasing number of comorbidities (higher CHA2DS2-VASc scores) converge to a higher incidence of LVH and incremental diastolic dysfunction compared to lone NVAF (CHA2DS2-VASc = 0). This may be attributed to the higher proportion of CHF, HTN, female sex, higher age and DM that are proven to accompany LVH.11-16) Increased LV mass impairs the LV diastolic function and elevates the LV end-diastolic pressure (LVEDP) as shown in the increasing values of LVMI, LAVI and E/E′ in Table 2 and Figure 2. These data suggest that a higher number of clinical attributes favorable of stroke collectively result in impaired diastolic function but not systolic functions. This indicates that diastolic dysfunction and its secondary effect may play a central role in the occurrence of stroke.LA blood stasis and CHA
2DS
2-VASc scores
It is acknowledged that high CHA2DS2-VASc scores are associated with high risk of thromboembolism. This, however, has not been construed in terms of the heart structural/
functional change that favor the thromboembolus formation. AF exhibits blood stasis as a key feature of the Virchow's triad for thrombus formation.4) A widely accepted key mechanism behind this is the LA appendage (LAA) blood stasis.17-19) Ha et al.18) suggested that pressure overload, but not volume overload, of the LA prompts blood stasis in the LAA thereby leading to spontaneous echocontrasts that predispose to thrombosis. E/E′ is an independent predictor for stroke in patients with AF.20) Elevated LAVI caused by NVAF also contribute to poor cardiovascular outcomes.21) These interesting findings confer clinical significance to our data that high CHA2DS2-VASc scores result in diastolic dysfunction that ultimately leads to LA pressure overload which in turn results in a prothombotic state. In short, high CHA2DS2-VASc scores may represent thrombogenic propensity due to high LA pressure.
Limitations
The clinical comorbidities of each patient was assessed based on ICD10 code search, which may potentially include over/underestimated diagnoses. We believe that the large sample size may correct for the alleged imprecise comorbidity data. The absence of information regarding concurrent medication may also bias the results, as angiotensin receptor blockers or angiotensin angiotensin-converting-enzyme inhibitors may hamper or regress the progression of LVH.22) Additionally, follow-up clinical outcome data, such as the incidences of AF, CHF, or mortality of each patient may have added authenticity to our findings, although this is beyond the scope of this paper.
Clinical implications
Our data show that NVAF patients with high CHA2DS2-VASc scores are associated with impaired diastolic function leading to LA pressure overload and eventually thromboembolus formation. Lowering LVEDP may therefore be a potential therapeutic target for NVAF patients with high CHA2DS2-VASc scores. As the traditional CHA2DS2-VASc scores simplify the NVAF patients, we suggest that our findings may also add predictive value to the risk stratification. Also, diastolic parameters suggestive of high LA pressure may be predictive of stroke independent of CHA2DS2-VASc scores. Further investigation is warranted to attribute the additive/independent values of echocardiographic parameters for stroke prediction and the effect of LVEDP control on the reduction of cardiogenic thromboembolic events in patients with high risk.
REFERENCES
1. Camm AJ, Kirchhof P, Lip GY, et al. Guidelines for the management of atrial fibrillation: the Task Force for the Management of Atrial Fibrillation of the European Society of Cardiology (ESC). Europace 2010;12:1360-420.
PUBMED | CROSSREF
2. Akar JG, Marieb MA. Atrial fibrillation and thrombogenesis: innocent bystander or guilty accomplice?
JACC Clin Electrophysiol 2015;1:218-9.
PUBMED | CROSSREF
3. Di Tullio MR, Sacco RL, Sciacca RR, Homma S. Left atrial size and the risk of ischemic stroke in an ethnically mixed population. Stroke 1999;30:2019-24.
PUBMED | CROSSREF
4. Watson T, Shantsila E, Lip GY. Mechanisms of thrombogenesis in atrial fibrillation: Virchow's triad revisited. Lancet 2009;373:155-66.
PUBMED | CROSSREF
5. Gupta DK, Giugliano RP, Ruff CT, et al. The prognostic significance of cardiac structure and function in atrial fibrillation: The ENGAGE AF-TIMI 48 Echocardiographic Substudy. J Am Soc Echocardiogr 2016;29:537-44.
PUBMED | CROSSREF
6. Olesen JB, Lip GY, Hansen ML, et al. Validation of risk stratification schemes for predicting stroke and thromboembolism in patients with atrial fibrillation: nationwide cohort study. BMJ 2011;342:d124.
PUBMED | CROSSREF
7. Nishimura RA, Otto CM, Bonow RO, et al. 2014 AHA/ACC guideline for the management of patients with valvular heart disease: executive summary: a report of the American College of Cardiology/American Heart Association Task Force on Practice Guidelines. J Am Coll Cardiol 2014;63:2438-88.
PUBMED | CROSSREF
8. Lang RM, Bierig M, Devereux RB, et al. Recommendations for chamber quantification: a report from the American Society of Echocardiography's Guidelines and Standards Committee and the Chamber Quantification Writing Group, developed in conjunction with the European Association of Echocardiography, a branch of the European Society of Cardiology. J Am Soc Echocardiogr 2005;18:1440-63.
PUBMED | CROSSREF
9. Cohn JN, Ferrari R, Sharpe N. Cardiac remodeling--concepts and clinical implications: a consensus paper from an international forum on cardiac remodeling. Behalf of an International Forum on Cardiac Remodeling. J Am Coll Cardiol 2000;35:569-82.
PUBMED | CROSSREF
10. Jia X, Levine GN, Birnbaum Y. The CHA2DS2-VASc score: Not as simple as it seems. Int J Cardiol 2018;257:92-6.
PUBMED | CROSSREF
11. Cuspidi C, Sala C, Negri F, Mancia G, Morganti A; Italian Society of Hypertension. Prevalence of left- ventricular hypertrophy in hypertension: an updated review of echocardiographic studies. J Hum Hypertens 2012;26:343-9.
PUBMED | CROSSREF
12. Eguchi K, Boden-Albala B, Jin Z, et al. Association between diabetes mellitus and left ventricular hypertrophy in a multiethnic population. Am J Cardiol 2008;101:1787-91.
PUBMED | CROSSREF
13. Proietti M, Marra AM, Tassone EJ, et al. Frequency of left ventricular hypertrophy in non-valvular atrial fibrillation. Am J Cardiol 2015;116:877-82.
PUBMED | CROSSREF
14. Lim HS, Willoughby SR, Schultz C, et al. Thrombogenic risk in patients with atrial fibrillation:
importance of comorbid conditions and intracardiac changes. JACC Clin Electrophysiol 2015;1:210-7.
PUBMED | CROSSREF
15. Buono F, Crispo S, Pagano G, et al. Determinants of left ventricular hypertrophy in patients with recent diagnosis of essential hypertension. J Hypertens 2014;32:166-73.
PUBMED | CROSSREF
16. Gerdts E, Izzo R, Mancusi C, et al. Left ventricular hypertrophy offsets the sex difference in cardiovascular risk (the Campania Salute Network). Int J Cardiol 2018;258:257-61.
PUBMED | CROSSREF
17. Goldman ME, Pearce LA, Hart RG, et al. Pathophysiologic correlates of thromboembolism in nonvalvular atrial fibrillation: I. Reduced flow velocity in the left atrial appendage (The Stroke Prevention in Atrial Fibrillation [SPAF-III] study). J Am Soc Echocardiogr 1999;12:1080-7.
PUBMED | CROSSREF
18. Ha JW, Lee BK, Kim HJ, et al. Assessment of left atrial appendage filling pattern by using intravenous administration of microbubbles: comparison between mitral stenosis and mitral regurgitation. J Am Soc Echocardiogr 2001;14:1100-6.
PUBMED | CROSSREF
19. Shively BK, Gelgand EA, Crawford MH. Regional left atrial stasis during atrial fibrillation and flutter:
determinants and relation to stroke. J Am Coll Cardiol 1996;27:1722-9.
PUBMED | CROSSREF
20. Schotten U, Verheule S, Kirchhof P, Goette A. Pathophysiological mechanisms of atrial fibrillation: a translational appraisal. Physiol Rev 2011;91:265-325.
PUBMED | CROSSREF
21. Kim H, Park YA, Choi SM, et al. Associates and prognosis of giant left atrium; single center experience. J Cardiovasc Ultrasound 2017;25:84-90.
PUBMED | CROSSREF
22. Okin PM, Wachtell K, Devereux RB, et al. Regression of electrocardiographic left ventricular
hypertrophy and decreased incidence of new-onset atrial fibrillation in patients with hypertension. JAMA 2006;296:1242-8.
PUBMED | CROSSREF