Author contributions: H.A.A.: study design, A.S.: completion of experi- ments and data analysis, A.A.: observation and design study.
This is an Open Access article distributed under the terms of the Creative Commons Attribution Non-Commercial License, which permits unrestricted non-commercial use, distribution, and reproduction in any medium, provided the original work is properly cited.
Copyright © Korean J Physiol Pharmacol, pISSN 1226-4512, eISSN 2093-3827
INTRODUCTION
The human brain is a very intricate system and several factors such as age and various diseases may affect its working [1]. Diabe- tes mellitus (DM) is a metabolic disease that can have worsening effects on many organs, including the brain. It adversely affects the central nervous system leading to cognitive impairments [2,3]. Although both diabetes types play a crucial role in memory weakening, their mode of action on memory and learning system remains unclear [4]. It is reported that factors such as improved apoptosis, reduced neuronal densities, metabolic impairments,
and oxidative stress are crucial in the pathogenesis of cognitive impairment and memory deficiency [5]. Several studies recom- mended a significant role of oxidative stress in the pathogenesis of cognitive impairment [6]. The long-term hyperglycemia enhances glucose oxidation, which sequentially produces reactive oxygen species (ROS) causing increased oxidative stress; this leads to morphological and functional changes in the hippocampus due to the excessive production of malanoldehyde (MDA) and re- duced efficacy of superoxide dismutase (SOD) [7]. Moreover, sev- eral evidences reported that dietary enrichment with nutritional antioxidants could improve the cognitive function not only in
Original Article
Effects of cinnamic acid on memory deficits and brain oxidative stress in streptozotocin-induced diabetic mice
Ali Asghar Hemmati 1 , Soheila Alboghobeish 2, *, and Akram Ahangarpour 3
1
Department of Pharmacology, School of Medicine, Ahvaz Jundishapur University of Medical Sciences, Ahvaz 61357-15794,
2Department of Pharmacology, School of Medicine, Student Research Committee of Ahvaz Jundishapur University of Medical Sciences, Ahvaz 61357-15794,
3Health Research Institute, Diabe- tes Research Center, Department of Physiology, Ahvaz Jundishapur University of Medical Sciences, Ahvaz 61357-15794, Iran
ARTICLE INFO Received April 16, 2017 Revised July 18, 2017 Accepted October 27, 2017
*Correspondence Soheila Alboghobeish
E-mail: [email protected] Key Words
Cinnamic acid Diabetes Memory Oxidative stress Streptozotocin
ABSTRACT The present study aimed to evaluate the cinnamic acid effect on memory
impairment, oxidative stress, and cholinergic dysfunction in streptozotocin (STZ)-in-
duced diabetic model in mice. In this experimental study, 48 male Naval Medical Re-
search Institute (NMRI) mice (30-35 g) were chosen and were randomly divided into
six groups: control, cinnamic acid (20 mg/kg day, i.p.), diabetic, and cinnamic acid-
treated diabetic (10, 20 and 40 mg/kg day, i.p.). Memory was impaired by administer-
ing an intraperitoneal STZ injection of 50 mg/kg. Cinnamic acid was injected for 40
days starting from the 21st day after confirming STZ-induced dementia to observe
its therapeutic effect. Memory function was assessed using cross-arm maze, morris
water maze and passive avoidance test. After the administration, biochemical param-
eters of oxidative stress and cholinergic function were estimated in the brain. Present
data indicated that inducing STZ caused significant memory impairment, whereas
administration of cinnamic acid caused significant and dose-dependent memory
improvement. Assessment of brain homogenates indicated cholinergic dysfunction,
increase in lipid peroxidation and reactive oxygen species (ROS) levels, and decrease
in glutathione (GSH), superoxide dismutase (SOD), and catalase (CAT) activities in the
diabetic group compared to the control animals, whereas cinnamic acid administra-
tion ameliorated these indices in the diabetic mice. The present study demonstrated
that cinnamic acid improves memory by reducing the oxidative stress and choliner-
gic dysfunction in the brain of diabetic mice.
normal subjects but also in cognitive deficits after stroke [8-11].
Although many antioxidants are available, we used a natural approach to suppress the oxidative stress in the brain. Cinnamon ( Cinnamomum cassia) is widely used for centuries as a natural spice and flavoring material throughout the world [12]. In some countries, it is used in traditional medicine as an antidiabetic agent. Cinnamon contains volatile oils such as cinnamaldehyde, eugenol, and cinnamic acid; phenolic compounds such as tannin, catechins, and proanthocyanidin; mono terpenes and sesquiter- penes; and trace coumarin [12-14]. Among these compounds, cinnamic acid and cinnamaldehyde form the major components of cinnamon aqueous extract. Moreover, it has been reported that in rats, cinnamaldehyde is partly metabolized into cinnamic acid in the stomach and small intestine, and is almost completely metabolized into cinnamic acid in the liver before it is absorbed into the blood [15]. Cinnamic acid moderates glycogenesis and gluconeogenesis and decreased blood glucose and glucose toler- ance in diabetic rats [16]. Additionally, cinnamic acid increases the insulin secretion in isolated islets [12]. Furthermore, several studies have reported other pharmacological properties of cin- namic acid, including hepatoprotective [17] and antioxidant activity [18-20]. Cinnamic acid reveals high antioxidant activity due to the presence of vinyl fragments. This property develops our interest in studying this compound as a potential drug for the management of pathologies associated with the lipid peroxidation in cellular membranes [21]. The present study was designed to determine the therapeutic effect of cinnamic acid on memory im- pairment in diabetic mice, in addition to reducing the previously observed diabetic symptoms. Therefore, we planned to examine the therapeutic effect of cinnamic acid on memory and cogni- tive impairment, oxidative stress, and cholinergic dysfunction in streptozotocin (STZ)-induced model of diabetes in male mice.
METHODS
Chemicals and drugs
Cinnamic acid (99% pure), 4-(2-Hydroxyethyl)-1-pipera- zineethanesulfonic acid) (HEPES), mannitol, ethylene glycol tetra acetic acid (EGTA), bovine serum albumin (BSA), 2,7-di chloro fluorescein diacetate (DCFH-DA), 3,4 3-(4,5-dimethylthiazol- 2-yl)-2, 5-diphenyltetrazolium bromide (MTT), Rhodamine 123, thiobarbituric acid, trichloroacetic acid, 1,1,3,3-tetramethoxy- propane, reduced glutathione, oxidized glutathione, Coomassie Brilliant Blue and STZ powder were purchased from Sigma- Aldrich (St Louis, Missouri, USA), and sucrose 5, 5’-dithiobis- 2-nitrobenzoic acid (DTNB), dimethyl sulfoxide (DMSO), NaCl, KCl, CaCl
2, MgCl
2and NaHCO
3were obtained from Merck com- pany (Darmstadt, Germany).
Animals
48 males Naval Medical Research Institute (NMRI) mice (30- 35 g) were obtained from the animal facility of Ahvaz Jundisha- pur University of Medical Science (AJUMS), which is completely qualified by AJUMS animal care guidelines with an ethics com- mittee grantee No. IR.AJUMS.REC.1396.261. After one week adaptation, the mice were housed eight per cage in polycarbonate cages with corncob bedding in 20±4°C temperature with a 12 h light/12 h dark cycle and 10% humidity.
Induction and assessment of diabetes
Animals were rendered diabetic by a single intraperitoneal STZ injection of 50 mg/kg. STZ was dissolved in 0.05 M citrate buffer at pH 4.5, immediately before administration. The control mice (n=8) were injected with citrate buffer alone. Blood glucose levels were evaluated using a glucometer (ACON Laboratories, Inc., USA) 72 h later. The mice with glucose levels higher than 220 mg/
dl were considered as diabetic. Accordingly, the animals exposed to chronic hyperglycemia revealed obvious pathological changes in the central nerve structure and function, three weeks after STZ injection; the blood glucose level was again determined and mice with final blood glucose levels above 220 mg/dl were considered diabetic [22].
The mice used in this study were randomly assigned into six groups:
(1) Control group (Con) (n=8); normal mice treated with saline, IP (physiological saline 0.1 ml/100 g), for 40 days
(2) Cinnamic group (cinn) (n=8); normal mice treated with cinnamic (20 mg/kg/day), for 40 days
(3) Control diabetic group (DM) (n=8); diabetic mice treated with saline, IP (physiological saline 0.1 ml/100 g), for 40 days
(4) DM+ cinnamic group1 (n=8); diabetic mice treated with cinnamic (10 mg/kg/day), for 40 days.
(5) DM+ cinnamic group2 (n=8); diabetic mice treated with cinnamic (20 mg/kg/day), for 40 days
(6) DM+ cinnamic group1 (n=8); diabetic mice treated with cinnamic (40 mg/kg/day), for 40 days
Behavioral training
Passive avoidance test: The step-down passive avoidance task
is used to evaluate the state-dependent learning and memory. The
apparatus consisted of a box made of Plexiglas with dimensions
of 40×30×30 cm with a floor of steel bars. Each of the steel bars
was 4 mm. in diameter with a spacing of 13 mm. A wooden plat-
form with dimensions of 4×4×4 cm at the bottom center of the
floor was provided. Electric shocks with a frequency of 1 Hz at 15
V for 15 s using a stimulator connected to the floor bars transmit-
ted a shock to the animals’ hands and feet. When the animal was
placed on the podium, the natural tendency of the animal was
to get down on the floor bars; however, if the animal received a shock its innate desire to get down from on the platform was sup- pressed, in particular, an inhibitory avoidance learning occurred.
The latency time of moving down from the safe podium (step- down latency) was considered as memory retrieval [23], which involved two stages, namely training and testing. In the training phase, animals were slowly placed on the wooden platform in the middle of the device and the delay in moving down from the platform was recorded by a chronometer. When the mouse stepped down from the platform and placed all its paws on the grid floor, intermittent electric shocks were delivered continu- ously for 15 s. Before the final shock, the animal was removed [24,25]. This training procedure was performed between 9:00 and 15:00 h, and animals with latencies longer than 30 s were omitted from the study. The test phase was conducted for 24 h after the training phase and was similar to the training phase; however, in this phase the animal did not receive any shock treatment. Thus, each animal was slowly placed on the wooden platform again and the delay in coming down from the platform was considered as a memory retrieval. In these experiments, the time limit for retain- ing the mouse on the podium was of maximum 300 s [23]. The retention test was also conducted between 9:00 and 15:00 h. At the end of each test, the surface of the apparatus was thoroughly cleaned to avoid the presence of olfactory cues [25].
Spatial navigation memory test: This test was performed us- ing cross-arm maze. The task was to test the navigation memory, which could be weakened by brain damage. This model was used to test the spatial navigation memory considering the spatial orientation and perception as described by Ragozzino et al. [26].
The maze was constructed of wood, painted gray, and comprised a central platform (25 cm diameter), which radiated four sym- metrical arms (55 cm long×10 cm wide) with 12 cm walls. Briefly, mice were placed individually in a four-arm cross maze and were allowed to transverse the maze freely for 12 min. The number and arrangement of entries were noted; an alternation was defined as an entry into four different arms on an overlapping quadruple set.
Four consecutive arm choices within the total set of arm choices made up a quadruple set. A quadruple set consisting of arm choices B, D, C, A comprised “actual alternation,” whereas the set with B, D, B, A did not (using this procedure, possible alternation sequences were equal to the number of total arm entries minus three). Percent alternation was calculated as follows:
Alternation %= Actual alternation×100 Possible alternation*
*Number of total arm entries – 3.
Alternation percentage is an indicator of spatial navigation memory of the experimental mice and the number of total arm entries is the index of the locomotor activity in this maze [22].
Morris water maze test: The device comprised a round con- tainer, 100 cm in diameter and 50 cm in depth. The tank was
filled with water (21-26°C) up to a height of 30 cm and the trans- parent escape platform made of Plexiglas (10 cm in diameter and 29 cm in height) was concealed at 1.5 cm under the surface of water at a fixed place. The water was turned milky with powdered nonfat milk or nontoxic white colored dye. The platform was not observable from just above the water level and removal trials have designated that escape on to the platform was not done by visual or other proximal signs [27,28]. The period spent by the animal to reach the concealed platform was used as the memory index. Be- fore the test commencement, the mice were adapted to the maze location. The water maze test was conducted for all mice groups on 10th, 20th, 30th, and 40th days for all animals (n=5). For each trial, the time required (in seconds) for an individual mouse to find the concealed platform was recorded and the mean data from the tests were used for the statistical analyses.
Biochemical analysis
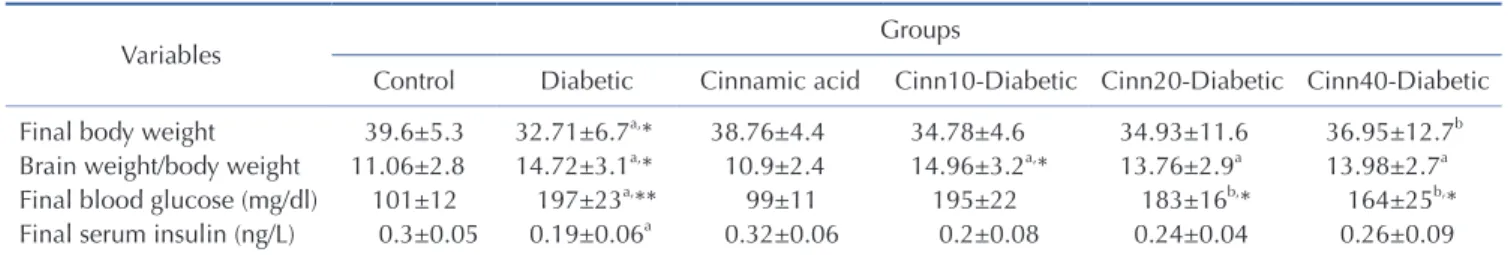
Determination of brain weight to body weight ratio: At the end of 40 days, the mice were decapitated under ether anesthesia.
The skull was cut open and the brain was exposed from its dorsal side. The whole brain was quickly removed and weighed. Then the ratio of brain weight to body weight was calculated for each animal [29].
Brain tissue preparation: The whole brain was quickly re- moved and cleaned with normal saline on the ice. A 10% (w/v) homogenate of brain samples (0.03 M sodium phosphate buf- fer, pH-7.4) was prepared by using an Ultra-Turrax T25 (USA) homogenizer at a speed of 9500 rpm. The homogenized tissue preparation was used to measure AChE, ROS, Catalase, MDA, GSH and nitrite.
Reactive oxygen species (ROS) level in tissues of brain: The level of ROS in brain tissue was measured using 2, 7-dichlorofluo- rescindiacetate (DCFDA) that converted into highly fluorescent DCF by cellular peroxides. Briefly, 10% brain homogenate were prepared in phosphate buffer 1 mM, pH 7.4. For each test 2 ml homogenate tissue was mixed with 40 ml of 1.25 mM DCFDA in methanol for ROS estimation. All samples were incubated for 15 min in a water bath at 37°C. Fluorescence was calculated using a fluorimeter, at 488 nm excitation and 525 nm emission wave- length [30].
Glutathione (GSH) in tissue of brain: Glutathione content was measured according to the method described by Thomas and Skrinska. Brain homogenates were incubated whit 1 ml of 20% trichloroacetic acid (TCA) and 1 ml EDTA 1mM for 5 min, which was used as protein precipitant. The total homogenate was centrifuged at 10,000 g for 30 min at 4°C. 200 µl of supernatant was mixed with 1.8 ml of 0.1 mM 5.5´-dithio-bis (2-nitro benzoic acid) (DTNB). The GSH reacts with DTNB and forms a yellow- colored complex with DTNB. The absorbance was read at 412 nm. The result was expressed as µmoles of GSH/mg protein [31].
Thiobarbituric acid reactive substances (TBARS) in tissue
of brain: The extent of lipid peroxidation in terms of malondi- aldehyde (MDA) formation was measured. Briefly homogenate brain sample containing 1 ml was mixed with 1 ml TCA (20%), 2 ml TBA (0.67%) and heated for 1 h in boiling water bath. After cooling, mixture centrifuged and absorbance of the superna- tant measured at 532 nm against suitable blank. The amount of TBARS was calculated by using a molar extinction coefficient of ε=1.56×10
5/M/cm and expressed as mol/mg protein [31].
Catalase (CAT) in tissue of brain: Catalase activity was as- sayed according to the method used by L.Goth. 500 µl of 0.05 mmol Tris-HCl, 1 ml H
2O
2and 50 µl of sample were mixed and incubated for 10 min, and then Reaction was stopped by adding 500 µl Ammonium molybdate solution 4%. The absorbance was read at 410 nm. The result was expressed as U/mg protein [32].
Superoxide dismutase (SOD) in tissue of brain: The SOD ac- tivity was determined using a xanthine/xanthine oxidase system for production of superoxide radical and subsequent measure- ment of cytochrome c as a scavenger of the radicals. Optical den- sity was evaluated using a spectrometer (UV- 1601, Shimadzu) at 550 nm. One unit of enzyme activity was defined as the quantity of SOD required to inhibit the reduction rate of cytochrome c by 50% [33]. SOD activity is presented as units per milligram of pro- tein (U/mg protein).
Estimation of brain total protein: Total brain protein was es- timated by the Lowry et al method using bovine serum albumin (BSA) (1 mg/ml) as standard. The absorption was read spectro- photometrically at 750 nm [34].
Nitrite estimation: Nitrite was estimated using Greiss reagent, which served as an indicator of nitric oxide production. An amount of 100 µL Greiss reagent (1:1 solution of 1% sulphanil- amide in 5% phosphoric acid and 0.1% napthaylamine diamine dihydrochloric acid in water) was added to 100 µL of supernatant and absorbance was measured at 542 nm [35]. Nitrite concentra- tion was calculated using a standard curve for sodium nitrite.
Nitrite levels were expressed as of the control percentage.
Estimation of brain acetyl cholinesterase (AChE) activity:
The whole brain AChE activity was measured by the Ellman method [36] and Voss and Sachsse method [37]. Change in the absorbance per min of the sample was read spectrophotometri- cally at 420 nm.
Blood glucose and serum insulin estimation: Twenty four hours after the last experimental day, the overnight fasting ani- mals were anesthetized by ether. Fasting blood glucose levels (FBG) were measured using a glucometer (Elegance CT-X10, Convergent Technologies, Germany) by cutting the tail tip of mice. Furthermore, blood samples were directly collected by car- diac puncture and centrifuged at 3500 rpm for 20 min. Insulin level was measured by ELISA assay kits (Monobind, USA) (The sensitivity of hormone detection per assay tube was 0.182 µIU/ml).
Statistical analysis
Data were expressed as means±SE for three different experi- ments. All the results were analyzed using Graph Pad Prism (ver- sion 5.04). Statistical significance was determined using the one- way analysis of variance (ANOVA) with the Tukey’s post hoc test.
Statistical significance was set at p<0.05.
RESULTS
Effects of diabetes and cinnamic acid on state-dependent memory
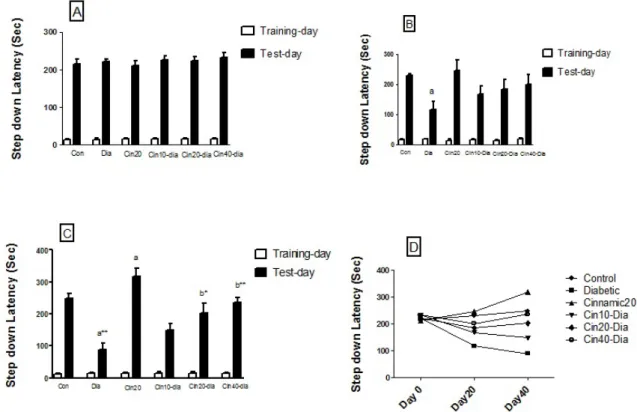
Step-down passive avoidance task assesses the ability of the animals to retain and recall information. The mean initial latency did not significantly differ among the various groups, whereas the retention latency significantly differed between the groups.
Fig. 1A-D represents comparisons of step-down latency in differ- ent groups before treatment and after 20 and 40 days. The results revealed that the step-down latency significantly decreased in di- abetic mice as compared to the controls after 20 (p<0.05) and 40 (p<0.01) days. Treatment of the diabetic mice with cinnamic acid caused significant (p<0.01, p<0.001) increase in the step-down latency compared to the diabetic group after 40 days. Cinnamic acid alone did not cause any significant change in the retention latency in the passive avoidance test before 20 days; however, the retention latency increased compared to control group (p<0.05) after 40 days (Fig. 1).
Effect of diabetes and cinnamic acid on spatial navigation memory
Fig. 2 represents the number of arm entries, as the locomotor activity index in cross-arm maze significantly (p<0.05) decreased in diabetic mice as compared to the controls. Treatment of dia- betic mice with cinnamic acid significantly (p<0.05) increased the locomotor activity in dose-dependent manner compared to the diabetic group. No significant increase was observed in the number of arm entries in mice injected with cinnamic acid alone when compared to the control animals.
Fig. 3 reveals the percent alternation in the cross-arm maze. Di-
abetes significantly decreased the actual alternation score, thereby
decreasing the alternation percentage and the spatial navigation
memory index in the cross-arm maze compared to the control
group (p<0.01), whereas administration of cinnamic acid signifi-
cantly (p<0.01) and in dose-dependent manner prevented the
spatial memory debilitation in diabetic mice. Moreover, cinnamic
acid injection significantly (p<0.05) increased the alternation per-
centage in intact animals compared to the control animals.
Effect of diabetes and cinnamic acid on spatial memory in morris water maze test
Our results on spatial memory abilities in mice revealed that, compared to the control mice, escape latency (time taken to reach the hidden platform) decreased from 130 to 80 s in cinnamic acid-treated mice, whereas in mice injected with STZ, the escape latency increased from 180 to 250 s throughout the total tenure of the test. One interesting observation on group IV mice treated
with STZ and concurrently administered with cinnamic acid was that, even though the escape latency was more (170 s) than that of the control mice at the initial stages, after 40 days, it almost reached the normal levels (130 s) (Fig. 4 ).
Fig. 2. Effect of diabetes and cinnamic acid on number of entries in the cross-arm maze in mice. Letter a: indicates significant difference compared to control group (p<0.05). Letter b: indicates significant dif- ference compared to diabetic group (p<0.05). p values were from one- way ANOVA, followed by Tukey’s test for multiple comparisons.
Fig. 3. Effect of diabetes and cinnamic acid on alternation percent in the cross-arm maze in mice. Letter a: indicates significant differ- ence compared to control group (p <0.05). Letter b: indicates significant difference compared to diabetic group (p <0.05). a* and b*: p<0.01. p values were from one-way ANOVA, followed by Tukey’s test for multiple comparisons.
Fig. 1. Effects of diabetes and cinnamic acid on memory retention in mice. (A) Step down latency before treat. (B) Step down latency after 20
days. (C) Step down latency after 40 days. Each value was presented as means±SEM (n=8). Letter a: Significantly different from control group (p<0.05),
Letter b: Significantly different from diabetic group (p<0.05), a* and b*: p< 0.01, a** and b**: p< 0.001. p values were from one-way ANOVA, followed
by Tukey’s test for multiple comparisons.
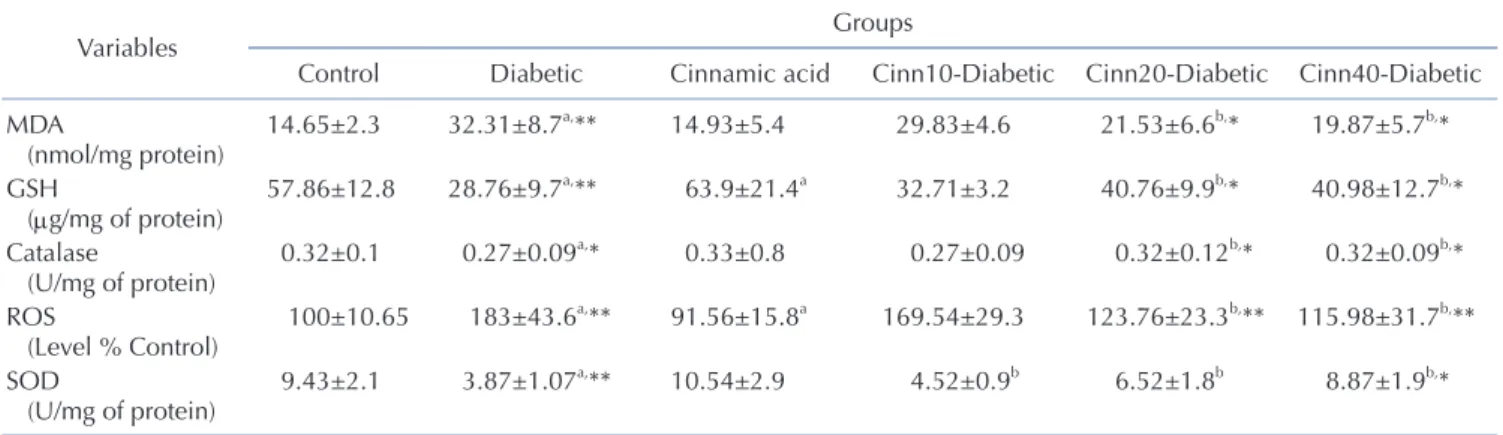
Effect of diabetics and cinnamic acid on oxidative stress in STZ treated mice
Effects on ROS formation in the brain tissue: Increased ROS formation is expressed as DCF fluorescence intensity unit. As mentioned in Table 1, ROS level was significantly (p<0.001) ele- vated in the brain of diabetic animals as compared to the control.
Cinnamic acid administration significantly (p<0.001) inhibited the ROS production in diabetic mice. Moreover, exposure to cin- namic acid resulted in significantly (p<0.05) lower ROS formation in nondiabetic mice when compared with the control (Table 1 ).
Effect on glutathione (GSH) level in the brain tissue: Gluta- thione assessment results reported a significant decrease in the diabetic group compared to the control mice (p<0.001). Cinnamic acid administration significantly (p<0.01) prevented this decrease in GSH level in diabetic mice. Moreover, exposure to cinnamic acid resulted in significantly (p<0.05) greater GSH level in nondi- abetic mice when compared with the control mice (p<0.05) (Table 1). Effects on thiobarbituric acid reactive substances (TBARS) in the brain tissue: The results of lipid peroxidation revealed that STZ treated group reported significant increase in the MDA level (p<0.001) in comparison to the control group. Cinnamic acid
administration significantly (p<0.01) inhibited the MDA level in diabetic mice. No significant difference was observed between cinnamic acid-treated mice and control group (Table 1 ).
Effects on catalase enzyme level in the brain tissue: Assess- ment of brain homogenates indicated a significant (p<0.01) de- crease in the CAT activities in diabetic group than the control an- imals, while cinnamic acid administration significantly (p<0.01) ameliorated these indices in diabetic mice. No significant differ- ence was observed between the cinnamic acid-treated mice and the control group (Table 1 ).
Effect on SOD activity in the brain tissue: As shown in Table 1, the SOD production was significantly reduced in brains of the STZ treated mice (p<0.001). Administration of cinnamic acid significantly increased the SOD activity in the brain, when com- pared with the STZ‐treated group (p<0.01).
Effect of cinnamic acid on STZ induced nitrosative stress
Nitrite levels were significantly (p<0.05) elevated in the brain of
Fig. 4. Effect of diabetes and cinnamic acid on spatial memory in morris water maze test. p values were from one-way ANOVA, followed by Tukey’s test for multiple comparisons.
Table 1. Effect of diabetics and cinnamic acid on oxidative stress in STZ treated mice
Variables Groups
Control Diabetic Cinnamic acid Cinn10-Diabetic Cinn20-Diabetic Cinn40-Diabetic MDA
(nmol/mg protein) 14.65±2.3 32.31±8.7
a,** 14.93±5.4 29.83±4.6 21.53±6.6
b,* 19.87±5.7
b,* GSH
(µg/mg of protein) 57.86±12.8 28.76±9.7
a,** 63.9±21.4
a32.71±3.2 40.76±9.9
b,* 40.98±12.7
b,* Catalase
(U/mg of protein) 0.32±0.1 0.27±0.09
a,* 0.33±0.8 0.27±0.09 0.32±0.12
b,* 0.32±0.09
b,* ROS
(Level % Control) 100±10.65 183±43.6
a,** 91.56±15.8
a169.54±29.3 123.76±23.3
b,** 115.98±31.7
b,**
SOD
(U/mg of protein) 9.43±2.1 3.87±1.07
a,** 10.54±2.9 4.52±0.9
b6.52±1.8
b8.87±1.9
b,* Data are Mean±SD; n=8. MDA, Malondialdehyde; ROS, reactive oxygen species; GSH, glutathione; SOD, superoxide dismutase.
a