307
"J. Korean Soc. Radiol., Vol. 9, No. 5, August 2015"
Artifacts Improvement by using the Echo Planar Imaging and
Pre-Saturation Pulse Band techniques of Reduced Field-Of-View in Breast Magnetic Resonance Imaging Examination
Jaeheun Lee, Hyunjin Kim*, Inchul Im**
Department of Radiology, Pusan National University Hospital
Department of Biomedical Health Science, Graduate School of Dongeui University *, Department of Radiological science, Dongeui University**
유방 자기공명영상검사에서 감소된 영상영역의
에코평면영상기법과 사전포화기법 사용에 의한 인공물 개선
이재흔, 김현진*, 임인철**
부산대학교병원 영상의학과, 동의대학교 대학원 보건의과학과*, 동의대학교 방사선학과**
Abstract
This study was conducted in reducing the involuntary motion artifacts because of lungs and heart movements as well as the aliasing artifacts generated during the use of the reduced-FOV EPI technique while performing breast MRI.
Performed on a total of 38 obesity female subjects who visited the clinic for pre-examination before surgery within the period from August 1 to November 30, 2014. The 3.0T MRI scanner equipped with a breast scanning coil. Qualitative and quantitative analyses were each used for the evaluation of the acquired images while an Paired T-test and Wilcoxon rank test were performed to check the statistical significance. The variation ratio rose by 15.69% with the additional application of a pre-saturation pulse in the lesion, by 13.72% near the lesion, and 20.63% in the fat and the contrast-to-noise ratio rose by 10.58% in and near the lesion and by 12.03% in the lesion and fat, respectively. there were increases of 22.05% and 21.42% at 0 and 1000 respectively in qulitative evaluation and growth of 16.10% in apparent diffusion coefficient. it showed a statistically significant result(p<0.05) in signal to noise ratio, contrast to noise ratio, diffusion slope coefficient and apparent diffusion coefficient. The involuntary movements artifacts that occur in the phase encoding direction and the aliasing artifacts are considered to be reduced to obtain the best image in the additional use of the pre-saturation pulse as DWI is acquired.
Key Words: Breast magnetic resonance imaging examination, Involuntary motion artifact, Aliasing artifact, Saturation pulse
요 약
유방 자기공명영상검사 시 확산강조영상에서 발생하는 심장과 폐에 의한 불수의적 움직임 인공물과 감소된 영상영 역 에코평면영상기법으로 발생하는 둘러겹침 인공물을 추가적인 사전포화기법을 사용하여 이를 저감화시키고자 하였 다. 2014년 08월 1일부터 11월 30일까지 여성 환자 38명을 대상으로 하였으며 사용 장비로는 유방 검사에 최적화된
http://dx.doi.org/10.7742/jksr.2015.9.5.307
Corresponding Author: Inchul Im E-mail:[email protected] Tel: +82-51-890-2678
3.0T와 유방 전용 코일을 사용하였다. 영상의 평가와 분석은 정량적, 정성적 분석을 하였으며 통계적 유의성은 Paired T-test와 Wilcoxon rank test를 하였다. 결과적으로 추가적인 사전포화펄스의 사용으로 정량적인 평가에서는 병변에서 15.69%, 병변 근접 부위에서 13.72%, 지방에서 20.63%의 증가를 보였으며, 대조도 대 잡음비의 경우는 병변과 병변 근 접 부위에서 10.58%, 병변과 지방 부위에서 12.03%의 증가로 나타났다. 정성적인 평가에서는 확산경사계수 0에서 22.05%, 1000에서 21.42%, 현성확산계수에서 16.10%의 증가로 나타났으며, 통계적 평가에서는 신호 대 잡음비와 대조 도 잡음비, 확산경사계수와 현성확산계수에서 모두 유의한 결과로 나타났다(p<0.05). 따라서 사전포화펄스의 추가적인 사용으로 유방 자기공명영상 검사에서 확산강조영상 획득 시 위상 부호화 방향으로 발생하는 불수의적 움직임 인공물 과 둘러겹침 인공물이 감소가 되어 최적의 영상을 얻을 수 있을 것으로 판단된다.
중심단어: 유방 자기공명영상검사, 불수의적 움직임 인공물, 둘러겹침 인공물, 사전포화펄스
I. INTRODUCTION
세계보건기구(World Health Organization, WHO)산하 국제 암연구소(International Agency for Research on Cancer, IARC)의 GLOBOCAN 2012에 의하면 여성에 있어서 유방암은 발병률(mobility rate of disease)과 사망 률(mortality rate of disease)이 각각 25.2%, 14.7%이고 유 방암의 발병률과 사망률이 점차 증가하고 있다고 보 고하였다[1]. 또한 2014년도 한국유방암학회(Korean Breast Cancer Society)보고에 의하면 유방암의 발생건수 가 2008년 10만 명당 38.9명에서 2012년 52.1명으로 급 격히 증가했다고 밝혔다. 연간 환자 발생률 역시 1996 년 3,801명에서 2011년 16,967명으로 15년 사이에 4배 나 늘었다. 또한 한국은 고소득 국가(미국, 서유럽, 일 본, 호주, 뉴질랜드)에 포함되어 암 발생률이 가장 높 은 국가들 중 하나로 분류된다. 특히 유방암은 10만명 당 52.1명이 발생한 반면 다른 아시아 국가인 일본 51.5명에 비해 높은 발생률을 보이기도 하였다. 이러한 유방암 발병 위험도의 증가에도 불구하고 우리나라의 유방암 사망률은 경제협력개발기구(Organization for Economic Cooperation and Development, OECD)국가들 중 최하위이다. 이는 적극적인 건강검진에 의한 조기 진단 비율상승과 표준화된 치료법으로 우리나라 유방 암 환자들에게 적극적으로 적용한 결과로 유방암 생 존율이 증가하고 있음을 짐작하게 한다[2]. 유방암의 진단에는 유방 엑스선 검사(mammography), 유방 초음 파 검사(sono), 절제 생검(excisional biopsy)을 이용한 조 직 검사, 자기공명영상검사(magnetic resonance imaging, MRI) 등이 이용되고 있다. 유방 자기공명영상검사의 경 우 검사시간이 길고 영상 수가 많으며 양성과 악성종괴
의 감별, 유방암환자의 수술 전 병기 결정, 수술 전 항암 요법에 대한 종양의 반응 평가, 유방 성형 여성의 평가에 사용이 되고 있으나 조영제의 부작용이 있는 경우 검사 를 시행하지 못하는 경우도 발생한다. 최근 유방 자기공 명검사에서 급속하게 널리 적용되고 있는 확산강조영 상(diffusion weighted image, DWI)은 세포 내·외 공간에 서 물 분자의 이동을 영상화하는 기법으로 병변이 있 을 때 신호 강도 변화를 조기에 진단할 수 있어 여러 부위 검사에 널리 활용되고 있다고 보고되고 있다[3-4]. 이런 물 분자의 확산 정도를 수치로 나타낸 것을 확산 경사계수(diffusion coefficient, DC)라 하며 이는 세포 기 질 변화를 조기에 진단할 수 있다고 보고하고 있다[5]. 하지만 확산강조영상 획득 시 해상력과 분해능을 고 려할 때 영상 영역(field of view, FOV)크기의 제한점과 엎드린 자세(prone position)의 불편함에서 발생하는 인 공물로 인하여 영상의 왜곡이 동반되어 영상 판독에 영향을 미친다는 보고[6-7]가 있었으며, 확산강조영상에 서 감소된 영상영역 에코평면영상기법(Reduced-FOV EPI)과 사전포화기법(pre-saturation pulse band)을 통해 서 허상 인공물(ghost artifact)과 움직임 인공물(motion artifact)을 개선한 연구[8-9]가 있었으며 또한 3.0T 심장 자기공명영상(heart MRI)검사에서 사전포화기법의 유 용성에 대한 우수한 연구가 있었다[10]. 이에 본 연구에 서는 유방 자기공명영상검사에서 인공물이 더욱 많이 발생하는 비만환자를 대상으로 확산강조영상에서 발 생하는 심장과 폐에 의한 불수의적 움직임 인공물 (involuntary movement artifact)과 감소된 영상영역 에코 평면영상기법으로 발생하는 둘러겹침 인공물을 추가 적인 사전포화기법을 사용함으로서 인공물을 저감화-- 시켜 영상의 질을 개선하고자 하였다.
"J. Korean Soc. Radiol., Vol. 9, No. 5, August 2015"
Ⅱ. MATERIAL AND METHOD
2.1 연구 대상
본 연구는 2014년 08월 1일부터 11월 30일까지 부산 소재 일개 P 대학교 병원을 내원하여 수술 전 유방 자 기공명영상검사를 의뢰 받은 비만 여성 환자 중 38명 을 대상으로 하였으며 평균 연령은 52.50±12.87세이었 다. 모든 대상자에게 본 연구의 목적을 상세하게 설명 한 후 검사 전 자발적 동의를 얻어 연구를 진행하였다.
또한 진정제 사용한 환자, 폐쇄공포증환자, 심장의 페 이스메이커, 달팽이관 임플란트, 금속 및 의료용 인공 삽입물(유방 보형물)을 가진 환자는 본 연구에서 제외 하였다.
2.2 연구 방법
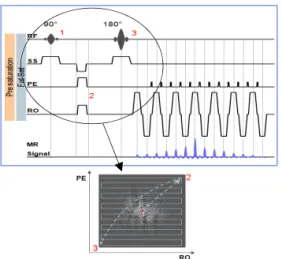
본 연구에 사용된 검사 장비는 유방 자기공명검사 에 최적화된 3.0T (Tim Trio; Siemens Medical solutions, Erlangen, Germany)와 고신호 강도를 획득하기 위한 유 방 전용 코일(8ch breast array coil, Tim Trio; Siemens Medical solutions, Erlangen, Germany)을 사용하였다. 검 사 전 엎드린 자세에서 오는 불편함과 움직임이 영상 에 미치는 영향에 대해서 사전교육을 시행한 후 연구 를 진행하였다. 우선 병변의 위치를 확인하기 위하여 T2-TSE-Sag-FS 검사(figure 3. a)를 하고 감소된 영상영 역 에코평면영상기법(Reduced-FOV EPI)에서 1개의 사 전포화펄스(1 saturation pulse band, S.P.B) 사용과 2개의 사전포화펄스(2 saturation pulse band, S.P.B) 사용을 연 이어 검사하였다. 검사에 사용된 영상 변수(table 1)와 사전포화펄스와 확산강조영상의 모식도(figure 1), 감소 된 영상영역 에코평면영상기법에 관한 내용(figure 2)은 아래와 같다.
Fig. 1. Diagram of spin-echo DWI sequence with pre-saturation pulse band and fat saturation.
FFT⟷
R. O
P.E
(a) FOV phase (%): 52.6 (b)
Fig. 2. Reduced-FOV: Reducing phase encoding steps. (a), (b): Reducing the number of phase
encoding direction, but keeping minimum and maximum amplitude. keeps resolution, but reduces
the FOV in phase encoding direction.
(a)
(b) (c)
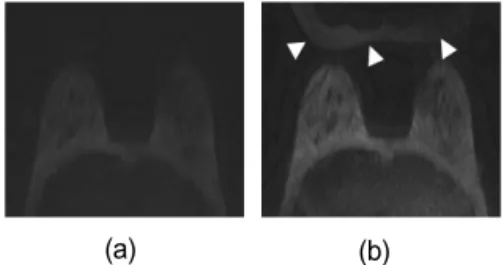
Fig. 3. Shows the T2-TSE-sag-SPAIR (a), scout axial with 1 saturation (b)
and scout axial images with 2 saturation pulse band (c).
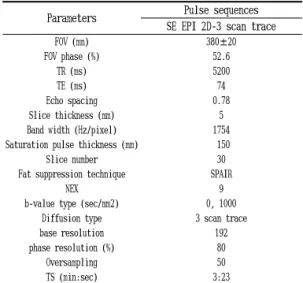
Table 1. The pulse sequences and scan parameters in the reduced-FOV and presaturation band.
Parameters Pulse sequences
SE EPI 2D-3 scan trace
FOV (mm) 380±20
FOV phase (%) 52.6
TR (ms) 5200
TE (ms) 74
Echo spacing 0.78
Slice thickness (mm) 5
Band width (Hz/pixel) 1754
Saturation pulse thickness (mm) 150
Slice number 30
Fat suppression technique SPAIR
NEX 9
b-value type (sec/mm2) 0, 1000
Diffusion type 3 scan trace
base resolution 192
phase resolution (%) 80
Oversampling 50
TS (min:sec) 3:23
TSE: turbo spin-echo, SPAIR: spectral attenuated inversion recovery.
또한 실험 전 중심 주파수 정렬(center frequency)이 우선 되었으며 확산강조영상의 사전포화펄스 위치를 정확하게 정하기 위하여 T2-TSE-Sag-FS 검사를 시행 하였다. 지방 소거가 잘 되지 않을 시 자장의 균일성 보정(volume shimming)을 통해서 검사를 진행하였다.
사전포화펄스의 매개 변수는 두께 150 mm이며 2개를 사용하였다(figure 4). 1 S.P.B는 심장과 폐를 사전포화 시켰으며, 2 S.P.B 일 경우 1 S.P.B와 겹침을 허용하여 등(back)부위를 완벽하게 포함할 수 있도록 사전포화 펄스를 조절하였다. 스핀에코 평면영상(spin-echo single-shot echo planar imaging)기법을 이용하여 확산경 사계수 b-value가 0 sec/mm2과 1000 sec/mm2 으로 하여 양쪽 유방의 축상면 영상 30개를 얻었다.
(b)
(a) 1 S. P. B 2 S. P. B
Fig. 4. This figure shows a diagram of a pre-saturation pulse band used in the test. (a) and (b) are slightly overlapping. (b)
is fully covered the back.
2.3 데이터 분석방법
정량적 분석(quantitative analysis)방법으로는 확산 강 조 영상에서 병변 부위(lesion), 병변 근접 부위(near lesion), 지방 조직(fat tissue)을 관심 영역(region of interest, ROI) 0.2 cm2로 하여 신호 대 잡음비, 대조도 대 잡음비를 구하고 평균화하였다. 관심 영역 설정 시 확산경사계수(diffusion coefficient, DC. b-value), 현성확 산계수(apparent diffusion coefficient, ADC), 운동곡선 (Kinetic curve)을 참고하여 병변의 위치를 정하였다.
신호 대 잡음비는 병변의 중앙 부위, 병변 근접 부 위, 지방 조직에서의 신호 강도(signal intensity, SI)값을 백그라운드의 표준 편차(standard deviation of background noise)의 신호강도 값으로 나누어 계산하였 으며 관계식은 수식(1)과 같이 정의한다.
··· (eq. 1)
대조도 대 잡음비는 배경 신호 잡음의 표준편차 측정 시 위상 부호화 방향(phase encoding direction)으로 영상 이외의 부분을 최대 환형으로 하여 측정하였으 며 관계식은 수식(2)과 같이 정의한다. 신호 강도와 배 경 신호 잡음 측정 시 신뢰성 향상을 위하여 3명의 전 문 방사선사가 동일 부위를 10회 반복 측정하여 불확 정도(uncertain type A)를 구하였다[11].
(eq. 2)
ROI=0.2 cm2
Fig. 5. Show the setting up the ROI area at b-value = 0 in DWI. black arrow-head indicated lesion, white-arrow indicated
near lesion, and curved white-arrow indicated fat area.
"J. Korean Soc. Radiol., Vol. 9, No. 5, August 2015"
정성적 분석은 유방 판독을 담당하는 영상의학과 전문의 2명, 전공의 1명과 15년 이상 근무한 전문 방 사선사 2명이 영상을 평가하였다.
2.4 통계적 분석방법
통계적 분석은 SPSS for Windows Ver. 22 (SPSS Inc., Chicago, and IL, USA)를 사용하였으며 정량적 분석은 Paired T-test를 사용하였고 정성적 분석은 우선순위 부 호화 검정(Wilcoxon rank test)을 이용하여 통계적 유의 성을 검증하였다.
Ⅲ. RESULT 3.1 정량적 분석결과
Table 2. Result of quantitative evaluation of normals and lesion area at b-value = 0 in DWI. (n = 38)
M SNR (1 saturation pulse band)
Lesion Near lesion Fat tissue
b = 0 226.39±124.29 160.75±103.71 19.34±13.02 M: measurement, b = 0: b-value = 0
Table 3. Result of quantitative evaluation of normals and lesion area at b-value = 0 in DWI. (n = 38)
M SNR (2 saturation pulse band)
Lesion Near lesion Fat tissue
b = 0 261.93±127.59 182.82±114.80 23.33±14.52
Table 4. Result of quantitative evaluation of normals and lesion area in DWI. (n = 38) M
CNR (1 saturation pulse band) standard of lesion
Lesion-Near lesion Lesion-fat
b = 0 71.55±81.30 212.96±113.91
Table 5. Result of quantitative evaluation of normals and lesion area in DWI. (n = 38) M
CNR (2 saturation pulse band) standard of lesion
Lesion-Near lesion Lesion-Fat
b = 0 79.12±87.03 238.59±121.84
정량적 분석의 경우 1 S.P.B에서 신호 대 잡음비는 병변 부위에서 226.39±124.29, 병변 근접 부위에서 160.75±103.71, 지방에서 19.34±13.02로 나타났으며, 대 조도 대 잡음비의 경우는 병변을 기준으로 하였을 때 병변과 병변 근접 부위는 71.55±81.30, 병변과 지방은 212.96±113.91로 나타났다. 2 S.P.B에서 신호 대 잡음비 는 병변 부위에서 261.93±127.59, 병변 근접 부위에서 182.82±114.80, 지방에서 23.32±14.52, 대조도 대 잡음비 는 병변을 기준으로 병변과 병변 근접 부위는 79.12±87.03, 병변과 지방은 238.59±121.84로 나타났다.
사전포화펄스의 추가적인 사용으로 병변에서 15.69%, 병변 근접 부위에서 13.72%, 지방에서 20.63%의 증가 를 보였으며, 대조도 대 잡음비의 경우는 병변과 병변 근접 부위의 경우 10.58%, 병변과 지방 부위의 경우 12.03%의 증가로 나타났다.
3.2 정성적 분석결과
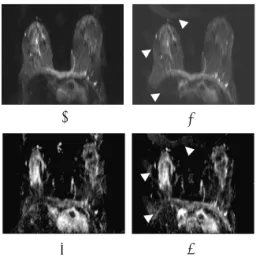
(a) (b)
Fig. 6. Comparison between 2 saturation (a) and 1 saturation pulse band of diffusion-weighted image (b) of the breast MRI (at b-value = 0). aliasing artifact (white arrowhead) resulted
from reduced-FOV.
(a) (b)
Fig. 7. Comparison between 2 saturation (a) and 1 saturation pulse band of diffusion-weighted image (b) of the breast MRI (at b-value = 1000). to avoid aliasing, spins are saturated before the acquisition of segment by the use of a spatially
selective RF pulse.
(b) (a)
Fig. 8. Comparison between 2 saturation (a) and 1 saturation pulse band of diffusion-weighted image (b) of the breast MRI
(at ADC mapping image).
(a) (b)
(c) (d)
Fig. 9. Comparison between 2 saturation (a), (c) and 1 saturation pulse band of diffusion-weighted image (b), (d) of
the breast MRI (at b-value = 0 and ADC mapping).
respiration artifact (white-arrowhead) resulted from reduced-FOV and patient's movement.
Table 6. Result of qualitative analysis of normal and lesion area in DWI and ADC. (n = 38)
1 S.P.B (Avg.±S.D)
2 S.P.B (Avg.±S.D)
b-value = 0 2.63±0.59 3.21±0.60
b-value = 1000 2.52±0.64 3.06±0.66
ADC 2.67±0.55 3.10±0.53
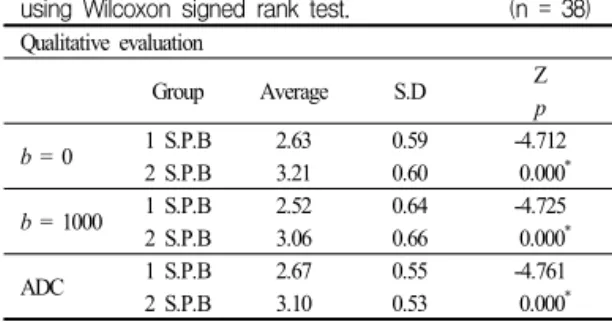
정성적 분석의 경우 확산경사계수 0에서 사전 포화 펄스를 1개 사용할 경우(1 saturation pulse band, S.P.B) 는 2.63±0.59, 2 S.P.B의 경우 3.21±0.60, 확산경사계수 1000에서 1 S.P.B의 경우는 2.52±0.64, 2 S.P.B는 3.06±0.66, 현성확산계수에서 1 S.P.B에서는 2.67±0.55, 2 S.P.B에서는 3.10±0.53으로 나타났다. figure 6-8에서
보듯이 사전포화의 추가적인 적용으로 둘러겹침 인공 물이 저감화되어 나타났으며 확산경사계수 0에서 변 화율이 22.05%, 1000에서 21.42%, 현성확산계수에서 16.10%의 증가로 나타났다.
Fig. 10. Results of the qualitative evaluation. Comparison between 1 and 2 saturation band images at b value 0, 1000,
and ADC mapping of diffusion-weighted image of the breast MRI. we can see that 2 saturation pulse band received a
better score than 1 saturation pulse band.
3.3. 통계적 분석결과
Table 7. Results of quantitative statistical analysis of signal to noise ratio. (n = 38) SNR
Group Average S.D t
p ROI1
1 S.P.B 226.39 124.29 -5.155
2 S.P.B 261.92 127.59 0.000*
ROI2
1 S.P.B 160.75 103.71 -6.580
2 S.P.B 182.82 114.80 0.000*
ROI3
1 S.P.B 19.34 13.02 -5.854
2 S.P.B 23.33 14.52 0.000*
*Statiscally significant difference between the lesion (ROI1), near lesion (ROI2), and fat area (ROI3).
Table 8. Results of qualitative statistical analysis of contrast to noise ratio by using Paired T-test. (n = 38) CNR
Group Average S.D t
p
L-N.L 1 S.P.B 71.55 81.30 -2.728
2 S.P.B 79.12 87.03 0.000*
L-Fat 1 S.P.B 212.96 113.91 -6.058
2 S.P.B 238.59 121.84 0.000*
*Statiscally significant difference between CNRlesion-near lesion and CNRlesion-fat
"J. Korean Soc. Radiol., Vol. 9, No. 5, August 2015"
정량적 분석인 신호 대 잡음비와 대조도 잡음비의 통계적 분석결과는 3부위 관심영역에서 모두 유의한 결과로 나타났다(p<0.05).
Table 9. Results of qualitative statistical analysis by using Wilcoxon signed rank test. (n = 38) Qualitative evaluation
Group Average S.D Z
p
b = 0 1 S.P.B 2.63 0.59 -4.712
2 S.P.B 3.21 0.60 0.000*
b = 1000 1 S.P.B 2.52 0.64 -4.725
2 S.P.B 3.06 0.66 0.000*
ADC 1 S.P.B 2.67 0.55 -4.761
2 S.P.B 3.10 0.53 0.000*
*Statiscally significant difference between b = 0, b = 1000, and ADC mapping.
또한 정성적 분석 결과의 통계적 분석결과도 확산 경사계수(b-value = 0, 1000)와 현성확산계수에서 1 S.P.B 와 2 S.P.B 양쪽 모두 유의한 결과로 나타났다 (p<0.05).
Ⅳ. DISCUSSION
감소된 영상영역 에코평면영상기법은 허상 인공물 을 유발할 수 있는 부위를 관심영역에서 제외시킬 수 있는 역할을 해주며 이로 인하여 발생하는 둘러 겹침 인공물을 사전포화펄스와 과다표집(oversampling)을 통 해서 제거시킬 수 있다. 또한 심장 동기화(cardiac gating)를 필요로 하지 않으며 현재 고해상력의 확산텐 서영상(diffusion tensor imaging, DTI) 검사에 최적화되 어있는 시퀀스이다. 사전포화기법은 영상영역 이외의 부분에 대하여 둘러겹침 인공물을 방지하기 위하여 90° RF 펄스를 인가하기 전에 사전에 선택단면을 포화 시킴으로 불필요한 영상 획득을 억제하는 기법이다[9]. 하지만 본 연구에서 시도한 비만 환자의 경우 감소된 영상영역 에코평면영상기법에서 허상 인공물과 움직 임 인공물이 심하게 발생을 하였다. 2004년 국외 연구 보고에 의하면 연구 대상 208명의 유방 자기공명영상 검사에서 33%의 인공물이 발견되었다. 이때 적용된 펄스 시퀀스는 T1-TSE, T2-TSE, T2-TSE-FS 이며 연구 결과 발생된 인공물은 48.6%(101명)가 불수의적인 움 직임 인공물이며, 33.6%(70명)은 자장의 불균일성과 지
방 소거의 실패로 인한 인공물, 1.4%(3명)는 둘러겹침 인공물, 0.5%(1.04명)는 얼룩무늬 인공물(zebra stripe artifact)로 나타났다[12]. 위 연구의 결과와 같이 본 연구 에서도 심장과 폐에 의한 불수의적인 움직임 인공물 과 둘러겹침 인공물이 가장 많이 나타났다. 본 연구에 서는 감소된 영상영역 에코평면영상기법의 경우 사전 포화기법의 추가적인 사용으로 허상 인공물이 상당히 감소되어진 것으로 나타났다. 또한 감소된 영상영역 에코평면영상기법에 사전포화기법의 적용으로 기존 에코평면영상 시퀀스와 비교 시 공간 흡수율(specific absorption rate, SAR)측면에서 현재까지 특별한 문제가 없는 것으로 보고되었다[13]. 본 연구의 제한점으로는 첫째, 감소된 영상영역 에코평면영상기법에 사전포화 기법을 적용하지 않고 실험을 하지 않았다. 둘째, 사전 포화기법을 이중으로 완전히 겹쳐서 검사하지 않았다.
셋째, 비만 환자의 경우 검사에 제한이 있어 사전 교 육을 시행하여도 움직임 인공물 발생을 저감화 할 수 없었다. 넷째, 일부 환자의 경우 자장의 불균일성 보정 을 하여도 지방 소거가 완벽하게 이루어지지 않았으 며 코일의 한계로 유방의 형태가 왜곡되는 경우도 발 생하였다.
Ⅴ. CONCLUSION
결론적으로 정량적 분석 결과 신호 대 잡음비의 경 우 병변에서 15.69%, 병변 근접 부위에서 13.72%, 지 방에서 20.63% 증가로 나타났으며, 대조도 대 잡음비 는 병변과 병변 근접 부위의 경우 10.58%, 병변과 지 방 부위의 경우 12.03%의 증가로 나타났다. 정성적 분 석 결과에서도 확산경사계수 0에서 22.05%, 1000에서 21.42%, 현성확산계수에서는 16.10%의 증가로 나타났 다. 따라서 감소된 영상영역 에코평면영상기법과 사전 포화기법의 추가적인 적용으로 인공물이 감소됨을 알 수 있었다.
Reference
[1] http://globocan.iarc.fr/Default.aspx, Gswlobocan. 2012.
[2] Korean Breast Cancer Society, Breast Cancer white paper, p. 3, 2014.
[3] G.W. Talbers, "Diffusion-weighted MRI for evaluation of acute
[4] J.H Cho, H.J. Kim, I.S. Hong, H.K. Lee, "The quantitative analysis of Diffusion Weighted Imaging in Breast MRI", The Korean Society of Radiology, Vol. 5, No. 3, 2011.
[5] M.E. About-EI-Ghar, A. El-Assmy, H.F. Refaie, T. Ei-Diasty,
"Bladder cancer: diagnosis with diffusion-weightd MR imaging in patients with gross hematuria", Radiology, Vol. 251, No. 2, pp. 415-21, 2009.
[6] J.R. Teruel, A. Ostlie, D. Holland, et al., "Inhomogeneous static magnetic field-induced distortion correction applied to diffusion weighted MRI of the breast at 3T", Magnetic Resonance in Medicine, 2014.
[7] L.S. Arlinghaus, E.B. Welch, A.B. Chakravarthy, et al., "Motion correction in diffusion-weighted MRI of the breast at 3T", Journal of Magnetic Resonance Imaging, Vol. 33, No.5, pp.
1063-70, 2011.
[8] E. Ozhinsky, D.B. Vigneron, S.J. Nelson, “Improved spatial coverage for brain 3D PRESS MRSI by automatic placement of outer-volume suppression saturation bands”, Journal of Magnetic Resonance Imaging“, Vol. 33, No. 4, pp. 792-802, 2011.
[9] J.J. Wang, R. Deichmann, et al., “3D DTI-MRI using a reduced-FOV approach and saturation pulse”, Magnetic Resonance Medicine, Vol. 51, No. 4, pp. 853-7, 2004.
[10] D. Kim, O. Gonen, N. Oesingmann, et al., “Comparison of the effectiveness of saturation pulses in the heart at 3T”, Magnetic Resonance Medicine, Vol. 59, No. 1, pp. 209-15, 2008.
[11] M. Korun., M.P. Maver, B. Vodenik, “Interpretation of the peak areas in gamma-ray spectra that have a large relative uncertainty”, Applied Radiation Isotopes, Vol. 70, No. 6, pp.
999-1004, 2012.
[12] V. Fiaschetti, C.V. Pistolese, V. Funel, et al., “Breast MRI artifacts: evaluation and solutions in 630 consecutive patients”, Clinical Radiology, Vol. 68, No. 11, pp. 601-8, 2013.
[13] J.P. Felmlee, R.L. Ehman, “Spatial presaturation: a method for suppressing flow artifacts and improving depiction of vascular anatomy in MR imaging”, Radiology, Vol. 164, No. 2, pp.
559-64, 1987.