http://dx.doi.org/10.14316/pmp.2013.24.4.237
This work was supported by the fusion research program of Korea research council for industrial science and technology (B551179-12-08-00, Development of Convergent Radio Therapy Equipment with O-arm CT) funded by the Ministry of Trade, Industry&Energy (MOTIE, Korea).
Submitted November, 29, 2013, Accepted December, 9, 2013 Corresponding Author: Young-Nam Kang, Department of Radiation Oncology, Seoul St. Mary's Hospital, The Catholic University of Korea, 222 Banpo-daero, Seocho-gu, Seoul 137-701, Korea
Tel: 02)2258-1515, Fax: 02)2258-1532 E-mail: [email protected]
The Feasibility Study of MRI-based Radiotherapy Treatment Planning Using Look Up Table
Shin-Wook Kim*, Hun-Joo Shin*, Young-Kyu Lee
†, Jae-Hyuk Seo
‡, Gi-Woong Lee
§, Hyeong-Wook Park
§, Jae-Choon Lee
§, Ae-Ran Kim
∥, Ji-Na Kim
∥, Myong-Ho Kim*,
Chul-Seung Kay*, Hong-Seok Jang
†, Young-Nam Kang
†Department of Radiation Oncology, *Incheon St. Mary's Hospital, The Catholic University of Korea School of Medicine, Incheon, †Seoul St. Mary's Hospital, The Catholic University of Korea School of Medicine, Seoul, ‡Bucheon St. Mary's Hospital, The Catholic University of Korea School of Medicine, Bucheon,
§Department of Medical Physics, Kyonggi University of Korea, School of Medicine, Suwon, ∥Department of Bio Medical Engineering, The Catholic University of Korea School of Medicine, Seoul, Korea
In the intracranial regions, an accurate delineation of the target volume has been difficult with only the CT data due to poor soft tissue contrast of CT images. Therefore, the magnetic resonance images (MRI) for the delineation of the target volumes were widely used. To calculate dose distributions with MRI-based RTP, the electron density (ED) mapping concept from the diagnostic CT images and the pseudo CT concept from the MRI were introduced.
In this study, the look up table (LUT) from the fifteen patients’ diagnostic brain MRI images was created to verify the feasibility of MRI-based RTP. The dose distributions from the MRI-based calculations were compared to the original CT-based calculation. One MRI set has ED information from LUT ( lMRI). Another set was generated with voxel values assigned with a homogeneous density of water (wMRI). A simple plan with a single anterior 6MV one portal was applied to the CT, lMRI, and w MRI. Depending on the patient’s target geometry for the 3D conformal plan, 6MV photon beams and from two to five gantry portals were used. The differences of the dose distribution and DVH between the lMRI based and CT-based plan were smaller than the wMRI-based plan.
The dose difference of wMRI vs. lMRI was measured as 91 cGy vs. 57 cGy at maximum dose, 74 cGt vs. 42 cGy at mean dose, and 94 cGy vs. 53 at minimum dose. The differences of maximum dose, minimum dose, and mean dose of the wMRI-based plan were lower than the lMRI-based plan, because the air cavity was not calculated in the wMRI-based plan. These results prove the feasibility of the lMRI-based planning for brain tumor radiation therapy.
Key Words: MRI-based RTP, Look up table, Electron density
INTRODUCTION
Computed tomography (CT) has been the basis for the radi- ation treatment planning (RTP) because of its direct connection to the electron density (ED).
1)However, in the intracranial re-
gions, an accurate delineation of the target volume has been
difficult with only the CT data due to poor soft tissue contrast
of CT images. Therefore, the magnetic resonance images
(MRI) for the delineation of the target volumes were widely
used.
2)The most common RTP procedure consists of an image
fusion with MRI and CT image for the calculation of dose
distribution. Currently, an MRI and CT image fusion for dose
calculation is the standard for brain tumor, prostate cancer, and
spine tumor.
3)Some authors, however, refer to the additional
uncertainty which was occurred from the registrations between
CT and MRI.
4)The error introduced from the registration will
systematically affect the radiation therapy throughout the entire
treatment period. In order to calculate dose distribution with
Fig. 1. The OARs are contoured on the magnetic resonance images (MRI) in order to define the gray scales; (a) The brain soft tissue, (b) Eyeball, (c) Nasal cavity, and (d) Bone.
MRI-based RTP, other authors introduced the ED mapping concept from the diagnostic CT images and the pseudo CT concept from the MRI.
5,6)The ED mapping concept showed very close difference of dose distributions with the CT-based RTP as less than 2% dosimetric errors. And Pseudo-CT con- cept proved the feasibility of MR-baed RTP, for instance gen- eration of DRRs from MRI. Because the ED mapping concept has still dependence with the CT images, the look up table (LUT) from the fifteen patients’ diagnostic brain MRI images was created to verify the feasibility of MRI-based RTP. The aim of this study was therefore to compare MRI-based calcu- lations and original CT-based calculation on the basis of dose distributions.
MATERIAL AND METHODS
1. Data acquisitions for manufacturing look up table (LUT)
We collected fifteen patients’ brain MRI image and meas- ured gray scale of brain soft tissue, eyeball, nasal cavity and bone using the Image J (freeware, http://rsbweb.nih.gov/ij/).
The ED and major components were big differences at brain soft tissue, eyeball, nasal cavity and bone. The MRI images were acquired on an MRI (Skyra 3T, Simens, Germany) by
TE 2.5 ms, and TR 250 ms FOV 220×220, pixel size 320×
320 and not used contrast medium. Fig. 1 shows the brain MRI image and chosen region of interest (ROI).
2. Treatment planning using MRI-based and CT based We used the MRI data from fifteen brain tumor patients.
The CT data were acquired from a CT simulator (Light speed 16, GE, USA) with a 480 mm FOV, matrix 512×512 (pixel resolution 0.94 mm), and 2.5 mm thickness. The MRI data were acquired on a Skyra 3T MR. The image acquired con- dition was like a manufacturing LUT. We used two MRI im- age sets for treatment planning. One MRI set has the ED in- formation from LUT (lMRI). Another set was generated with voxel values assigned with a homogeneous density of water (wMRI). The clinical target volume (CTV) and the OARs (i.e.
eyes, eye lenses, optic nerves, optic chiasm, pituitary gland and brain stem) were contoured by one radiation oncologist in the CT enhancement image and T1-weighted uncorrected data- sets using the typical contouring tools available in RTPs (Core plan, SCNJ, Korea). Three dimensional uniform margins of 5 mm were added to the CTV in order to generate the planning target volume (PTV).
The RTPs version was used for the study, which is capable of performing dose calculation in a MRI. We inserted LUT in RTPs and adapted to MRI.
The MRI-based plans were generated, only for plan compar- ison, using the same planning parameters as for CT-based planning in terms of the prescribed dose, fractions, beam en- ergy, and beam angles. A simple plan with a single anterior 6MV 10 cm×10 cm one portal was applied to the CT, lMRI, and wMRI. We used 6 MV photon beams and a two to five gantry portal depending on the patient’s target geometry for 3D conformal plan.
3. CT-based and MRI-based planning comparison
We evaluated the proposed MRI-based treatment planning
procedure using 3T MR clinical studies to compare MR and
CT-based treatment plans in terms of the OARs, including op-
tic nerve, lens, brain stem, eyeball, and PTV. To compare the
plans we used isodose distributions, dose volume histograms
(DVHs) and several PTV dosimetric parameters, i.e. the dose
at the isocenter dose (D
iso), mean target dose (D
mean), minimum
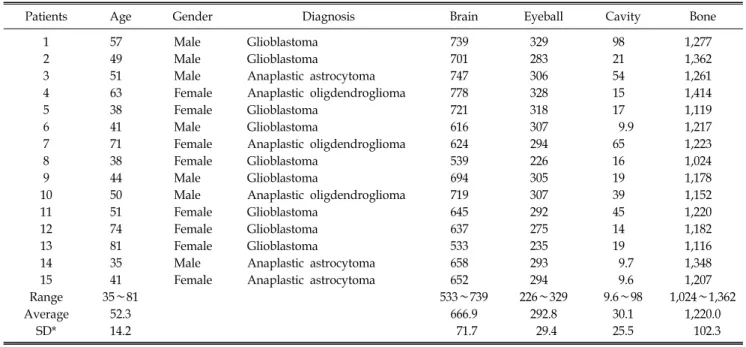
Table 1. General patients’ information and patients’ gray scale data at OARs.
Patients Age Gender Diagnosis Brain Eyeball Cavity Bone
1 57 Male Glioblastoma 739 329 98 1,277
2 49 Male Glioblastoma 701 283 21 1,362
3 51 Male Anaplastic astrocytoma 747 306 54 1,261
4 63 Female Anaplastic oligdendroglioma 778 328 15 1,414
5 38 Female Glioblastoma 721 318 17 1,119
6 41 Male Glioblastoma 616 307 9.9 1,217
7 71 Female Anaplastic oligdendroglioma 624 294 65 1,223
8 38 Female Glioblastoma 539 226 16 1,024
9 44 Male Glioblastoma 694 305 19 1,178
10 50 Male Anaplastic oligdendroglioma 719 307 39 1,152
11 51 Female Glioblastoma 645 292 45 1,220
12 74 Female Glioblastoma 637 275 14 1,182
13 81 Female Glioblastoma 533 235 19 1,116
14 35 Male Anaplastic astrocytoma 658 293 9.7 1,348
15 41 Female Anaplastic astrocytoma 652 294 9.6 1,207
Range 35∼81 533∼739 226∼329 9.6∼98 1,024∼1,362
Average 52.3 666.9 292.8 30.1 1,220.0
SD* 14.2 71.7 29.4 25.5 102.3
*Standard deviation.
Fig. 2. Gray scales of MRI are converted to the CT density via the look up table (LUT).
target dose (D
min) and maximum target dose (D
max).
RESULTS
1. Data for manufacturing look up table (LUT)
Table 1 shows the gray scales of the fifteen patients’ OARs.
The gray scale range is 533∼739 (brain soft tissue), 226∼329 (eyeball), 9.6∼98 (nasal cavity), and 1024∼1414 (bone). Fig.
2 shows the converted gray scale to CT density data.
2. CT-based and MRI-based planning comparison Fig. 3 shows the isodose dose distributions of the 10 cm×
10 cm one portal plan generated based CT, lMRI and wMRI.
Fig. 4 is the comparison of brainstem DVH for CT and MR based radiation therapy plans. The difference in dose dis- tribution and DVH between lMRI-based and CT-based plan was smaller than a wMRI-based plan. The maximum dose of the wMRI-based plan was lower than the lMRI-based plan.
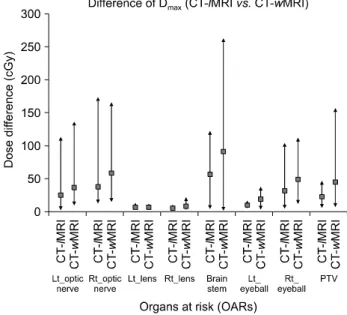
Fig. 5 shows the 15 patients average maximum dose differ- ence between wMRI and lMRI based plans. The reference dose was the CT-based plans. The maximum dose difference between lMRI-based plans and CT-based plans were smaller than the wMRI-based plans and CT-based plans. The biggest
difference of the maximum dose was the brain stem dose.
There was 91 cGy dose difference between wMRI-based plans and CT-based plans. But there was a 57 cGy dose difference between lMRI based-plans and CT-based plans.
Fig. 6 shows the 15 patient averages mean dose difference
between wMRI and lMRI based plans. The reference dose was
the CT-based plans. The mean dose difference between
lMRI-based plans and CT-based plans was smaller than
Fig. 3. Dose distributions are shown on the CT image and MR images (a) CT-based isodose curve, (b) lMRI-based isodose curve, and (c) wMRI-based isodose curve.
Fig. 4. The CT and MR based radiation therapy plans were compared with the DVH of brainstem.
Fig. 5. 15 patients average maximum dose difference between wMRI and lMRI based plans. The reference dose were CT-based plans.
wMRI-based plans and CT-based plans. The biggest difference of the mean dose was the PTV dose. The dose difference was 74 cGy between wMRI-based plans and CT-based plans. But the dose difference was 42 cGy between lMRI-based plans and CT-based plans.
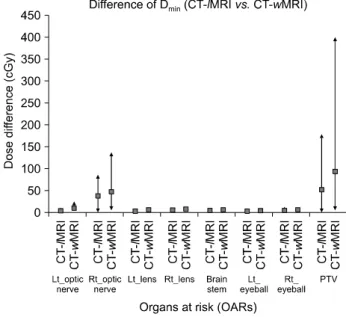
Fig. 7 shows the 15 patient averages minimum dose differ- ence between wMRI and lMRI based plans. The reference dose is the CT based plans. The minimum dose difference be- tween lMRI-based plans and CT-based plans was smaller than wMRI-based plans and CT-based plans. The biggest difference of minimum dose is the PTV dose. The dose difference was 94 cGy between wMRI-based plans and CT based plans. The
dose difference was at 53 cGy between wMRI-based plans and CT-based plans.
DISCUSSION AND CONCLUSION
We developed RTP for MRI-based planning for this study.
To ensure the dose calculation accuracy of MRI-based plan-
ning, 15 patients’ brain MRI images were obtained and meas-
Fig. 6. 15 patients average mean dose difference between wMRI and lMRI based plans. The reference dose were CT-based plans.
Fig. 7. 15 patients average minimum dose difference between wMRI and lMRI based plans. The reference dose were CT-based plans.
ured the gray scale of the brain tissue, nasal cavity, bone and eyeball. Fig. 3 and Fig. 4 show that the lMRI-based plan was a little bit different to the wMRI-based plan. The wMRI-based plan did not calculate the air cavity and calculate it as the same density with water. The isodose curve of the CT-based plan was differ than a MRI-based plan, because of the air cavity. Fig. 5, Fig. 6 and Fig. 7 shows the dose difference be- tween the CT-based plan and MRI-based plans. The dose dif- ference of lMRI-based plans was smaller than the wMRI-based plans at all OARs and PTV. The dose difference at the optic nerve, brain stem, and PTV was bigger than the lens and eyeball. This is because the optic nerve brain stem and PTV were located in a nearby air cavity. When the radiation beam passed through the air cavity or OAR located in a nearby air cavity, the dose difference was larger than in the tissue.
As a result, lMRI-based plans were superior to the wMRI- based plans at all OARs and PTV. Therefore, the feasibility of the lMRI-based planning was proved in the case of brain tumor radiation therapy. If there are adequate additional studies are per- formed, the accuracy of MRI-based plans would be improved.
Future studies are needed for more accurate MRI-based plan. Abundant patients’ MR images should be obtained to measure the gray scales of OARs and target volumes. More- over, more concerns about the inherent MR images’ distortion
and the obtained MR images’ deformation should be consid- ered in order to well compare to the CT-based plan. Various types of MR images, including T1-weighted, T2-weighted, and proton density scan, would be also measured and evaluated for the improved MR-based plan.
Furthermore, the comparison with the ED mapping methods would be one of the future studies. After that we can utilize the intensity modulated radiation therapy in intracranial regions with the less difference with CT-based plan.
REFERENCES
1. Jonsson JH, Karlsson MG, Karlsson M, Nyholm T:
Treatment planning using MRI data: an analysis of the dose cal- culation accuracy for different treatment regions. Radiat Oncol 5:62 (2010)
2. Prabhakar R, Julka PK, Ganesh T, Munshi A, Joshi RC, Rath G: Feasibility of using MRI alone for 3D radiation treatment planning in brain tumors. Jpn J Clin Oncol 37(6):405-411 (2007) 3. Stanescu T, Hans-Sonke J, Stavrev P, Fallone BG: 3T MR-based treatment planning for radiotherapy of brain lesions.
Radiat Oncol 40(2):125-132 (2006)
4. Chen L, Price RA Jr, Wang L, et al: MRI-based treatment planning for radiotherapy: dosimetric verification for prostate IMRT. Int J Radiat Oncol Biol Phys 60(2):636-647 (2004) 5. Wang C, Chao M, Lee L, Xing L: MRI-based treatment
planning with electron density information mapped from CT.
Look Up Table을 이용한 자기공명영상 기반 방사선 치료계획의 타당성 분석 연구
가톨릭대학교 의과대학 *인천성모병원, †서울성모병원, ‡부천성모병원 방사선종양학교실,
§경기대학교 의학물리학과, ∥가톨릭대학교 의과대학 의공학교실
김신욱*ㆍ신헌주*ㆍ이영규
†ㆍ서재혁
‡ㆍ이기웅
§ㆍ박형욱
§ㆍ이재춘
§김애란
∥ㆍ김지나
∥ㆍ김명호*ㆍ계철승*ㆍ장홍석
†ㆍ강영남
†뇌병변 등의 방사선 치료에 있어 CT (Computed Tomography) 영상만을 이용한 종양 체적(Tumor volume) 윤곽의 정확한 설정은 CT 영상의 부족한 연부조직 대조도 특성에 의하여 한계를 가진다. 따라서 자기공명영상(Magnetic Resonance Images, MRI)이 보다 정확한 목표 체적의 윤곽을 그려내기 위해 광범위 하게 사용되고 있다. 치료계획을 위해 획득한 자 기공명영상에 진단단계에서 얻어진 CT영상의 전자밀도를 융합하는 방법과 자기공명 영상으로부터 만들어진 가상의 CT 를 이용하는 방법 등이 자기공명 영상장치를 기반으로 한 방사선 치료 계획의 선량계산을 위하여 소개되어 왔다. 본 연 구는 MRI기반의 선량계산의 가능성을 확인 해보기 위해 15명 환자의 진단 MR 영상을 통하여 Look Up Table (LUT)을 만 들어 MRI 기반 선량계산과 기존의 CT 기반 선량계산을 비교 검증 하였다. 여기서 lMRI는 획득한 MR 영상에 LUT를 이용 한 전자밀도 보정을 한 것이며 wMRI는 획득한 MR영상을 물 밀도로 동일화 시킨 것이다. 6 MV anterial 방향의 조사가 CT, lMRI, wMRI에 적용되어 치료계획으로 비교되었으며 또한 환자의 병변위치에 따라 2문 조사에서 5문 조사의 치료계 획이 비교되었다. CT기반 치료계획을 기준으로 하여 등선량 분포와 DVH의 차이는 wMRI 보다 lMRI에서 더 적었으며 최 대선량 차이가 91 cGy vs. 57 cGy, 평균선량이 74 cGy vs. 42 cGy, 최소선량 차이가 94 cGy vs. 53 cGy로 측정되어 각각 의 선량 평가 면에서 그 차이가 wMRI보다 lMRI에서 더 적었다. 이러한 결과는 wMRI의 경우 공동내 선량계산에서 CT 기반 선량계산과 차이가 나기 때문이다. 따라서 본 연구의 결과는 lMRI 기반 선량계산의 가능성이 있음을 보여준다.
중심단어: 자기공명영상기반 방사선치료계획시스템, Look up table, 전자밀도 Technol Cancer Res Treat 7(5):341-347 (2008)
6. Miga MI, Boettger T, Nyholm T, et al: Radiation therapy
planning and simulation with magnetic resonance images. Medical Imaging 6918:19181C (2008)