IEG 환경지질연구정보센터
14
0
0
전체 글
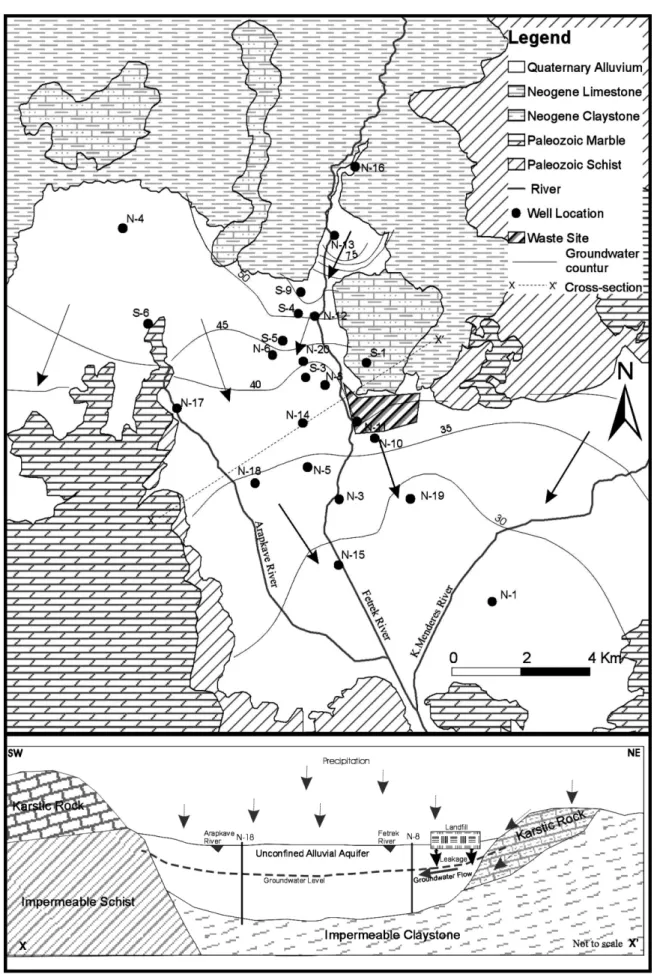
(2) 70. Celalettin S¸ im s¸ek, Unsal Gemici, and Sevki Filiz. Fig. 1. Location map of the study area.. western part of Turkey (a center of industry and tourism), and is situated on an alluvial aquifer with high water potential (Fig. 1). The industrial, residential, and agricultural water needs of the region are met entirely from Quaternary alluvial aquifers. The main objectives of this study were to investigate the vulnerability characteristics of the main aquifer that recharges from the surface and to evaluate the groundwater quality and contamination characteristics derived from the hazardous landfill site. 2. GENERAL CHARACTERISTICS OF THE STUDY AREA The Torbali Plain is located within the boundaries of the district of Torbali in the Izmir Province of Turkey. It is situated about 50 km south of the city of Izmir in western Anatolia (Fig. 1). Within the plain, Torbali, Caybasi, Ayrancilar, Subasi, and Kuscuburun are the main population centers with a total population of about 93,216 according to 2000 census results. Being close to the city of Izmir and its main transportation network, the plain and its fertile agricultural fields now experience pressure from numerous industrial enterprises, and there is a strong demand for con-. verting agricultural fields into industrial production zones. Many of the individual wells drilled in the surficial aquifer are used for irrigation and drinking purposes. The Torbali Plain is located within a graben. The plain is surrounded by the Gurgur Mountain to the east, and the Arapkahve Mountain to the west. The city of Torbali is located at the center of the plain and the Fetrek River is the main drainage unit (Fig. 2). The plain demonstrates the typical characteristics of the mild and warm Aegean climate. The plain has an average elevation of about 60 m above mean sea level and receives a mean annual rainfall of 718 mm (Simsek et al., 2006). The highest monthly precipitation occurs in November and December (90 and 153 mm) and the lowest levels are observed in July and August (1.5-4 mm). The landfill area is situated in the vicinity of the Torbali Fetrek River, the most productive part of the alluvial aquifer. Torbali and surrounding communities with a population of 100,000 are storing 100,000 m3/yr of urban and industrial solid waste within trenches dug into permeable, granular material, without taking any precautionary measure. 2.1. Geological and Hydrogeological Features The Mesozoic Menderes metamorphic rocks form the.
(3) An assessment of surficial aquifer vulnerability to pollution. Fig. 2. The hydrogeological and sampling location map of the study area.. 71.
(4) Celalettin S¸ im s¸ek, Unsal Gemici, and Sevki Filiz. 72. basement of the Torbali plain and are observed outcropping in the eastern and western parts of the plain. The Menderes metamorphic rocks consist of mica and chlorite schists in their lower levels and dolomitic marble in their upper sections (Simsek, 2002). This formation is widely observed in the western part of the study area (Fig. 2). These schists are nearly impermeable and therefore do not supply significant amounts of groundwater. The Neogene Visneli Formation, formed of limestone and claystone, overlies the basement rock. This formation is widely observed in the northern part of the study area. Finally, Quaternary alluvial layers overlie the basement and the Visneli Formation. The thickness of the alluvial layer ranges from 30 to 80 m in the Torbali plain (Fig. 2). The geological characterization revealed that the most important water bearing units in the study area are the karstic and alluvial aquifers. The karstic aquifer consists of Mesozoic marbles and Neogene limestones. It has a fractured texture and is a good example of the typical karstic aquifer rocks of the region. The karstic rocks in the western and eastern parts of the area are quite permeable and feed the alluvial aquifer. The Quaternary surficial aquifer is composed of alluvial deposits. It is the main water-supplying strata within the study area. This aquifer is divided into two zones according to material properties. Granular material such as sand and gravel are mainly located along the Fetrek. River, while silty sand and clayey materials are located in center and west of the alluvial plain (Simsek, 2002). The sandy aquifer is used to supply drinking water, as well as for irrigation and industrial water purposes. The east sector of the alluvial aquifer is used for private drinking and irrigation water purposes to the Torbali plain. The average depth of the surficial aquifer ranges between 30 m and 80 m and is recharged from the surface and from water seeping by the Fetrek River. A large part of the groundwater from areas near the waste sites is being exploited as a high-yield alluvial aquifer (Simsek, 2007). The average hydraulic conductivity of the sandy and silty aquifers in the study area is 1.9×10⁻² and 4.5×10⁻² cm/s, respectively (Simsek and Filiz, 2005). Groundwater levels in the alluvial aquifer are 25-75 m above sea level (Fig. 2). The depths to the groundwater table in the study area were measured in April 2005 when the water levels were at their maximum (Table 1). Based on the analysis of the water table, the groundwater flow direction in the study area was determined to be from north to south-southeast (Fig. 2). The deepest points of the water table (i.e., >26 m) are in the Fetrek River zone of the alluvial aquifer, as seen in Table 1. It is important to mention that more than 90% of the groundwater pumped is obtained from the alluvial aquifer, where the solid waste site is located. However, from the 1980s to the present, rapid industrialization and consequent population growth over the past. Table 1. Database for aquifer vulnerability assesstment Well No S-1 S-3 S-4 S-5 S-6 S-9 N-1 N-3 N-4 N-5 N-6 N-8 N-10 N-11 N-12 N-13 N-14 N-15 N-16 N-17 N-18 N-19 N-20. X 534125 532120 531875 531355 526890 531950 538307 533224 526050 532180 531014 532750 533818 533550 532413 533074 532015 533196 533568 527842 530445 535580 532025. Y Groundwater occurance Overall lithology of aquifer Depth to groundwater 4226389 Unconfined Limestone 24 4225890 Unconfined Gravel and sand 29 4228011 Unconfined Sand and clayey gravel 31 4227120 Semi-Confined Sand and clayey gravel 26 4227690 Semi-Confined Sands 24 4228745 Unconfined Gravel 21 4218428 Unconfined Sand and clayey gravel 17 4221839 Unconfined Silty sand and gravel 20 4230860 Semi-Confined Schist and sand 18 4222919 Semi-Confined Sand and silty gravel 21 4226641 Unconfined Silty sand and gravel 26 4225650 Unconfined Gravel 27 4224433 Semi-Confined Clayey gravel 26 4224909 Unconfined Gravel 24 4227933 Unconfined Sand and gravel 23 4230618 Unconfined Gravel 18 4224380 Semi-Confined Sand and clayey gravel 22 4219649 Semi-Confined Silty sand and gravel 17 4232676 Semi-Confined Sand 10 4224872 Semi-Confined Sandy silt 18 4222386 Semi-Confined Sandy gravel 19 4221857 Semi-Confined Sandy gravel 18 4226423 Unconfined Gravel 32. G 1.0 1.0 1.0 0.4 0.4 1.0 1.0 1.0 0.4 0.4 1.0 1.0 0.4 1.0 1.0 1.0 0.4 0.4 1.0 0.4 0.4 0.4 1.0. O 0.8 0.8 0.6 0.6 0.6 0.6 0.5 0.5 0.4 0.6 0.6 0.8 0.8 0.8 0.8 0.6 0.6 0.7 0.6 0.6 0.7 0.7 0.8. D GOD Index 0.7 0.56 0.6 0.48 0.6 0.35 0.6 0.14 0.6 0.14 0.6 0.35 0.7 0.35 0.6 0.30 0.7 0.12 0.6 0.14 0.6 0.35 0.6 0.48 0.6 0.19 0.6 0.48 0.6 0.48 0.7 0.42 0.6 0.14 0.7 0.19 0.8 0.48 0.7 0.19 0.7 0.19 0.7 0.19 0.6 0.48.
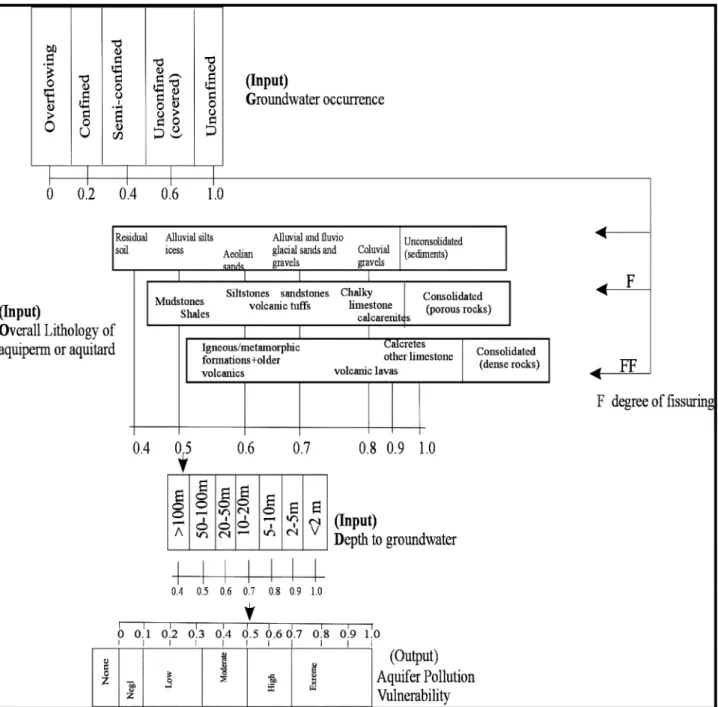
(5) An assessment of surficial aquifer vulnerability to pollution. 10 years have led to increased groundwater demand, resulting in excessive overdraft. 3. DATABASE AND SAMPLING PROCEDURE The database used in this study was created by using the data obtained from the 23 wells drilled by the Department of Drilling of the Torbali Technical Vocational School of Higher Education and several private drilling companies. The details pertaining to the database for vulnerability analysis are presented in Table 1. The GIS integration of the database was performed on an ArcView platform developed by the Environmental Systems Research Institute (ESRI),. 73. Inc (ESRI, 1999). The general project area was revised and reduced based on the locations of the boreholes given in Table 1. Moreover, the domain of interest could be considered an area in which the interpolation of the 23 borehole values is more accurate and the interpolation errors are minimized. The GOD model was used in this study to understand the surficial aquifer vulnerability condition. The vulnerability assessment is based on three parameters: i) G: mode of groundwater occurrence, ii) O: overlying lithology, and iii) D: depth to water table (Foster, 1988). The flow chart presented in Figure 3 illustrates the evaluation procedure of the GOD model. According to the GOD procedure, the aquifer vulnerability can be classified into neglect, low,. Fig. 3. GOD Model for evaluation of aquifer vulnerability index (Foster, 1988)..
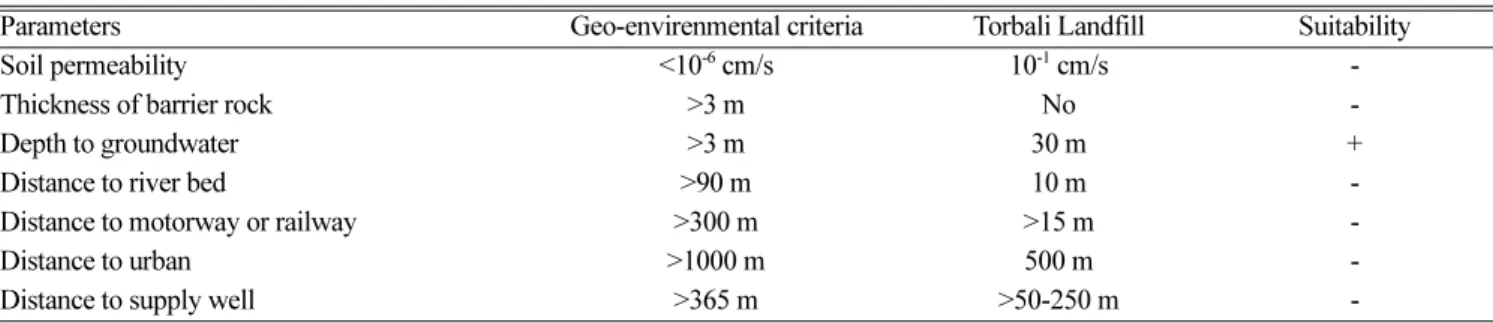
(6) 74. Celalettin S¸ im s¸ek, Unsal Gemici, and Sevki Filiz. Table 2. The geo-environmental properties of the Torbali landfill site Parameters Soil permeability Thickness of barrier rock Depth to groundwater Distance to river bed Distance to motorway or railway Distance to urban Distance to supply well. Geo-envirenmental criteria <10 cm/s >3 m >3 m >90 m >300 m >1000 m >365 m -6. moderate and very high vulnerability to contamination. During the sampling study, a total of 17 groundwater sampling points were selected to represent the conditions of groundwater. One sample was taken from the landfill leachate (N-21). Only one season’s water sample was taken from N-11 due to the well being abandoned. During the hydrogeochemical sampling, the waters were pumped for 20-25 min for the first sample taken. All samples were filtered through 0.45 µm filter paper. Two sets of samples were taken at each sampling point: a 1000 ml sample for anions and a 50 ml sample for cations. All water samples were stored in polyethylene bottles. Nitric acid was then added to the samples for cation analysis in order to obtain a pH value of less than 2. The pH and electrical conductivity (EC) values were measured using field equipment (WTW-pH330 and WTW-EC330). Cations and trace elements were analyzed with ICP-ES (Inductively Coupled Plasma Emission Spectrometry) in Canadian ACME laboratories. Cl and HCO3 were analyzed using volumetric methods, SO4 was analyzed using gravimetric methods, and NO3 was analyzed with SP model spectrophotometers in Dokuz Eylul University labo-. Fig. 4. Distribution of waters in Piper triangular diagram.. Torbali Landfill 10 cm/s No 30 m 10 m >15 m 500 m >50-250 m -1. Suitability + -. ratories. The Aquachem 3.70 computer program was used to assess the water chemistry of the samples. 4. RESULTS AND DISCUSSION 4.1. Landfill Disposal Site and Leachate Composition Some important geo-environmental properties of the Torbali landfill site are presented according to Bagch (1994) in Table 2. The landfill site is located near the Fetrek River and is situated within the boundaries of the Torbali (Fig. 2). Surrounding of the site is an important green belt and vegetable production area in Izmir. The drinking waters of these fields are mostly provided from the surficial aquifer that is formed as a result of the alluvial deposits of the Fetrek River. The western portions of the site, on the other hand, are highly populated residential areas. There are several groundwater production wells, which have been used for agricultural activities near the landfill site. According to geo-environmental condition, the sandy aquifer site is unsuitable for waste disposal facilities..
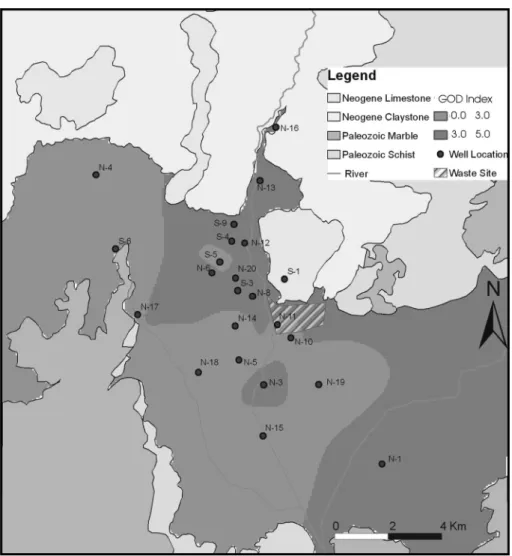
(7) An assessment of surficial aquifer vulnerability to pollution. 75. Table 3. Chemical composition of the groundwater in the study area Parameters. Periods 12/06/2001 pH 15/01/2002 12/06/2001 EC (mS/cm) 15/01/2002 12/06/2001 Na (mg/L) 15/01/2002 12/06/2001 Ca (mg/L) 15/01/2002 12/06/2001 Mg (mg/L) 15/01/2002 12/06/2001 K (mg/L) 15/01/2002 12/06/2001 CI (mg/L) 15/01/2002 12/06/2001 HCO (mg/L) 15/01/2002 12/06/2001 Hardness (fr) 15/01/2002 12/06/2001 CO (mg/L) 15/01/2002 12/06/2001 SO (mg/L) 15/01/2002 12/06/2001 NO (mg/L) 15/01/2002 12/06/2001 SAR 15/01/2002 12/06/2001 Fe (mg/L) 15/01/2002 3. 3. 4. 3. N-1 7.3 7.7 102 241 20.8 20.1 73.4 55 22.2 15.4 2.1 2.9 24.9 33 342 199 27.4 19.8 19.7 28.4 12.8 5.8 0.55 0.62 0.5 0.4. N-3 7.3 8.3 155 810 21.1 20.9 101 103.7 29.5 32.7 1.9 1.4 52.4 33.6 358 95.2 37.3 39.3 144 46.9 51.8 27 3.1 0.47 0.46 0.1 0.01. N-4 7.2 7.0 148 365 14.5 25 103.7 113 28.2 27 0.9 3.8 48.5 20.7 405.8 268 37.3 39.3 14.8 204 11.5 6.5 0.33 0.55 0.1 0.1. N-5 7.4 8.4 191 945 28.5 27.9 125.9 131.6 37 43.1 2.2 1.7 54.9 43.6 546 348 46.6 50.5 71.6 40.7 69.7 38.3 13.2 0.57 0.54 0.1 0.1. N-6 7.6 7.9 269 1050 28.5 19.6 118 102 36.1 32.4 2.6 1.7 98.8 58.5 373 365 44.3 38.7 24.2 46.5 16.3 7.3 0.48 0.43 0.1 0.1. N-8 7.6 7.6 648 637 474 418.6 179.6 160.8 47.2 51.5 6.9 5.8 648.9 470.5 735 412 64.7 61.1 285 398 0 8.9 8.14 7.36 0.3 0.2. N-10 7.9 8.4 510 656 374 158.9 114.5 41.4 34 12.2 5.9 3.1 508.9 94.4 606 269.5 42.5 32.9 13.5 105.6 152.4 27.2 4.7 7.89 3.86 1.7 1.2. Results of the chemical analyses of the leachate derived from the Torbali waste disposal area are presented in Table 4. The Torbali landfill is mainly composed of municipal waste: 15-20% food waste, 15-20% paper, 3-5% metals, 5-10% plastics, and the rest industrial waste (Torbali Municipality, 2002). The composition of the leachate seepage is directly related to the composition of the landfill. Water from the landfill is dark brown and Na-Cl type with high dissolved solids (Fig. 4). The concentrations of major ions are higher during the arid season. Electrical conductivity values are between 4,275 and 4,575 µS/cm. High EC values, which are assumed as a contamination indicator for ground and surface waters, are due to the high concentrations of dissolved solids in the leachate. The electrical conductivity of the landfill leachate in Torbali is at low levels compared with the literature (i.e., 26,900 ìS/cm for leachate) (Fatta et al., 1999). Hardness (Fr) values for wastewater vary between 481 and 689 with an average of 584. Increase of concentrations of the major cations (Ca, Mg, Na, K) causes an increase in hardness. The Na/Cl ratio is between 0.5 and 1.13. This value is around 0.76 for uncontaminated groundwater samples from the study area. The K/Cl. N-11 N-12 7.6 7.3 7.6 700 276 985 564 54.1 101.7 216.1 169.3 180.6 54 45 63.1 8.5 2.8 2.5 808 259.6 295.1 978.9 416 382.4 76.1 60.7 39.1 311 51 129.3 23.8 1.6 0.95 8.9 0.31 0.1 0.1 0.1. N-13 7.5 7.2 392 325 24.9 15 110.5 106.4 31.3 30.6 3 2 71.6 29 387 312 40.4 39.0 61.7 102 0 0 0.54 0.33 0.1 0.1. N-14 7.2 8.2 150 715 22.6 24.4 95.2 102.8 26.7 32.5 1.9 1.8 41.9 33.6 358.9 134.4 34.7 39.0 148.8 30 58.02 20.5 12.5 0.54 054 0.1 0.01. N-15 7.5 7.1 941 612 24.8 12.8 102.9 215 31 22.3 2 29.6 58.8 203.8 299 307 38.3 62.8 68.9 198 0 0 0.55 0.21 0.4 0.3. N-16 7.3 8.2 165 715 22.6 24.4 95.2 102.8 26.7 32.5 1.9 1.8 41.9 33.6 359 134.4 29.5 34.7 148 30 58.2 5.5 4.8 1.94 1.28 0.1 0.1. N-17 7.5 7.6 143 198 27.9 46 88.9 85.6 26 30 5.1 4 67 30 279 452 32.8 29.8 38.7 30 20.5 12.5 0.67 0.50 0.1 0.1. N-18 6.9 7.6 214 200 30.7 23.4 140.2 75.9 45.6 27 2.5 3.7 63.8 20 478 268 53.7 39.3 87.7 159.8 43.9 18.7 0.58 0.55 0.2 0.1. N-19 6.9 7 171 196 28.5 29 114.2 67 30.5 28 2.7 1.9 59 24 398 342 41.0 28.2 25 20 0 0 0.61 0.75 0.4 0.5. N-20 7.5 8.3 665 656 18 14.6 99.5 85.6 27 25.3 1.9 1.6 51 25.7 326 115 35.9 31.8 26 28.8 30.3 7.2 0.41 0.36 0.4 0.1. ratio is quite high for both the arid and the wet season with values of 1.16 and 2.83. The K/Cl value is less than 0.05 for drinking water. The pH values of the leachate are between 6.3 and 6.6. Concentration of Al, Fe, Mn, Ni, Sb, Se and Cd in the leachate are above and Pb, Zn and Cu concentrations are below the drinking water standards (Table 4) for both arid and wet seasons. As a result, the chemical composition of the waste leachate is highly hazardous to the environment and the water sources. 4.2. Aquifer Vulnerability The groundwater in the study area is fed with rainfall locally infiltrating the land surface, and some activities at the land surface control the groundwater quality. The GOD model (Foster, 1988) was used to evaluate the regional groundwater pollution potential in this study.The vulnerability map of the surficial aquifer is presented in Figure 5. According to vulnerability mapping, two main zones (moderate and low vulnerable) within the alluvial aquifer were determined by the data obtained from the 23 drilled wells. The alluvial.
(8) Celalettin S¸ im s¸ek, Unsal Gemici, and Sevki Filiz. 76. Table 4. Mean chemical composition of the groundwater and leachate in the study area Moderately vulnerable zone (n=9) Low vulnerable zone (n=7) Dry Wet Dry Wet pH 7.53 7.97 7.24 7.56 EC (µS/cm) 544.4 692.33 279.7 461.6 Na (mg/L) 321.7 95.7 25.4 26.9 Ca (mg/L) 113.3 101.5 110.1 112.9 Mg (mg/L) 33.3 32.6 32.1 29.9 K (mg/L) 8.3 2.84 2.5 6.6 Cl (mg/L) 373.5 124.7 56.3 53.6 HCO (mg/L) 606.4 266.1 394.9 302.7 SO (mg/L) 162,3 115,1 43,6 105,6 NO (mg/L) 21,6 4,9 19,9 9,3 Hardness (fr) 41.5 37.0 39.8 40.6 As (mg/L) 0.035 0.03 0.03 0.03 Al (mg/L) 0.01 <0.01 <0.01 <0.01 Fe (mg/L) 0.33 0,23 0,20 0,19 Cd (mg/L) 0.002 0.002 0.002 0.002 Cr (mg/L) <0.02 <0.02 <0.02 <0.02 Cu (mg/L) 0.011 0.008 0.016 0.003 Mn (mg/L) 0.01 0.01 0.17 0.02 Ni (mg/L) 0.006 0.005 0.005 0.005 Pb (mg/L) 0.015 <0.01 <0.01 <0.01 Sb (mg/L) <0.01 <0.01 <0.01 <0.01 Zn (mg/L) 0.18 0.23 0,04 0,08 3. 4. 3. Landfill leachate Dry Wet Mean 6.30 6.60 6.30 4575 4275 4575 2498 2017 2258 1825 1264 1545 567 378 472 4400 1683 3042 1550 1449 1500 4880 4650 4725 2890 2963 2927 37.2 3.8 20.5 688.7 480.7 584.7 0.307 0.215 0.261 12 3.7 7.85 60.1 9.7 34.9 0.003 0.009 0.006 0.430 0.125 0.278 0.31 0.96 0.64 13.3 2.4 7.85 0.686 1.52 1.103 0.070 0.05 0.06 0.062 0.013 0.038 0.62 0.32 0.47. Standards (TSE,1997) (WHO, 2002) (EU, 1998) 6.5- 8.5 650 2500 175 200 200 200 50 12 600 250 250 250 25. 250 10. 250. 0.05. 0.01. 0.01. 0,3 0,003 0.05 1,3. 0,2 0,003. 0,2 0,005. 2. 0,003 0.05 0.01 5. 0,002. 1,3 0,05 0,002. 5. 5. Note: Bold character shows value exceeded the standard limits.. aquifer (mainly composed of sandy and gravely materials) is located around the Fetrek River and the landfill site has a GOD Index value ranges from 0.3 to 0.5 and is considered to be a moderately vulnerable. The other silty zone has a low vulnerability according to the GOD Index value of less than 0.3. The alluvial aquifer was divided into two zones on the basis of GOD vulnerability index model.. ern part of the alluvial aquifer. The southern part of the region, however, has a medium permeable material such as silt and silty sand and includes some impermeable soil (clay) at various depths. Therefore, the leakage from surface contaminant sources is transported slowly compared to the sandy aquifer. Moreover, these areas are mostly covered by residential areas and agricultural fields.. 4.2.1. Moderate vulnerability zone These areas generally have high scores from the most important parameters including the depth to groundwater and the upper layer lithology. Such sites are generally considered not to be suitable for solid waste disposal or other industrial activities. Under extreme conditions, these sites could be used by taking all the necessary precautions to avoid groundwater contamination. In the study area, these areas are generally located over the eastern parts of the alluvial aquifer. The lithology of these areas is mostly alluvial gravels and sands that are potential aquifers for groundwater production. The recharge from the surface is very high due to the well-drained and permeable material. In the study area, the hazardous landfill disposal area is situated on this area.. 4.3. Groundwater Quality. 4.2.2. Low vulnerability zone These areas are generally located in the central and west-. The pH of the groundwater is near neutral (7.0-8.4) for both the moderate and low vulnerability aquifers (Table 3). The pH values for samples N-8, N-10, and N-11, which are near the landfill, are 7.6-8.4. EC values vary between 102 and 941 µS/cm during the wet season and 196 and 1,050 µS/cm during the dry season. An average EC value for the vulnerable zone in the wet season is higher than those in the dry season. A strong increase in EC is observed in the sandy aquifer recharing from the surface during both seasons. Wells near the landfill also have relatively high ion concentrations and EC values show that leachate seepage affects groundwater quality, especially during the wet season. EC values for these water samples are above the drinking water standards but below the irrigation standards (Tables 4 and 5). The hardness values of the groundwater in the vulnerable.
(9) An assessment of surficial aquifer vulnerability to pollution. 77. Fig. 5. The vulnerability map of the surficial alluvial aquifer. Table 5. Irrigation water quality criteria (Ayers and Westcot, 1985). Potantial irrigation parameters. Units. EC Sodium Cloride Nitrate-nitrogene Bicarbonate pH. µS/cm SAR mg/L mg/L mg/L. areas are remarkably high (around 45 (Fr)) (wells N-5, N-8, N-11, N-12, N-15, and N-18). Hardness values also differ for the sandy and silty aquifers according to the groundwater recharge conditions from the surface. Average hardness values in groundwater samples for the dry season are 41.5 and 39.8 (Fr) for sandy and silty aquifers, respectively. It is important to note that the recharge from the surface in the vulnerable aquifers is assumed to decrease the groundwater hardness value during the wet season, except at wells N-3 and N-16. The disposal of the marble wastes near the Fetrek River and the mixing of the leachate with the groundwater is the reason for the high hardness values (Simsek et al., 2005). The mean. None <700 <3.0 <140 <5 <90 <6.5. Degree of restriction on use Sligt to moderate 700-3000 3.0-9.0 140-350 5-30 90-500 6.5-8.4. Severe >3000 >9.0 >350 >30 >500 >8.4. hardness value for the leachate is about 480 (Fr) and percolation of the leachate to the aquifer causes the hardness in groundwater to increase. Mean Ca and Mg values for groundwater samples are around 113.3 and 33 mg/L in the vulnerable sandy aquifer, and 101.1 and 32.1 mg/L in the low vulnerability aquifer during the dry season. Relatively high concentrations of Ca and Mg are obtained in moderately vulnerable zone (N-8, N-12) (Tables 3 and 4). This is explained by dilution of the leachate composition when the leachate is mixed with the groundwater. Based on their chemical composition, water types of the groundwater are dominantly Ca-HCO3 during the arid and wet season. But,.
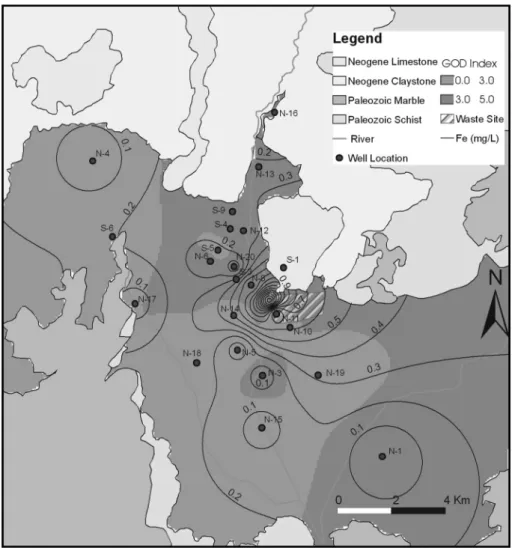
(10) 78. Celalettin S¸ im s¸ek, Unsal Gemici, and Sevki Filiz. Fig. 6. Cl concentration in groundwater (for 2001).. water from N-8, N-10 and N-11, which are located close to the waste disposal area are Na-Cl type (Fig. 4). Na concentrations for groundwater samples reaches up to 321.7 mg/L in the vulnerable aquifer and 25.4 mg/L in the low vulnerability aquifer in the arid season. High Na concentrations in especially sandy aquifer are probable derived from the mixing with the leachate (in which Na concentrations reach up to 1,500 mg/L). Cl with concentrations of 20808 mg/L is an important ion for groundwater in the study area. Elevated Cl concentrations are resulted in the contributions of the leachate seepage and contaminants derived from other industrial activities to the groundwater (Fig. 6). SO4 values are between 285 and 311 mg/L and are similar to the Cl concentrations in that they increase close to the waste disposal area (Table 3). SO4 values are higher than those of the drinking water standard of 250 mg/L (TSE, 1997) for samples N-8 and N-11. High SO4 concentrations for the leachate and some of the water samples are due to aerobic oxidation of iron sulfides (Ulrich et al., 2003). The nitrate concentrations in waters are between 5.5 and 43.9 mg/L in the arid season (Table 3) with an average of 21.6 mg/L. Nitrate concentrations decrease during the wet season due to the dilution and vary from 3.1 to 18.7 with a. mean value of 4.9 mg/L. For the leachate, nitrate values are 3.8 and 37.2 for the wet and arid seasons, respectively. Although the nitrate concentrations are high in the wells located near the waste disposal area, higher nitrate concentration values were obtained from sample N-17, which is located in the low vulnerability zone (Table 3 and Fig. 7). Since nitrogenous materials are rare in the geological record, nitrate in the groundwater is due to anthropogenic activity. Therefore, infiltration of some fertilizers and seepage from urbanization raised nitrate concentrations above the drinking water standards (25 mg/L in TSE, 1997 and 10 mg/L in WHO, 2002) for some wells (Table 3). There is a relationship between total metal concentration and pH for the groundwater samples from the study area. Sample N-21, which is the leachate seepage, is near weak acidic with high metal content. The other groundwater samples show near neutral characteristics; they therefore have low metal content when compared with the leachate water. The groundwater samples have low Cd, Cr, Cu, Ni, Mn, Pb, Sb and Zn concentration, generally below detection limits. However, some wells near the waste disposal site shows some trace element concentration. In particular, it is shown that the Fe concentration in the groundwater is mainly caused.
(11) An assessment of surficial aquifer vulnerability to pollution. 79. Fig. 7. NO concenration in groundwater (for 2001). 3. by the industrial contaminant from the landfill leachate. Similarly, the same ion contents are observed to be highest at or near the landfill site (Table 4). Fe concentration values vary between 0.01 and 1.7 mg/L and high Fe concentrations in N-1, N-8, N-10 and N-19 exceed the Turkish drinking water standards (Fig. 8). These wells are located in the vulnerable zone and are affected by the landfill leachate in which Fe concentrations reached up to 60.1 mg/L in the arid season. Fe concentrations in the landfill leachate are very high compared with the literature leachate data (Fatta et al., 1999). Some industrial waste leachate is responsible for the high Fe concentration in the study area (Simsek et al., 2005). In addition, Arsenic concentrations are measured to be high in well N-3 (0.05 mg/L), which is used as a drinking water supply well for Caybasi city. Many of the wells are affected by surface waste activities and are not suitable for drinking water purposes. When the irrigation water quality in the Torbali Plain was evaluated with respect to (Sodium Arbsorbtion Ratio) SAR, it was found that the groundwater quality in the plain falls in the good and moderate quality class (Table 5). The high values of SAR could be explained by the influence of leachate from the landfill. As shown in Table 4, the SAR values vary. between 0.34 and 8.9, and high SAR values are observed in the vulnerable zone near the waste site. 4.4. Pollution Mechanism in the Vulnerable Aquifer On the basis of the results of a hydrochemical and hydrogeological studies, the vulnerable aquifer has been determined to be a contaminated groundwater area. The nature and position of geological and hydrogeological conditions control the occurrence and movement of the water. When the leachate reaches the groundwater table, the concentration of each pollutant is reduced further either due to density differences or diffusion and dispersion (Bagch, 1994). The contaminant plume geometry for a circular landfill base was determined an elliptical cross section in a thick sandy aquifer (Paschke and Hoppes, 1984). In the study area, an examination of the wells in the vulnerable area indicates that it is underlain by thick granular material with sandy gravel and gravel. The hydraulic conductivity of the sandy and gravel material in the landfill site is 2.65×10⁻¹ cm/s (Simsek, 2002). The depth of the groundwater level is below 26 m (above 40 m from the sea level). Due to an increase in the groundwater level of about 3-5 m.
(12) 80. Celalettin S¸ im s¸ek, Unsal Gemici, and Sevki Filiz. Fig. 8. Fe concenration in groundwater (for 2001).. resulting from both precipitation and a decrease in irrigation activity in winter, the interaction between groundwater and the leachate is accelerated. The migration of contaminant from the landfill in the moderate vulnerable zone is faster than at the low vulnerability aquifer. When the contaminant reaches the groundwater, contaminant movement can be accelerated by groundwater pumping and groundwater flow direction in the aquifer, as seen from the chloride distribution in Figure 6. According to present and previous data, the groundwater in the vulnerable aquifer has been polluted from the surface hazardous landfill leachate over the last five years. The N-3 and N-5 monitoring wells (located at the lower section of the landfill site in the sandy aquifer) and N-14 (located in the western section of the landfill, in the silty aquifer) were analyzed in 1997 (Simsek, 1998). The Cl and SO4 concentration of groundwater in 1997 at N-3, N-5 and N-14 wells show lower results than these of obtained in 2001 (Fig. 9). In particular, Cl, SO4 and CaCO3 values at the N-3 and N-5 monitoring wells (in the sandy aquifer) increased significantly compared with the low vulnerability silty aquifer over the past five years. The Fe, Cl and NO3 not only represent an. Fig. 9. Corelation of the groundwater composition in 1997 and 2002.. overall quality pattern in the plain but also demonstrate the potential sources of contamination that alter the characteristics of the plain’s groundwater (Figs. 6, 7 and 8). Especially in the northeastern parts of the plain, pollution originates mainly from uncontrolled waste disposal activities. The high vulnerability characteristics of the material that form the surficial aquifer are mainly responsible for the rapid transport of these chemicals to the sampling wells. On the other.
(13) An assessment of surficial aquifer vulnerability to pollution. hand, nitrate pollution is mainly concentrated at the low vulnerability zone of the plain, where there is extensive agricultural activity. Based on this fundamental understanding, it could be concluded that anthropogenic activity is responsible for the contamination of the groundwater of the low vulnerable zone. 4.5. Protection of Groundwater from the Landfill Site Leachate seepage changes the geochemical properties of the groundwater. The effects of the waste disposal area located on the highly vulnerable aquifers are discussed above. The groundwater quality and the degree of pollution in the vulnerable sandy aquifer differ from other low vulnerability aquifers. Therefore, the hydrogeological conditions and aquifer lithologies are related to groundwater contamination in the sandy aquifer, which is not suitable for landfill construction. Disposal of the urban waste and other contaminant sources (industrial and mining) must be avoided on the vulnerable aquifer. The vulnerable aquifer is an important groundwater supply aquifer in the Torbali urban area and environs. Some contaminated groundwater supply wells (N-8 and N-10) near the waste site were recently abandoned. However, two important groundwater drinking water supply wells for the urban area (N-3 and N-14) are located in front of the contaminant plume, and are under risk of contamination. Therefore, the groundwater management program and protection strategy of the aquifer should be prepared. To protect the groundwater, the vulnerable aquifer under the waste disposal area should be isolated by cement grouting. The grouting wells should be performed at the landfill basement and separated by 2-5 m depending on the soil permeability. In addition, monitoring wells and leachate control wells should be drilled in the landfill. The waste surface should also be covered by impermeable barrier clays to avoid rainfall infiltration to the waste landfill. 5. CONCLUSION Based on the hydrogeological and hydrogeochemical investigations performed in the Torbali Plain and its vicinity, contamination due to hazardous landfill activities has been determined. According to GOD vulnerability mapping, the surficial aquifer was determined to have two main vulnerability zones. The hazardous landfill site is located on a vulnerable zone that supplies the majority of the water demand for the Torbali Municipality and Industry. With respect to chemical composition, water from the landfill was dark brown and Na-Cl type with high dissolved solids, and included some toxic elements such as As, Al, Fe, Mn, Ni, Sb, Se and Cd. Leachate seepage was near neutral with high metal content. Groundwater samples near the waste disposal area showed the same water facies (Na-Cl) with leachate seepage. High Na and Cl concentrations are the results of the. 81. mixing of leachate seepage with groundwater. Chemical analyses showed that the groundwater was more or less enriched in a number of elements. Major ions in particular increased around the waste disposal area. Na, Cl, and SO4 were enriched, depending on the mixing of the leachate with the groundwater. Some ions were therefore above the drinking water standards for the water near the waste disposal area. The hydrogeological features of the studied area indicated that contaminants derived from the waste disposal area infiltrate through the vulnerable sandy aquifer and move to the south with groundwater flow. Hydrogeological features of the vulnerable sandy aquifer are not suitable for a waste disposal site and cause the contaminants to infiltrate through to the groundwater in the region. Therefore, the landfill site should be rehabilitated and protected for further groundwater quality, and a new solid waste site should be investigated in the low vulnerability area or in the northern claystone zone. In addition, it is important that the landfill sites should be carefully planned and that their environmental impacts be properly mitigated. The mineral content of leachate fluid in many fields is extremely high with regards to various toxic chemicals, and therefore improper disposal of these waters could pollute clean water resources. The planning of landfill sites must involve state of the art solutions to problems, such as the appropriate disposal of waste, particularly in areas like the Aegean Region of Turkey where most of the landfill sites are located on vulnerable areas with high groundwater potential. ACKNOWLEDGMENTS: This research was funded by DEU- AFS (Research Fund of Dokuz Eylul University) under grant number 02.KB.FEN.012; it acknowledges the financial support of The Turkish Academy of Sciences (TUBA). The authors would like to thank anonymous reviewers for critical reviews of the manuscript.. REFERENCES Aller, L., Bennett, T., Lehr, J.H., Petty, R.J. and Hackett G., 1987, DRASTIC: A standardized system for evaluating groundwater pollution potential using hydrogeological settings. Prepared for the U.S. Environmental Protection Agency, Office of Research and Development, EPA-600/2-87-035. National Water Well Association, Dublin, Ohio. Apleyard, S.J., 1996, Impact of liguid waste disposal on potable groundwater resources near Perth. Environmental Geology, 28, 106−110. Ayers, R.S. and Westcot, D.W., 1985, Water Quality for Agriculture. FAO Irrigation and Drainage Paper No. 29, Rev. 1, U. N. Food and Agriculture Organization, Rome. Bagch, A., 1994, Design, Contruction and Monitoring of landfill, John Wiley & Sons, 2.nd edn, pp 99−107, Canada. Celik, M., 2002, Water quality assesstment and the investigation of the relationship between the River Delice and the aquifer systems in the vicinity of Yerköy (Yozgat), Environmental Geology, 42, 690−700. Civita, M., 1994, Vulnerability maps of aquifers subjected to pollution: theory and practice, Pitagora Editrice, Bologna (in Italian)..
(14) 82. Celalettin S¸ im s¸ek, Unsal Gemici, and Sevki Filiz. Edet, A.E., 2004, Vulnerability evaluation of a coastal plain sand aquifer with a case example from Calabar, southeastern Nigeria. Environmental Geology, 45, 1062−1070. EU, 1998, Directive 200/60/CE relative to human drinking water quality. Official Journal of European Union Communities L327. ESRI, 1999, Getting to know ArcView GIS, 3rd edition, ESRI Press, California. EPA, 1999, Landfill Manual: Landfill Site Design. Environmental Protection Agency. Fatta, D., Papadopoulos, A. and Loizidou, M., 1999, A study on the landfill leachate and its impact on the groundwater quality of the greater area. Environmantal Geochemisty and Health, 21, 175− 190. Foster, S.S.D., 1988, Groundwater recharge and pollution vulnerability of British aquifers: a critical overview. Geological Society Special Publication, No 130, London. Fredrick, K.C., Becker, M.W., Flewelling, D.M., Silavisesrith, W and Hart, E.R., 2004, Enhancement of aquifer vulnerability indexing using the analytic-element method. Envirnmental Geology, 45, 1054−1061. Garcia, G.M., Hidago, M.D. and Blesa, A.M., 2001, Geochemistry of Groundwater in the Alluvial of Tucuman Province. Hidrogeology Journal, 9, 597−610. Ibe, K.M, Nwankwor, G.I. and Onyekuru, S.O., 2001, Assessment of groundwater vulnerability and its application to the development of protection strategy for water supply aquifer in Owerri, Southeastern Nigeria. Environmental Monitoring and Assessment, 67, 323−360. Paschke, N.W. and Hopples, J.A., 1984, Bouyand contaminant plumes in groundwater. Water Resource, 20 (2), 1183−1192. Sadek, M.A. and AbdEl-Samie, S.G., 2001, Pollution vulnerability of the quaternary aquifer near cairo, Egypt, As indicated by isotops and hydrochemistry. Hydrogeology Journal, 9, 273−281. Simsek, C., 2007, The GIS-integrated surficial aquifer potential mapping and its importance for aquifer protection, Kucuk Menderes Basin/West Turkey. State Hydraulic Works, International Con-. gress on River Basin Management, 22−24 March 2007, Antalya, Turkey, 78−94. Simsek, C., Kincal, C. and Gunduz, O., 2006, A solid waste disposal site selection procedure based on groundwater vulnerability mapping. Environmental Geology, 49, 620−633. Simsek, C., Karaca, Z., Gemici, U. and Gunduz, O., 2005, The assessment of the impacts of a marble waste site on water and sediment quality in a river system. Fresenius Environmental Bulletin, 14, 1013−1023. Simsek, C. and Filiz, S., 2005, The hydrogeology and vulnerability of aquifers in Torbali plain and vicinity, Journal of Science and Engineering in Dokuz Eylul University, 7, 21−37 (in Turkish). Simsek, C., 2002, The hydrogeological investigations for the site selection of the landfill area of the Torbali Plain. Ph.D. thesis, The Graduate School of Natural and Applied Sciences, Dokuz Eylul University, Izmir, 197 p (in Turkish). Simsek, C., 1998, The hydrogeology of Torbali Plain, MS.c. thesis, The Graduate School of Natural and Applied Sciences, Dokuz Eylul University, Izmir. Ulrich, G.A., Breit, G.N, Cozzarelli, I.M. and Suflita, J.M., 2003, Sources of sulfate supporting anaerobic metabolism in a contaminated aquifer. Environ Science and Technology, 37, 1093−1099. Unal, N., Nurlu, S., Komurcu, A., Gundogdu, A. and Demir, R., 2001, Solid waste application of the Izmir and around country. Environmental and Geology Symposium Cevjeo-2001 pp: 417− 426 (in Turkish). Torbali Municipality, 2002, Environmental Impact Assessment Report of the Saibler Landfill Site, Torbali, Izmir (in Turkish). TSE-266, 1997, Turkish drinking water standards. Turkish Standards Institute, Ankara WHO (World Health Organization), 2002, Water and Sanitation. Guidelines for Drinking Water Quality, http//: www.who.int/water_ sanitation_health/GDWQ, 2002. Manuscript received August 10, 2007 Manuscript accepted January 23, 2008.
(15)
수치
+2
관련 문서
The spaces in which Parasite takes place are intimately connected with the overall themes of the work. The squalid semi-basement flat where the main protagonists live is
Ross: As my lawfully wedded wife, in sickness and in health, until
다양한 번역 작품과 번역에 관한 책을 읽는 것은 단순히 다른 시대와 언어, 문화의 교류를 넘어 지구촌이 서로 이해하고 하나가
The index is calculated with the latest 5-year auction data of 400 selected Classic, Modern, and Contemporary Chinese painting artists from major auction houses..
Since Dokdo is located far from the mainland of Korea and is virtually uninhabited, the academic research activities of the Corean Alpine Club met
Several methods are considered for permanent disposal of spent nuclear fuel, which is a high-level radioactive waste, such as disposal of the deep layer, disposal of
Second, as a result of the IPA analysis of the sub-factors of audience perception, the factors of entry route were located in the first quadrant, the
The Presidents Cup 2015 is just around the corner. The venue is The Jack Nicklaus Golf Club Korea located in the Incheon Songdo International City, and this is the first time
