- 201 -
High accuracy positioning of closely located spacecraft orbits by HF SAR image correlation
Takao Kobayashi1)* 25)
1. Introduction
In planetary exploration missions, position information of spacecraft is important data.
Highly accurate position data is of useful in applications. One of such applications is Interferometric SAR which requires positioning accuracy of sub-wavelength order.
This year, 2007, in July, a Japanese lunar observation orbiter, SELENE, will be launched. It carries some 14 onboard science missions, among which is Lunar Radar Sounder (LRS), an HF sounder (Ono et al., 2000). In the LRS mission, along with the nominal observation of nadir subsurface sounding, an ambitious attempt is planned to image the area of permanent darkness in the lunar polar region by carrying out 2-D Synthetic Aperture Radar (SAR), of which the key parameter is the positioning accuracy of orbits. Currently, the positioning accuracy of the SELENE orbit is estimated of the order of km at the best, while the accuracy of sub-wavelength order (<10m) is required to carry out 2-D SAR of LRS properly. In order to overcome this difficulty, we propose a new technique to determine the relative position of orbits with required accuracy. The technique stands on 2-D cross correlation of LRS-SAR images observations and was studied by means of computer simulation.
2. HF SAR Image Correlation
The orbit of SELENE is a polar orbit. During the nominal operation period of one year, it will make about 6000 turns around the moon. As the result, the density of the orbit in the polar region becomes extremely high. Under such condition, LRS SAR images taken from closely located orbits can be regarded identical to each other after compensating the shift, or discrepancy, of orbit positions.
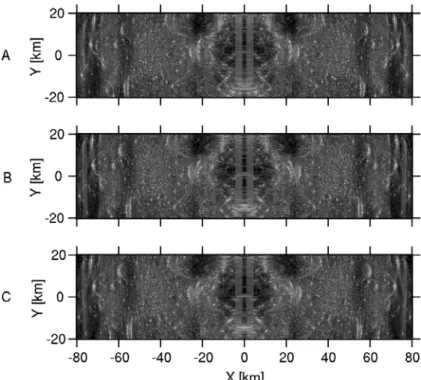
Figure 1. shows simulated LRS SAR iamges. The center frequency of the LRS is 5MHz and the frequency band width is 2MHz. The pulse repetition frequency is 60Hz in the simulation. These LRS SAR images are taken from closely located orbits at the altitude of 100km above the numerically generated lunar surface (Kobayashi et al., 2002).
The orbits are parallel to each other: the distance between the orbits are 500m (orbits A and B) and 1000m (orbits B and C) in X-direction. Note that those three images look almost identical to each other. The image shows mirror image symmetry relative to the ground track (Y axis). The relative position of the orbit B to A is (500m, 0m), and the relative position of B to C is (1000m, 0m) thus that of C to A is (1500m, 0m).
In the proposed technique, 2-dimensional cross correlation of two images are taken.
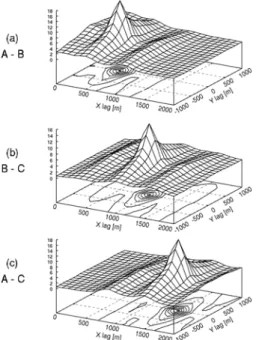
Figure 2 shows the cross correlation of two LRS SAR images (fig. 1) with the lag interval of 100m. Note that the correlation peaks are found at the lag that corresponds to
1) Korea Institute of Geoscience & Mineral Resources ([email protected])
- 202 -
the relative position of two orbits. Because the image suffers the mirror image symmetry (Kobayashi and Ono, 2007), the correlation results also shows the mirror symmetry in X-lag direction. Only positive value of X-lag is shown in fig.2.
Note also that fig. 2 allows us determine the relative orbit position with the accuracy of 100m which is better than current orbit prediction performance.
Figure 1. LRS SAR images of 3 orbits obtained in simulation. The orbits are parallel to each other. The ground track coincides with the Y axis. The orbit distance in X direction is 500m (A-B), 1000m (B-C), and 1500m (A-C).
3. Orbit determination accuracy
In order to determine the relative orbit positions with higher accuracy than 100m, we take cross-correlation of LRS-SAR images with 5m lag interval (Fig.3) then fit a paraboloid to each cross correlation result with the Least Square Method to determine the interpolated peak position of the cross-correlation. The final results of the orbit positioning are as follows: the relative position of the orbit B to A is (500.3m, +0.2m), the orbit C to B is (1002.4m, 0.0m), and the orbit C to A is (1497.5m, 0.0m).
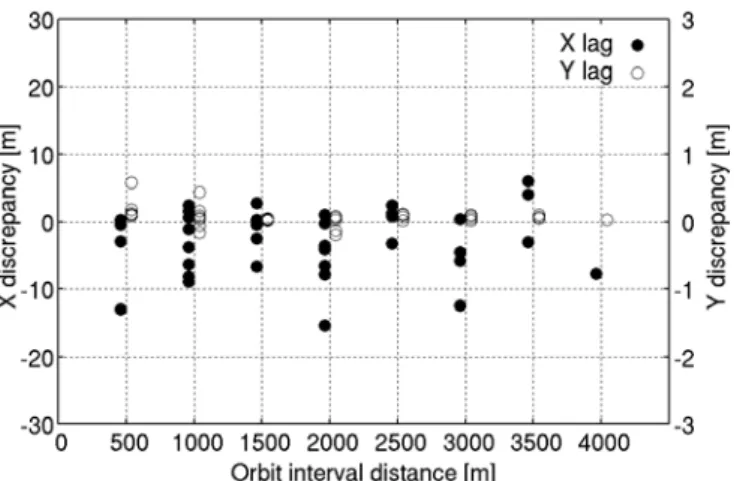
The proposed technique was further applied to other 34 orbit combinations in simulation. The orbits are parallel to each other. The orbit distance of these cases ranges from 500m to 4000m in X direction. Figure 4 shows the discrepancy of estimated orbit positions from the true positions. As shown in the figure, the discrepancy remains in the range of +/- 10m in X-lag direction in most of cases. In Y-lag direction, the discrepancy is smaller than a metre.
From this simulation result, we can conclude that the performance of proposed technique is good enough in determining the closely located orbits to carry out 2-D SAR imaging of LRS.
- 203 -
Figure 2. 2D cross-correlation SAR images of Fig.1. (a) orbits A and B, (b) orbits B and C, and (c) orbits A and C. Note that correlation peaks appear at the lags that correspond to the relative position of orbits.
Figure 3. 2D cross-correlation of SAR images of Fig.1. (a) orbits A and B, (b) orbits B and C, and (c) orbits A and C. Parabolid is fitted to these result with the Least Square Method to find the interpolated correlation peak position.
- 204 -
Figure 4. Discrepancy of estimated relative orbit position from the true position. Closed circles denote the discrepancy in the X direction (axis on the left) and open circles denote in Y direction (axis on the right).
4. Conclusion
The performance of the proposed technique was satisfactory in the simulation.
However, before it is applied to the actual LRS observation data, following two issues should be addressed.
(1) In the simulation, only parallel orbits cases were studied. Actual orbits are not always parallel to each other and not always in the same plane, either. Such cases must be studied in simulation, too.
(2) In the actual LRS observation, the PRF is not 60Hz but 20Hz, therefore the resultant SAR image suffers aliasing noise since the expected maximum Doppler frequency of lunar surface reflection echo is 37Hz.
These issues are now studied.
5. Acknowledgements
The computer simulation was performed in collaboration with Information Synergy Center, Tohoku University, Japan.
6. References
Ono, T., and H. Oya, Lunar Radar Sounder (LRS) experiment on-board the SELENE spacecraft, Earth Planets Space, 52, 629-637, 2000
Kobayashi, T., H. Oya, and T. Ono, B-scan analysis of subsurface radar sounding of lunar highland region, Earth Planets Space, 54, 983-991, 2002
Kobayashi, T., and T. Ono, SAR/InSAR observation by an HF sounder, Jounal of Geophys. Res., 112, E03S90, doi:10.1029/2005JE002576, 2007