1. Introduction
Mapping of land use/land cover is one of the main issues in remote sensing using various sensor images.
Accuracy of classification is still the important main issue in the mapping of land use/land cover. To improve the accuracy of classification, many researchers have
proposed various classification methods especially focusing on advanced classifiers or multi-source data fusion. The classification methods using the spectral index images are very easy and useful to improve the classification accuracy. The classification method based on spectral index image combination improves the classification accuracy using only band information
Analysis on the Effect of Spectral Index Images on Improvement of Classification Accuracy
of Landsat-8 OLI Image
Abraham T. Magpantay
1)· Rossana T. Adao
2)· Joferson L. Bombasi
2)· Ace C. Lagman
3)· Elisa V. Malasaga
2)· Chul-Soo Ye
4)†Abstract: In this paper, we analyze the effect of the representative spectral indices, normalized difference vegetation index (NDVI), normalized difference water index (NDWI) and normalized difference built-up index (NDBI) on classification accuracies of Landsat-8 OLI image. After creating these spectral index images, we propose five methods to select the spectral index images as classification features together with Landsat-8 OLI bands from 1 to 7. From the experiments we observed that when the spectral index image of NDVI or NDWI is used as one of the classification features together with the Landsat-8 OLI bands from 1 to 7, we can obtain higher overall accuracy and kappa coefficient than the method using only Landsat-8 OLI 7 bands. In contrast, the classification method, which selected only NDBI as classification feature together with Landsat-8 OLI 7 bands did not show the improvement in classification accuracies.
Key Words: Normalized Difference Vegetation Index, Normalized Difference Water Index, Normalized Difference Built-up Index, Classification, Landsat-8
Korean Journal of Remote Sensing, Vol.35, No.4, 2019, pp.561~571
https://doi.org/10.7780/kjrs.2019.35.4.6 ISSN 1225-6161 ( Print )
ISSN 2287-9307 (Online)
Article
Received August 5, 2019; Revised August 12, 2019; Accepted August 21, 2019; Published online August 26, 2019
1)
Full-time Lecturer, College of Computer Studies, Far Eastern University Institute of Technology
2)
Assistant Professor, College of Computer Studies, Far Eastern University Institute of Technology
3)
Associate Professor, College of Computer Studies, Far Eastern University Institute of Technology
4)
Professor, Department of Aviation and IT Convergence, Far East University
†
Corresponding Author: Chul-Soo Ye ([email protected])
This is an Open-Access article distributed under the terms of the Creative Commons Attribution Non-Commercial License
(http://creativecommons.org/licenses/by-nc/3.0) which permits unrestricted non-commercial use, distribution, and reproduction in
any medium, provided the original work is properly cited.
without using any other special classifier or multi- source information except band information. The spectral index images in image classification have been used as a new band containing a specific characteristic on the earth surface.
The normalized difference vegetation index (NDVI) (Rouse, 1974), which is calculated from the two spectral reflectance measurements of near-infrared and red bands, is widely used for estimating the area with strong vegetation on the earth surface. In addition, normalized difference water index (NDWI) (Mcfeeters, 1996) and normalized difference built-up index (NDBI) (Zha et al., 2003) are also used for extraction of water body and built-up area, respectively.
Each spectral index is useful not only for estimating pixels with a specific property in land cover classification but also for improving accuracy of classification by combining it with other spectral index. For example, two spectral indices of the modified normalized difference water index (MNDWI) (Xu, 2006) and the automated water extraction index (AWEI) (Feyisa et al., 2014) were combined to extract water bodies from Landsat 8 Operational Land Imager (OLI) image (Japitana et al., 2019). The combination of the two water indices produced higher overall accuracy compared to other methods using two water index combination or single water index methods. The combination of NDWI and near infrared (NIR) reflectance for water body extraction produced remarkable improvement in classification accuracy (Ye, 2015). The overall accuracy and kappa coefficient of the NDWI and NIR combination method were 97.3% and 94.1%, respectively, while the NDWI method produced the overall accuracy of 89.5% and kappa coefficient of 69.6%. The combination of multiple feature images such as mean and variance of pixels within a local area and derivatives of pixels was also proposed to find the corresponding feature points between stereo images (Ye, 2007). Gao (1996) proposed the NDWI as a vegetation index to measure vegetation liquid water
from space, i.e., the NDWI is a complementary index for measuring vegetation strength. Thakkar et al. (2015) added NDVI and NDWI to classification features together with green, red and NIR bands of Indian Remote Sensing (IRS)-R2 satellite image and obtained improved classification accuracy of 7.95% compared to the classification method using original four bands.
The objective of this study is to analyze the effect of three representative indices, NDVI, NDWI and NDBI on improvement of classification accuracy. In this paper we evaluate the effectiveness of each index on improvement of classification accuracy by computing the classification accuracies of the methods of each index combination and three indices combination with Landsat-8 OLI seven bands, respectively. As a kind of feature selection problem, more spectral index images used in image classification may contribute to the improvement of classification accuracy. However, they do not necessarily contribute like that if one of the spectral index images has redundant property with other feature images. This study has the meaning of evaluating the redundancy of the three spectral index images in image classification and also analyze the effectiveness of each spectral index image on image classification.
In this paper, we first analyze the effect of combination of three spectral index images of NDVI, NDWI and NDBI and the Landsat-8 OLI band images based on our initial experiment (Park et al., 2018), in which three indices of NDVI, NDWI and NDBI were used together with Landsat-8 OLI seven bands for image classification.
After describing various spectral index image combina - tion with Landsat-8 OLI seven bands, we then evaluate the accuracies of classified images obtained from the various spectral index image combination.
2. Index-based Classification
The objective of this study is to analyze which of
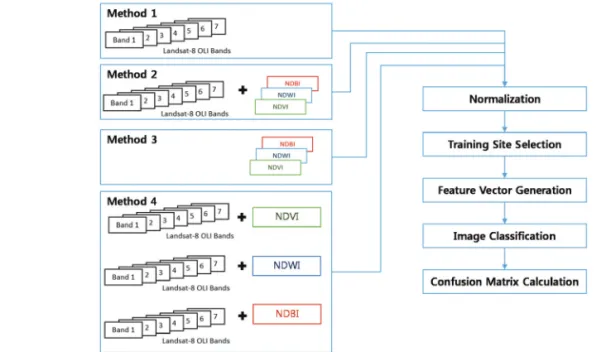
the spectral index images (NDVI, NDWI, NDBI) and Landsat- 8 OLI band (1 to 7) feature combination has a better accuracy for classifying the image into three classes, vegetation, built-up area, and water. In this study, four methods were proposed as feature image selection method as shown in Fig. 1.
In the method 1, we select Landsat-8 OLI bands from 1 to 7 as feature images used for image classification.
In the method 2, three spectral index images (NDVI, NDWI and NDBI) are used together with the Landsat- 8 OLI seven bands. The NDVI measures the vegetation area by using the red and NIR band images. We obtain the spectral index image using the following formula:
NDVI = (1) The NDWI and NDBI are derived from the following formulas, respectively:
NDWI = (2)
NDBI = (3) In the method 3, three spectral index images (NDVI, NDWI and NDBI) are used for image classification.
In the method 4, each spectral index image is used
together with the Landsat-8 OLI seven bands. We apply a simple histogram-based normalization to atmospheric correction to each band. We select minimum and maximum digital numbers (DNs) from the histogram of each band and rescale the DNs to eight-bit scale using the formula (4). To make sure that the pixels in the spectral index images and band images are in the range of 0 to 255, the Landsat-8 OLI bands and the obtained spectral index images are normalized using following formula:
I
O= · 255 (4) where I
INand I
Oare intensity values before and after normalization and I
MINand I
MAXare minimum and maximum intensity values in the image. For each of the defined classes, vegetation, built-up area and water, a training site is selected. An area of N × N pixels is selected as the training site for each of the classes with a predetermined starting point on the image. This training site is selected for all the band images and spectral index images included for each of the proposed method. After selecting the training site for each of the classes, the feature vector I is now ready to be NIR – Red
NIR + Red
NIR – Green NIR + Green SWIRI – NIR SWIRI + NIR
I
IN– I
MINI
MAX+ I
MINFig. 1. Flow of the index-based classification.
calculated. For each of the band and spectral index images used in the proposed method, the mean value is calculated from the training site area of each class.
The mean vector m of the training site for each class is computed using the formula:
m = I
k(5) where N × N is the total number of pixels belonging to the training site for each class.
After obtaining the feature vector I for each class, image classification is carried out using the minimum distance classifier for each method. We employ the minimum distance classifier in the image classification because it is a representative classifier, which does not need any assumption of spectral distribution of each class. We compute the vector distances from each pixel to the mean vector m of each class and find the class with a minimum distance from the pixel. To assess the resulting classified image obtained by each of the proposed methods, confusion matrix is constructed.
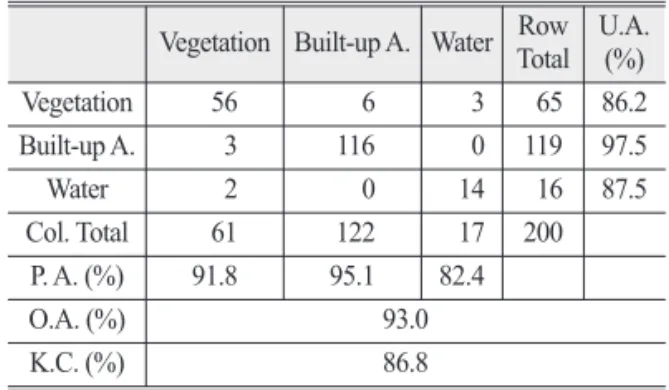
Using the confusion matrix, overall accuracy and kappa coefficient are obtained to measure the accuracy of each proposed method. Reference points are selected from
the image using the random sampling method. We generate two random numbers, which are used as the row and column coordinate values of each reference point, in the range 1 to height and width of image, respectively. For 200 reference points, we check whether each reference point belongs to a certain class.
3. Experimental Results 1) Study area and datasets
The image dataset used in this study was taken from Landsat-8 OLI bands 1 to 7 acquired on February 7, 2014. Fig. 2 shows two Landsat-8 OLI images of size 250 × 250 pixels over Metro Manila in Philippines and also three training sites of vegetation, built-up area and water. The training sites in site A and site B are 20 × 20 and 15 × 15 pixels in size, respectively. The site A contains large built-up area and vegetation area with relatively simple spectral characteristic, while the site B contains large vegetation area with more diverse spectral characteristic compared to the site A.
Three spectral index images of site A and site B were N · N 1
N·N
∑
k=1