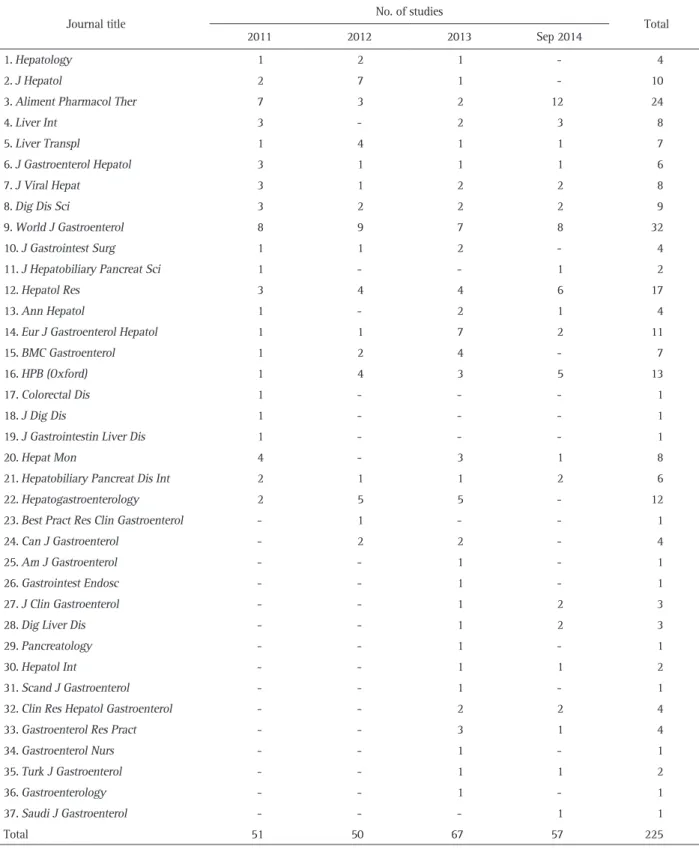
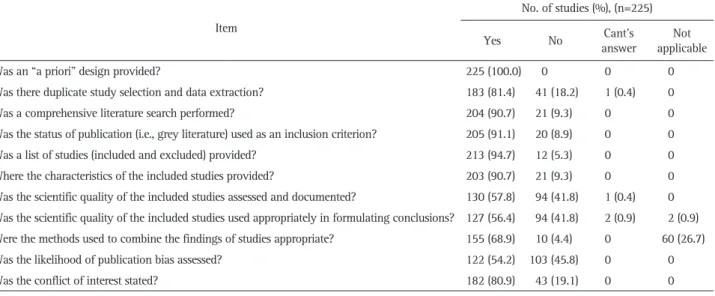
Assessment for Risk of Bias in Systematic Reviews and Meta-Analyses in the Field of Hepatology
6
0
0
전체 글
(2)
(3)
(4)
(5)
(6)
수치
관련 문서
웹 표준을 지원하는 플랫폼에서 큰 수정없이 실행 가능함 패키징을 통해 다양한 기기를 위한 앱을 작성할 수 있음 네이티브 앱과
_____ culture appears to be attractive (도시의) to the
In utilizing negative feedback to improve the properties of an amplifier under design, the starting point in the design is the selection of the feedback topology appropriate
When the price of an item declines, the substitution effect always leads to an increase in the quantity demanded of the good.. Income
The index is calculated with the latest 5-year auction data of 400 selected Classic, Modern, and Contemporary Chinese painting artists from major auction houses..
26 In the present analysis, the combination of the AP and the following NP is thus not a constructional constraint, but is licensed by the lexical properties of the degree
1 John Owen, Justification by Faith Alone, in The Works of John Owen, ed. John Bolt, trans. Scott Clark, "Do This and Live: Christ's Active Obedience as the
The problem of atom migration can be solved by considering the thermodynamic condition for equilibrium; namely that the chemical potential of an atom must be the same
