571
Copyright © 2019 The Korean Society of Fisheries and Aquatic Science pISSN:0374-8111, eISSN:2287-8815
서 론
생선연육
(surimi
또는fish meat paste)
은어묵,
게맛살,
어육 소시지,
어육스낵등다양한수산가공식품의주요한원료로이 용되고있다.
생선연육은어육의마쇄및수세공정을통해근 원섬유단백질을농축한후냉동변성방지제를첨가하여제조 된다(Heu et al., 2011; Oh et al., 2018).
생선연육의품질과등 급은겔강도,
수분함량,
백색도,
불순물의함량등에의해결정 되는데,
일반적으로백색육어류가품질이뛰어난것으로알려 져있다(Park and Morrissey, 2000; Sampels, 2015).
생선연육 을이용한가공식품의조직감은어종과연육등급에가장큰영향을받으며
,
또한부재료로사용되는전분등도영향을미친 다(Jin et al., 2007).
최근생선연육을이용한스낵은아시아지 역을중심으로다양한제품이상용화되었으며,
많은연구자들 에의해생선연육스낵의품질특성조사및제조공정개발연구 가활발하게이루어지고있다(Ramesh et al., 2018).
생선연육 스낵의가공공정은일반적으로1)
생선연육에부원료를첨가한후특정한형태로성형하는공정
, 2)
성형된혼합원료를건조하는공정
, 3)
건조한중간단계반제품을굽거나유탕처리하여최종제품을생산하는공정으로나눌수있다
.
특히,
건조공 정의조건에따라생선연육스낵의수분함량,
경도,
관능적조 직감에변화가발생하여생선연육스낵의품질에영향을미치반응표면분석법을 이용한 생선연육 스낵의 건조조건 최적화
김성희·채지연·최기범·김종민·이지호·김선봉·김영목·김진수
1·이정석
2·조승목*
부경대학교 식품공학과/식품연구소, 1경상대학교 해양식품생명의학과/해양산업연구소, 2경상대학교 수산식품산업화 기술지원센터
Optimizing the Drying Conditions of Surimi Snacks Using a Response Surface Methodology
Seonghui Kim, Jiyeon Chae, Gibeom Choi, Jongmin Kim, Jiho Lee, Seon-Bong Kim, Young-Mog Kim, Jin-Soo Kim
1
, Jung-Suck Lee2
and Suengmok Cho*Department of Food Science and Technology/Institute of Food Science, Pukyong National University, Busan 48513, Korea
1Department of Seafood and Aquaculture Science/Institute of Marine Industry, Gyeongsang National University, Tongyeong 53064, Korea
2Research Center for Industrial Development of Seafood, Gyeongsang National University, Tongyeong 53064, Korea
Surimi has been widely investigated for developing fish snacks; however, few studies have examined the optimal drying conditions of surimi for fish snacks. This study used a response surface methodology to optimize the drying conditions for the overall acceptance of fish snacks. The drying temperature ( X
1, 51-65°C) and drying time ( X
2, 1.5- 2.5 h) were chosen as independent variables. The dependent variables were overall acceptance ( Y
1, points), hardness ( Y
2, N), moisture content of the dried intermediate product ( Y
3, %), and volatile basic nitrogen of the fried final product ( Y
4, mg/100 g). The estimated optimal conditions for overall acceptance ( Y
1) were X
1=64°C and X
2=2 h.
The predicted values of the dependent variables at the optimal conditions were overall acceptance ( Y
1)=8.60 points, hardness ( Y
2)=10.07 N, and moisture content of the dried intermediate product ( Y
3)=10.00% and were similar to the experimental values. Scanning electron microscopy images revealed that the drying conditions affected the micro- structure of the fish snacks. Our results could be used to increase the productivity of fish snacks made by small- and mid-sized seafood companies.
Key words: Drying condition, Fish snack, Quality, Response surface methodology, Surimi snack
*Corresponding author: Tel: +82. 51. 629. 5833 Fax: +82. 51. 629. 5824 E-mail address: [email protected]
This is an Open Access article distributed under the terms of the Creative Commons Attribution Non-Commercial Licens (http://creativecommons.org/licenses/by-nc/3.0/) which permits unrestricted non-commercial use, distribution, and reproduction in any medium, provided the original work is properly cited.
Received 14 November 2019; Revised 25 November 2019; Accepted 26 November 2019 저자 직위: 김성희(대학원생), 채지연(대학원생), 최기범(학부생), 김종민(학 부생), 이지호(학부생), 김선봉(교수), 김영목(교수), 김진수(교수), 이정석(교 수), 조승목(교수)
https://doi.org/10.5657/KFAS.2019.0571
Korean J Fish Aquat Sci 52(6), 571-579, December 2019
게된다
(Debnath et al., 2003).
건조조건이생선연육스낵의품 질에대한영향에대한연구가중요함에도불구하고그동안관 련된연구가거의이루어지지않았다.
또한,
일반적인생선연육 스낵제조공정중혼합원료를중간단계반제품으로건조하는 데약6 h
이소요되어생산성증대의방해요인이되고있다.
이 러한관점에서볼때,
본연구를통해생선연육스낵제조를위 한중간단계반제품의적정건조조건을찾는것또한의미가클 것으로사료된다.
본연구에서는생선연육스낵의제조에있어주요공정에해 당하는건조공정을건조온도및건조시간을변수로설정하여 모니터링하였으며
,
기호도가높은생선연육스낵을제조할수 있는최적조건을구명하였다.
통계적기법으로 반응표면분석 법(response surface methodology, RSM)
을이용하였으며,
독 립변수로는건조온도(X
1, °C)
및건조시간(X
2, h),
종속변수로 는종합적기호도(Y
1),
경도(Y
2),
중간단계반제품의수분함량(Y
3)
및VBN (Y
4)
을설정하였다.
건조조건에따른스낵의물성 변화에대해알아보기위하여주사전자현미경(scanning elec- tron microscope, SEM)
을이용하여연육스낵의미세구조를조 사하였다.
이를통하여생선연육스낵제조시건조조건을최적 화하여스낵제품의생산성을증가시키고자하였다.
재료 및 방법
재료
주원료인명태
(Theragra chalcogramma)
냉동연육은알래스 카산RA
등급으로㈜
블루션(Busan, Korea)
에서 구입하였다.
명태냉동연육은 실험에사용되는 동안-80°C
의심온동결고(CLN-52U; Nihon Freezer Co., Ltd., Saitama, Japan)
에서보 관하면서실험에사용하였다.
유탕처리생선연육스낵의제조 에사용된팜유와베이킹파우더는㈜
오뚜기(Anyang, Korea)
에서,
소금은㈜
사조해표(Seoul, Korea)
에서,
칡 전분은(
유)
지엠대진(Seoul, Korea)
에서,
쌀이첨가된탄수화물페이퍼는㈜M&F (Goyang, Korea)
에서각각구입하여사용하였다.
이 외에실험에사용된모든시약및화학물질은분석등급을사 용하였다.
명태 연육스낵의 제조
명태연육스낵은명태냉동연육
(57.5 g),
칡전분(1.5 g),
소금(1 g),
베이킹파우더(1 g),
황태가루(2.5 g),
정제수(28.5 g)
를 일정비율로silent cutter (5 L; Goodprice Foodmachine Co., Kimpo, Korea)
에넣고분쇄하면서혼합하였다.
이때명태냉 동연육을먼저5 min
분쇄하고나머지부원료를3
회에걸쳐나 누어첨가함으로써효율적으로균질화하였다.
성형공정은실리콘받침판위에
1 mm
두께의폴리프로필렌성형틀을올려놓은후
,
혼합된원료를주걱으로발라서성형하였다.
이후열 풍건조기(WFO-700; EYELA Co., Japan)
에서건조조건에따라
1
차건조공정을실시한다음쌀이첨가된탄수화물페이퍼를 이용하여코팅공정을거친후50°C, 20 min
동안2
차건조공정 을실시하였다.
건조된원료를190°C
의튀김기(BS-1820-DF, BSW Co., China)
에서약40 s
간유탕처리하여생선연육스낵 을제조하였다.
반응표면분석법 설계
본 연구에서는 반응표면분석법
(RSM)
중 중심합성계획법(central composite design)
을이용하여실험을설계하였다.
독 립변수(independent variable)
로는건조온도(X
1, °C),
건조시간(X
2, h)
을설정하였으며,
종속변수(dependent variable)
로는종 합적기호도(Y
1, score),
경도(Y
2, N),
중간단계반제품의수분 함량(Y
3, %)
및VBN (Y
4, mg/100g)
을설정하였다.
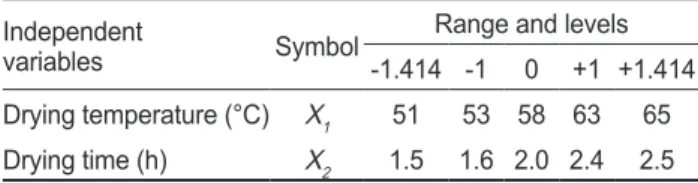
실험범위 에따라독립변수건조온도및건조시간에대한부호화및부호 화되지않은실제실험값을Table 1
에나타내었다.
독립변수의 범위는예비실험의결과를토대로설정되었다.
본연구는4
개 의factorial points, 4
개의axial points, 3
개의center points
로실 험을구성하였다. Table 2
에나타낸11
개의실험군들은통계적 인오차를줄이기위해무작위적인순서로진행되었다. 반응표면분석법 통계분석 및 최적화
Table 2
와같이실험을통해얻어진종속변수(
반응변수)
의값 들은MINTAB
통계프로그램(Version 16, MINITAB, Penn- sylvania, USA)
을이용하여분석하였으며,
다음과같은이차 회귀식을도출하였다.
4 4 3 4
Y= β
0+∑β
iX
i+∑β
iiX
i2+∑ ∑ β
ijX
iX
ji=1 i=1 i=1j=i+1
여기서
Y
는종속변수β
0는상수, β
i, β
ii, β
ij는회귀계수, X
i, X
j는 독립변수이다.
생선연육스낵의건조조건최적화는MINTAB
통계프로그램의response optimizer
를통해이루어졌으며,
통 계적으로 추정된최적조건 하에서실제 실험을통하여얻어 진종속변수의값과의비교를통해추정된종속변수의값을검 증하였다.
또한3
차원그래프는MAPLE software (MAPLE Ver.7, Maple Soft, Waterloo, Canada)
를이용하여작성하였다. 경도
생선연육 스낵의 경도
(hardness)
측정은rheometer (CR-
Table 1. Experimental range and values of independent variables in the central composite design for hot-air drying processing in preparation of the surimi snack
Independent
variables Symbol Range and levels
-1.414 -1 0 +1 +1.414 Drying temperature (°C) X1 51 53 58 63 65 Drying time (h) X2 1.5 1.6 2.0 2.4 2.5
100D; Sun Scientific Co., Ltd., Japan)
을이용하였으며,
측정 조건은mode 20, load cell 2 kg, penetration speed 120 mm/
min, plunger diameter 15 mm (No. 1)
였다.
무작위로선정된10
개의연육스낵을시료홀더에올려놓고경도를측정하였다. 수분
수분함량
(%)
은 적외선 수분측정기(MX-50; A&D, Tokyo, Japan)
를이용하여측정하였다.
휘발성 염기질소
휘발성염기질소
(volatile basic nitrogen, VBN)
의측정은식품공전상의
conway unit
을사용하는미량확산법을일부수정하여
3
회반복실시하였다(MFDS, 2019).
분쇄한시료10 g
에 증류수50 mL
를가하여30 min
교반하였다.
교반후원심분 리기(1580R; LABOGENE Co., Korea)
를이용하여1,107 g
의 속도로10 min
용액을원심분리하였다.
원심분리후얻어지는상층액을여과시킨후
5% H
2SO
4를이용하여pH 4.5
로보정하 였다.
보정된용액을100 mL
로정용하고,
이를sample
용액으 로이용하였다. Conway unit
내실에는0.01 N H
2SO
41 mL,
외 실에sample
희석액1 mL
및포화K
2CO
3를1 mL
를각각첨가 하고25°C
에서1 h
동안반응시켰다.
반응이끝난다음내실에brunswik
지시약을1-2
방울을첨가한후0.01 N NaOH
적정하 여VBN
값을산출하였다.
관능평가
관능평가는부경대학교식품공학과식품화학실험실소속
22
세에서27
세사이의훈련된전문패널10
인(
남성5
명및여성5
명)
을구성하여수행되었으며,
모든패널은맛에친숙되도록1
개월간훈련되었다.
관능적기호도의척도가되는외관,
색,
향,
맛,
바삭함(crispiness)
및종합적기호도에대하여9
점평점법(1
점,
대단히나쁘다; 5
점,
나쁘지도좋지도않다; 9
점,
대단히 좋다)
으로평가하였다.
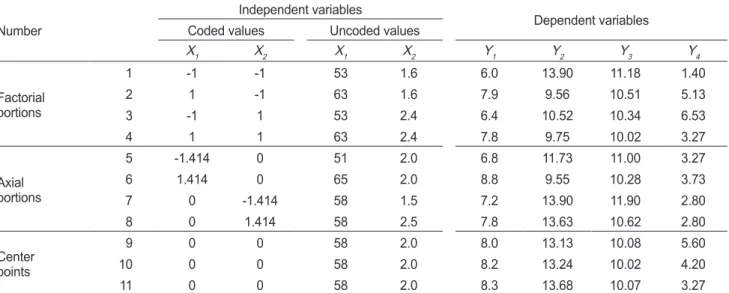
종합적기호도가다른평가지표와유사 Table 2. Central composite design matrix and values of dependent variables for hot-air drying processing in preparation of the surimi snackNumber
Independent variables
Dependent variables Coded values Uncoded values
X1 X2 X1 X2 Y1 Y2 Y3 Y4
Factorial portions
1 -1 -1 53 1.6 6.0 13.90 11.18 1.40
2 1 -1 63 1.6 7.9 9.56 10.51 5.13
3 -1 1 53 2.4 6.4 10.52 10.34 6.53
4 1 1 63 2.4 7.8 9.75 10.02 3.27
Axial portions
5 -1.414 0 51 2.0 6.8 11.73 11.00 3.27
6 1.414 0 65 2.0 8.8 9.55 10.28 3.73
7 0 -1.414 58 1.5 7.2 13.90 11.90 2.80
8 0 1.414 58 2.5 7.8 13.63 10.62 2.80
Center points
9 0 0 58 2.0 8.0 13.13 10.08 5.60
10 0 0 58 2.0 8.2 13.24 10.02 4.20
11 0 0 58 2.0 8.3 13.68 10.07 3.27
X1, Drying temperature (°C); X2, Drying time (h); Y1, Overall acceptance (points); Y2, Hardness (N); Y3, Moisture content of dried interme- diate product (%); Y4, VBN of fried final product (mg/100 g).
Table 3. Estimated coefficients of the fitted quadratic polynomial equations for dependent variables based on the t-statistic
Parameters Y1 Y2 Y3 Y4
Coefficient P-value Coefficient P-value Coefficient P-value Coefficient P-value
Constant 8.167 0.001 13.350 0.001 10.057 0.001 4.357 0.001
X1 0.766 0.004 -1.024 0.033 -0.251 0.057 0.140 0.729
X2 0.144 0.381 -0.446 0.258 -0.393 0.012 0.409 0.333
X1X1 -0.340 0.115 -1.673 0.010 0.182 0.192 -0.195 0.685
X2X2 -0.490 0.040 -0.110 0.802 0.492 0.010 -0.545 0.284
X1X2 -0.125 0.580 0.892 0.131 0.087 0.570 -1.748 0.023
X1, Drying temperature (°C); X2, Drying time (h); Y1, Overall acceptance (points); Y2, Hardness (N); Y3, Moisture content of dried interme- diate product (%); Y4, VBN of fried final product (mg/100 g).
한경향을나타내어대표성을가지는종합적기호도를종속변 수로설정하였다
.
주사전자현미경
연육스낵의표면미세구조를관찰하기위해주사전자현미경
(LV-SEM; JSM-6490LV, JEOL Ltd., Japan)
을이용하였다.
건조된시료는동결건조기
(CoolSafe; Lynge, Denmark)
에서12 h
완전히건조하였으며,
유탕된시료는유지를제거하기위하 여90% petroleum ether
에서24 h
침지후완전히건조하였다.
시료를
1×0.5 cm
자른후금으로도금하여전도성을갖게하였다
(Nath and Chattopadhyay, 2008).
주사전자현미경을이용 하여가속전압15 kV
로관찰하였다.
Table 4. Response surface model equations for monitoring effects of the independent variables on the dependent variables in the hot-air drying processing
Quadratic polynomial model equations R2 P-value
Y1=8.167+0.766 X1+0.144 X2-0.340 X12-0.490 X22-0.125 X1X2 0.880 0.024 Y2=13.350-1.024 X1-0.446 X2-1.673 X12-0.110 X22+0.892 X1X2 0.860 0.034 Y3=10.057-0.251 X1-0.393 X2+0.182 X12+0.492 X22+0.087 X1X2 0.884 0.022 Y4=4.357+0.140 X1+0.409 X2-0.195 X12-0.545 X22-1.748 X1X2 0.725 0.155 X1, Drying temperature (°C); X2: Drying time (h), Y1, Overall acceptance (points); Y2, Hardness (N); Y3, Moisture content of dried interme- diate product (%); Y4, VBN of fried final product (mg/100 g).
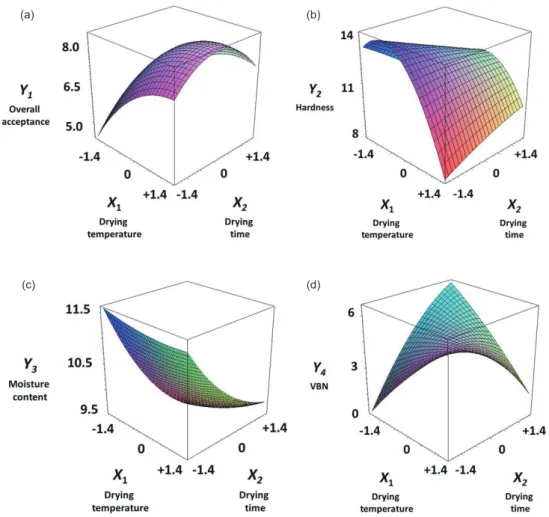
Fig. 1. Three-dimensional response surface plots for overall acceptance (a), hardness (b), moisture content of dried intermediate product (c), and VBN of fried final product (d). X1, Drying temperature (°C); X2, Drying time (h).
100 ㎛
X 100
100 ㎛
X 100
100 ㎛
X 100
No. 7 (58°C, 1.5 h)Moisture content, 11.9% No. 4 (63°C, 2.4 h)
Moisture content, 10.02%
(a)
100 ㎛
X 100 (b)
(c) (d)
(a) (b)
(c) (d)
결과 및 고찰
반응표면 모델식의 진단
Table 2
는실험설계와그에따른건조조건(
독립변수의조합)
에서제조된생선연육스낵의품질특성(
종속변수)
에대한측 정값을나타낸다.
각각의독립변수가종속변수에미치는영향 을알아보기위해서는2
차회귀방정식의도출이필요한데(Be- zerra et al., 2008),
이러한반응표면모델방정식은최소제곱법이라고불리는통계적접근방식으로도출될수있다
(Bas and Boyacı, 2007). 4
가지종속변수에대한일차항(X
1, X
2),
이차항(X
1X
1, X
2X
2)
및교차항(X
1X
2)
의결과는Table 3
와같다.
모든 종속변수에대한상수(constant)
계수의유의수준은0.001
로통 계적으로유의한것으로나타났다(P<0.05).
종속변수Y
1(
종합 적기호도)
의경우X
1,
및X
2X
2항이,
종속변수Y
2(
경도)
의경 우X
1및X
1X
1항이,
종속변수Y
3(
중간단계반제품의수분함 량)
의경우X
2및X
2X
2하이,
종속변수Y
4의(VBN)
의경우X
1X
2Table 5. Analysis of variance for dependent variables
Dependent variables Sources DF SS MS F-value P-value
Y1
Regression
Linear 2 4.85959 2.42980 13.60 0.010
Square 2 1.59004 0.79502 4.45 0.078
Interaction 1 0.06250 0.06250 7.58 0.580
Residual
Lack of fit 3 0.84666 0.28222 12.10 0.077
Pure error 2 0.04667 0.02333
Total 10 7.40545
Y2
Regression
Linear 2 9.9854 4.9927 5.10 0.062
Square 2 16.6979 8.3906 8.53 0.024
Interaction 1 3.1862 8.3490 3.25 0.131
Residual
Lack of fit 3 4.7251 1.5750 18.60 0.051
Pure error 2 0.1694 0.0847
Total 10 34.7641
Y3
Regression
Linear 2 1.73673 0.86836 10.49 0.016
Square 2 1.37726 0.68863 8.32 0.026
Interaction 1 0.03062 0.03062 0.37 0.570
Residual
Lack of fit 3 0.41174 0.13725 132.82 0.007
Pure error 2 0.00207 0.00103
Total 10 3.55842
Y4
Regression
Linear 2 1.4936 0.7468 0.64 0.565
Square 2 1.6861 0.8431 0.72 0.530
Interaction 1 12.2150 12.2150 10.47 0.023
Residual
Lack of fit 3 3.0798 1.0266 0.75 0.616
Pure error 2 2.7513 1.3756
Total 10 21.2258
DF, Degrees of freedom; SS, Sum of square; MS, Mean square; Y1, Overall acceptance (points); Y2, Hardness (N); Y3, Moisture content of dried intermediate product (%); Y4, VBN of fried final product (mg/100 g).
김성희
ㆍ
채지연ㆍ
최기범ㆍ
김종민ㆍ
이지호ㆍ
김선봉ㆍ
김영목ㆍ
김진수ㆍ
이정석ㆍ
조승목576
항이각각통계적으로유의한것으로나타났다
(P<0.05). 4
가지 종속변수에대한반응표면모델식과통계적유의성은Table 4
와같다.
도출된반응표면모델식의결정계수(R
2)
값은실험설 계의적합성을의미하는중요한통계적지표이다(Shishir et al., 2016).
종속변수Y
1, Y
2및Y
3의결정계수(R
2)
는각각0.880, 0.860
및0.884
로1
에가까운값을보였으며,
통계적유의성을 나타내었다(P<0.05).
종속변수Y
4의경우,
결정계수(R
2)
값이0.725
로다른종속변수에비해낮았으며P-value
가0.155
로유 의성이나타나지않았다분산분석
본 실험에 대한 반응표면 모델 방정식의 통계적 유의성은
ANOVA (analysis of variance)
에의해평가되었다.
반응표면 모델방정식의독립변수와종속변수간의상관관계를ANOVA
로살펴본결과는Table 5
와같다.
종속변수Y
1(
종합적기호 도)
은일차항(linear),
종속변수Y
2(
경도)
는이차항(square),
종 속변수Y
3(
중간단계반제품의수분함량)
은일차항및이차항 그리고종속변수Y
4(VBN)
는교차항(interaction)
이각각통계 적으로유의한것으로나타났다(P<0.05).
적합성결여(lack of
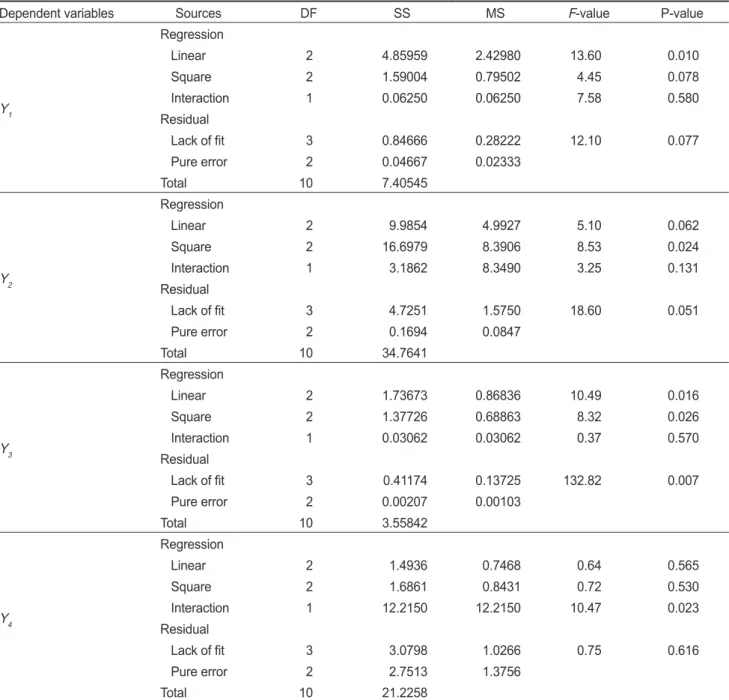
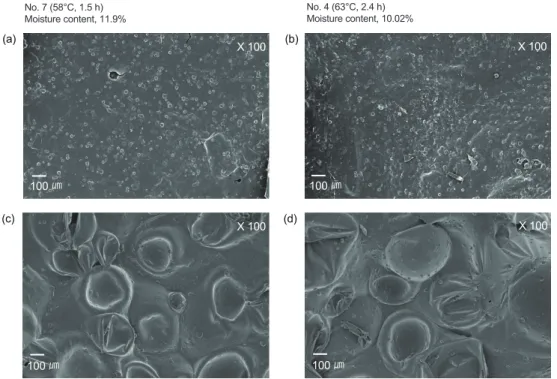
Fig. 2. Scanning electron microscope (SEM) images of dried intermediate products and fried final products. (a) Intermediate product dried at 58°C for 1.5 h. (b) Intermediate product dried at 63°C for 2.4 h. (c) Fried final product from intermediate product dried at 58°C for 1.5 h.(d) Fried final product from intermediate product dried at 63°C for 2.4 h.
100 ㎛
X 100
100 ㎛
X 100
100 ㎛
X 100
No. 7 (58°C, 1.5 h)Moisture content, 11.9% No. 4 (63°C, 2.4 h)
Moisture content, 10.02%
(a)
100 ㎛
X 100 (b)
(c) (d)
(c) (d)
Table 6. Response optimization for hot-air drying of the intermediate product for preparation of surimi snack
Optimal conditions
X1 (Drying temperature, °C) X2 (Drying time, h) Coded value Actual value Coded value Actual value
1.129 64 0.014 2
Y1 (Overall acceptance, points)
Target value
Max
fit)
테스트를통해반응표면모델의적합성을검정할수있는 데P-value
가0.05
보다크면적합한모델로간주된다(Isa et al., 2011).
종속변수Y
3(
중간단계반제품의수분함량)
의적합성 결여에대한P-value
는0.007
로0.05
보다낮아설계된반응표 면모델이완전하지않은것으로나타났으나다른종속변수는 모두통계적으로유의성을가지는것으로나타났다.
반응표면 3차원 그래프 및 인자의 영향 분석
생선연육을건조시키는방법중에열풍건조는초기투자비용 이저렴하고빠른건조가가능하다는장점으로널리사용되어 왔다
(Hu et al., 2013).
일반적으로건조온도및건조시간은스 낵을제조하는데있어중요한요소로고려된다(Caixeta et al., 2002; Zhao et al., 2017).
종속변수에대한독립변수건조온도(X
1)
및건조시간(X
2)
이미치는영향을3
차원그래프로표현하 여Fig. 1
에나타내었다.
종합적기호도(Y
1)
는건조온도(X
1)
가51°C (-1.414)
에서65°C (+1.414)
로높아질수록증가하는경 향을나타내었고,
건조시간(X
2)
이코드값0
인2 h
에서가장높 게나타났다.
건조온도(X
1)
가높을수록 종합적기호도(Y
1)
는 높게나타났는데,
이는관능평가시함께평가되었던바삭함과 같은경향을나타내었다.
이는바삭함이종합적인기호도에큰 영향을미친것을알수있었으며, Lujan-Acosta and Moreira
(1997)
은유탕제품의경우바삭함과같은조직감이소비자의기호도에중요한변수로작용한다는것을보고하였다
.
경도(Y
2)
는건조온도(X
1)
가51°C (-1.414)
에서65°C (+1.414)
로높아질수록감소하는경향을나타내었지만건조시간(X
2)
은1.5 h (-1.414)
에서2.5 h (+1.414)
로길어질수록소폭증가하 였다. Table 3
에서건조온도(X
1)
는경도에유의한(P<0.05)
영 향을미치는것으로나타났으나건조시간(X
2)
은큰영향을미 치지않았다(P>0.05).
이를통해건조온도(X
1)
가경도(Y
2)
에영 향을미치는주요한독립변수임을확인할수있었다.
경도(Y
2)
는스낵의바삭함(crispiness)
을나타낼수있는값으로스낵의 매우중요한품질요인이며,
기호성에지대한영향을미친다(Bruns and Bourne, 1975).
일반적으로경도가낮을수록바삭 함이증가하는경향을나타낸다(Nurul et al., 2009).
이는본실 험에서상대적으로고온건조된스낵에서바삭함에대한높은 기호도와낮은경도값이나온결과와일치한다.
중간단계반제품의수분함량
(Y
3)
은건조온도(X
1)
가높아지 고건조시간(X
2)
이길어질수록 감소하는경향을나타내었다.
일반적으로중간단계반제품의수분함량은유탕시스낵의경 도와밀접한상관성을가진다(Nath and Chattopadhyay, 2007).
생선연육스낵의중간단계반제품의수분함량이가장높은실 험군
7
번(58°C
및1.5 h)
과가장낮은실험군4
번(63°C
및2.4 h)
의미세구조(×100)
를주사전자현미경으로관찰하였다(Fig.
2).
식품의미세구조는조직감과밀접한관련이있는것으로많 은선행연구를통해잘알려져있다(Ahza et al., 2015).
수분함 량이낮은중간단계반제품(4
번실험군)
이상대적으로기포가없으며전분입자로추정되는입자들의간격이치밀하고유탕 시전분입자들이더욱크게팽윤하는것을알수있었다
(Nawaz et al., 2019).
또한중간단계반제품의수분함량(Y
3)
범위는약10.02%
에서11.90%
로나타났으며,
유탕완제품의경우모두1%
이하로차이가나타나지않았다(
데이터미제시).
생선스낵의경우유탕시팽창을많이할수록바삭함이증가한다고보고 하였다
(Paranginangin et al., 1997).
VBN (Y
4)
은건조온도(X
1)
가51°C (-1.414)
에서65°C (+1.414)
로증가할수록증가하는경향을나타내었지만반응표면모델식 의결정계수(R
2)
가낮고통계적인유의성이나타나지않았다.
이를통해본연구에서설정한건조조건범위에서는VBN (Y
4)
을모니터링하기에는적합하지않은것을알수있었다. VBN
(Y
4)
은신선한원료에는없거나미량함유되어있는성분으로선도저하에따라생성되어증가하는데
,
이러한특성으로인해 어패류의선도판정에주요한지표로널리이용되고있다(Lee et al., 2016). VBN
에의한어류의품질평가 시일반적으로5-10 mg/100 g
은극히신선한어육, 15-25 mg/100 g
은보통선 도의어육, 30-40 mg/100 g
은부패초기의어육및50 mg/100
g
이상인경우부패정도가심한어육으로판정한다(Song et
al., 2005).
생선연육스낵의건조조건에서의VBN
값은모두8
mg/100 g
이하로극히신선한어육으로판정되었다.
이러한결과를통해설정된건조조건의범위안에서는생선연육스낵의 선도에영향을미치지않는다는것을알수있었다
.
건조조건의 최적화 및 검증
본연구에서는기호도가우수한생선연육스낵을제조하기위 하여종속변수
Y
1(
종합적기호도)
를최대화시킬수있는최 적의건조조건을통계적으로도출하였다.
종속변수Y
2(
경도)
및Y
3(
중간단계반제품의수분함량)
의경우품질특성의변 화를알아보기위하여모니터링하였다.
통계적인최적화결과,
종속변수Y
1(
종합적기호도)
의최대값을 나타내는독립변수 건조온도(X
1)
및건조시간(X
2)
의코드값(
실제값)
은각각1.129 (64°C)
및0.014 (2 h)
도출되었다(Table 6).
이러한최적건조조 건에서의생선연육스낵의종합적기호도(Y
1)
의예측값은8.6
점이었다.
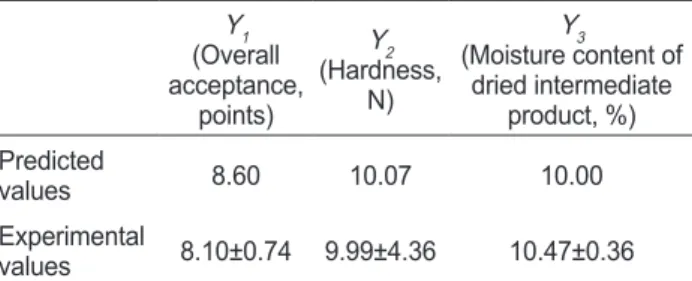
통계적으로최적화된독립변수의조건에추정된종 속변수의값은실제최적조건하에서실험된실제값과의비교Table 7. Verification of predicted values Y1
(Overall acceptance,
points)
Y2 (Hardness,
N)
Y3
(Moisture content of dried intermediate
product, %) Predicted
values 8.60 10.07 10.00
Experimental
values 8.10±0.74 9.99±4.36 10.47±0.36 Optimized conditions: drying temperature=64°C; drying time=2 h.
를통해검증을해야한다
(Cho et al., 2005; Yoon et al., 2017).
본논문에서
VBN
은설정된건조조건범위안에서생선연육스 낵의선도에영향을미치지않으므로VBN
값을제외한최적 건조조건(
건조온도, 64°C
및 건조시간2 h)
에서실제제조된 생선연육스낵의종합적기호도(Y
1),
경도(Y
2)
및중간단계반 제품의수분함량(Y
3)
은각각8.10±0.74
점, 9.99±4.36 N
및10.47±0.36%
으로나타났다.
이러한실체측정값은통계적인예측값과크게차이가나지않다는것을확인하였다
(Table 7).
본연구는
fish snack
의생산성증대를위하여생선연육스낵제 조를위한중간단계반제품의최적건조조건을설정하였고,
종 합적기호도가최대가되는건조조건을제시하였다.
사 사
이논문은
2019
년해양수산부재원으로해양수산과학기술진흥원의지원을받아수행된연구임
(
해역별특성을고려한전통 수산가공식품개발및상품화).
References
Ahza AB, Fidiena TI and Suryatman S. 2015. Physical, senso- rial and chemical characteristics of simulated chips of cas- sava (Manihot esculenta Crantz): Rice (Oryza sativa L.) mix. Procedia Food Sci 3, 82-95. https://doi.org/10.1016/j.
profoo.2015.01.008.
Baş D and Boyacı IH. 2007. Modeling and optimization I: Us- ability of response surface methodology. J Food Eng 78, 836-845. https://doi.org/10.1016/j.jfoodeng.2005.11.024.
Bezerra MA, Santelli RE, Oliveira EP, Villar LS and Escaleira LA. 2008. Response surface methodology (RSM) as a tool for optimization in analytical chemistry. Talanta 76, 965- 977. https://doi.org/10.1016/j.talanta.2008.05.019.
Bruns AJ and Bourne MC. 1975. Effects of sample dimensions on the snapping force of crisp foods experimental verifica- tion of a mathematical model. J Texture Stud 6, 445-458.
https://doi.org/10.1111/j.1745-4603.1975.tb01420.x.
Caixeta AT, Moreira R. and Castell-Perez ME. 2002. Impinge- ment drying of potato chips. J Food Process Eng 25, 63-90.
https://doi.org/10.1111/j.1745-4530.2002.tb00556.x.
Cho SM, Gu YS and Kim SB. 2005. Extracting optimization and physical properties of yellowfin tuna (Thunnus alba- cares) skin gelatin compared to mammalian gelatins. Food Hydrocoll 19, 221-229. https://doi.org/10.1016/j.food- hyd.2004.05.005.
Debnath S, Bhat KK and Rastogi NK. 2003. Effect of pre- drying on kinetics of moisture loss and oil uptake during deep fat frying of chickpea flour-based snack food. LWT- Food Sci Technol 36, 91-98. https://doi.org/10.1016/S0023- 6438(02)00186-X.
Heu MS, Shin JH, Park KH, Lee JS, Noe YN, Jeon YJ and Kim
JS. 2011. Quality of bastard halibut with different weights as a surimi source. Korean J Fish Aquat Sci 44, 18-24. https://
doi.org/10.5657/kfas.2011.44.1.018.
Hu Y, Que T, Fang Z, Liu W, Chen S, Liu D and Ye X. 2013. Ef- fect of different drying methods on the protein and product quality of hairtail fish meat gel. Dry Technol 31, 1707-1714.
https://doi.org/10.1080/07373937.2013.794831
Isa KM, Daud S, Hamidin N, Ismail K, Saad SA and Kasim FH. 2011. Thermogravimetric analysis and the optimisation of bio-oil yield from fixed-bed pyrolysis of rice husk using response surface methodology (RSM). Ind Crop Prod 33, 481-487. https://doi.org/10.1016/j.indcrop.2010.10.024.
Jin SK, Kim IS, Kim SJ, Jeong KJ, Choi YJ and Hur SJ. 2007.
Effect of muscle type and washing times on physico-chem- ical characteristics and qualities of surimi. J Food Eng 81, 618-623. https://doi.org/10.1016/j.jfoodeng.2007.01.001.
Lee HW, Choi YJ, Hwang IM, Hong SW and Lee MA. 2016.
Relationship between chemical characteristics and bacterial community of a Korean salted-fermented anchovy sauce, Myeolchi-Aekjeot. LWT-Food Sci Technol 73, 251-258.
https://doi.org/10.1016/j.lwt.2016.06.007.
Lujan-Acosta J and Moreira RG. 1997. Effects of different dry- ing processes on oil absorption and microstructure of tortilla chips. Cereal Chem 74, 216-223. https://doi.org/10.1094/
CCHEM.1997.74.3.216.
Nath A and Chattopadhyay PK. 2007. Optimization of oven toasting for improving crispness and other quality attri- butes of ready to eat potato-soy snack using response sur- face methodology. J Food Eng 80, 1282-1292. https://doi.
org/10.1016/j.jfoodeng.2006.09.023.
Nath A and Chattopadhyay PK. 2008. Effect of process pa- rameters and soy flour concentration on quality attributes and microstructural changes in ready-to-eat potato-soy snack using high-temperature short time air puffing. LWT- Food Sci Technol 41, 707-715. https://doi.org/10.1016/j.
lwt.2007.05.001
Nawaz A, Xiong Z, Xiong H, Chen L, Wang PK, Ahmad I and Ali SW. 2019. The effects of fish meat and fish bone ad- dition on nutritional value, texture and microstructure of optimised fried snacks. Int J Food Sci Tech 54, 1045-1053.
https://doi.org/10.1111/ijfs.13974.
Nurul H, Boni I and Noryati I. 2009. The effect of different ra- tios of Dory fish to tapioca flour on the linear expansion, oil absorption, colour and hardness of fish crackers. Int Food Res J 16, 159-165.
Oh JH, Karadeniz F, Gao Y, Kim HK, Kim SJ, Jung JM and Kong CS. 2018. Gel-forming ability of surimi from aqua- cultured pagrus major as affected by freeze-thaw cycle. Turk J Fish Aquat Sci 19, 423-430. https://doi.org/10.4194/1303- 2712-v19_5_07.
Park JW and Morrisey MT. 2000. Manufacturing of surimi from light muscle fish. In: surimi and surimi seafood, Park JW, ed.