1) K-water Institute, Infrastructure Research Center
Application of Artificial Neural Networks for Prediction of the Strength Properties of CSG Materials
Jeongyeul Lim1)・ Kiyoung Kim1)・ Hongduk Moon2)・ Guangri Jin† Received: January 23rd, 2018; Revised: February 6th, 2018; Accepted: April 25th, 2018
ABSTRACT : The number of researches on the mechanical properties of cemented sand and gravel (CSG) materials and the application of the CSG Dam has been increased. In order to explain the technical scheme of strength prediction model about the artificial neural network, we obtained the sample data by orthogonal test using the PVA (Polyvinyl alcohol) fiber, different amount of cementing materials and age, and established the efficient evaluation and prediction system. Combined with the analysis about the importance of influence factors, the prediction accuracy was above 95%. This provides the scientific theory for the further application of CSG, and will also be the foundation to apply the artificial neural network theory further in water conservancy project for the future.
Keywords : C.S.G (Cemented Sand and Gravel), Artificial neural network, Influence factors, Strength, Prediction model
ISSN 1598-0820 DOI https://doi.org/10.14481/jkges.2018.19.5.13 Journal of the Korean Geo-Environmental Society
19(5): 13~22. (May 2018) http://www.kges.or.kr
1. Introduction
The CSG materials, mixture of the cement, water, riverbed undisturbed sand and gravel or the wasted excavation materials such as the engineering materials, are a special engineering materials between the concrete and the sand stone (Raplael, 1992; Chai et al., 2016). Recently, the relationship between water conservancy project and the natural environment has aroused more attentions. Especially, the emergence of CSG Dam (Zhu et al., 2016; Hanada et al., 2003) makes the research on CSG materials more in-depth.
In practical engineering, using the local materials makes the diverse strength of CSG materials. Thus, there are strict requirements for their use and also needs to improve the mechanical properties of CSG materials. In order to reduce the number of experiment, we should forecast the mechanical properties of CSG materials. Although the traditional forecasting models, which uses mathematical rules and expressions, can reflect the complicated characteristics (You et al., 2011), there are still many defects such as numerous model forms that are not uniformed and large amount of computations. Especially Kramer, Harkat and Erdal..etc (Kramer, 1991; Harkat et al., 2003; Erdal et al., 2013) proposed that the artificial neural network can replace the original data with less data dimension, thus, applying the artificial neural network to forecast the
strength and design the CSG materials may be very meaningful.
So far, there have been many experimental studies on CSG materials, but few studies have been done to predict the strength characteristics of CSG materials. Kim et al. (2006) studied the “application of artificial neural network theory for evaluation of unconfined compression strength of deep cement mixing treated soil”, Park et al. (2006, 2007) studied the “prediction of compressive strength of reinforced lightweight soil using artificial neural network”, Kim et al. (2002) studied the “prediction on mix proportion factor and strength of concrete using neural network”, and Kim et al. (2006) studied the “prediction of unconfined strength of C.S.G. materials by artificial neural network”. In the past, most of these studies have been focused on the Unconfined Compression Strength of cement mixtures, and the study of tensile strength and Fracture Strain (compressive and tensile) is relatively rare.
Therefore, in this study used artificial neural network to predict the Unconfined Compression Strength and to predict the tensile strength and deformation rate.
In this study, the model can build a nonlinear mapping relationship between the mechanical properties of CSG materials and their influence factors quickly, and then forecast the real- time strength for different CSG materials. It is significant for correct condition assessment of CSG structure to accurately predict the real-time strength of CSG during its service life.
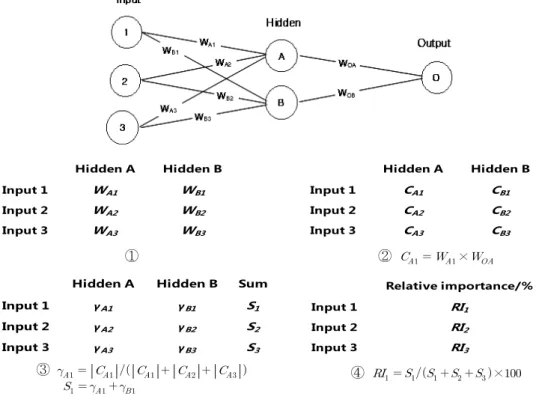
Fig. 1. The topological B.P. network
0 10 20 30 40 50 60 70 80 90 100
0.01 0.1
1 10
100 1000
Percentfinerbyweight(%)
Grain size millimeters
0 10 20 30 40 50 60 70 80 90 100
No.200 No.100 No.40 No.10 No.4
Fine gradation
Middle gradaion Natural gradation
Max 40mm gradation
Max 40mm natural gradation
Coarse gradation Experimental
construction gradaion
Fig. 2. Grain size distribution of river aggregates
Table 1. The chemical composition of cement
Composition SiO2 Al2O3 CaO Fe2O3 MgO SO3
Containing rate (%)
21.0
~ 22.5
4.0
~ 6.05
63.0
~ 66.0
2.5
~ 3.5
0.9
~ 3.3
1.0
~ 2.0
Table 2. The type and characteristics of PVA fiber PVA Length
(mm)
Diameter (μm)
Tensile strength (MPa)
Standard content (kg/m3)
REC15 8 40 1300 0.6~2
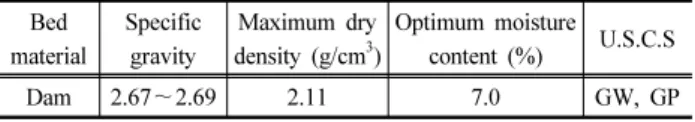
Table 3. The physical dynamic characteristics of river bed material Bed
material
Specific gravity
Maximum dry density (g/cm3)
Optimum moisture content (%) U.S.C.S
Dam 2.67~2.69 2.11 7.0 GW, GP
It not only reduces the frequency of the field experiments and improves the work efficiency greatly, but also lays the foundation to apply the artificial neural network theory further in water conservancy project for the future.
2. The back propagation neural network
The artificial neural network (ANN) is a neural network model, which simulates the basic characteristics of neurons based on the research of the neuroscience. So widely used for the B.P neural network, the Back Propagation. It is a system that simulates the information processing mechanism of the brain on the physical mechanism. It not only has the general computing ability to process the data, but also has the ability of learning and memory (Yang et al., 2014).The B.P network has been widely and successfully used in the pattern recognition, the image processing, the control optimization, the forecasting and the artificial intelligence.
The B.P network is a three-feed-forward classes network composed of the input, hidden and output layer. Each adjacent layer connects to neuron, but there is no connection between the neurons of each layer. The specific topological B.P network is shown in Figure 1. The network structure used in the study is constituted by the multi input, hidden and output layers.
3. Design of experiment
3.1 Raw materials
The normal port-land cement that has a density of 3.04 g/cm3, REC15 of PVA (Polyvinyl alcohol) fiber that has a high strength, good corrosion resistance, and a great affinity with cement, the natural sand and gravel come from a river
dam were used and there mechanical properties were shown in Table 1, 2, and 3, respectively. Sand divided into sand and aggregate after screening. Based on sized of the particle that was controlled within 40 mm, there were two kinds of aggregate grading curves (Figure 2). The water came from tap water.
3.2 Standard of experiment
So far, there is no defined standard on CSG materials.
Because the properties of CSG material between the concrete and the sand stone, thus, we referred to the ASTM (American Society for Testing and Materials) standards for building materials.
The specimen size is φ150 mm × H300 mm. Each mixture made into 10 pieces specimens (six unconfined compression strength + four splitting tensile strength-ASTM C496), a total of 300 specimens. Specimens were put into the carbon steel specimen in three steps, then they were moulded by artificial vibrating compaction each layer. Specimens were release after
Fig. 3. The test device
Table 4. The design of blends about the experiment Number Cement (kg) Fiber (%) Age (day)
1
60 80
0
7 28 91
2 1
…. 3
30 10
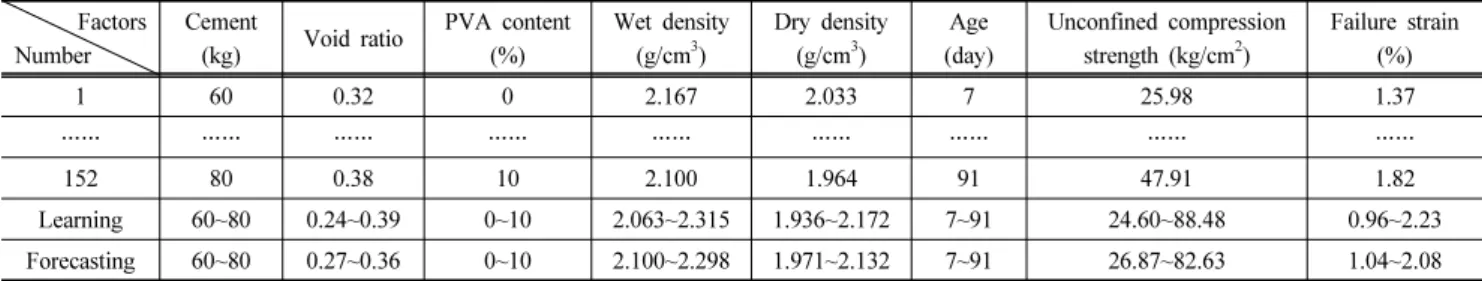
Table 5. The sample data of unconfined compression strength in the BP neural network Factors
Number
Cement
(kg) Void ratio PVA content (%)
Wet density (g/cm3)
Dry density (g/cm3)
Age (day)
Unconfined compression strength (kg/cm2)
Failure strain (%)
1 60 0.32 0 2.167 2.033 7 25.98 1.37
…… …… …… …… …… …… …… …… ……
152 80 0.38 10 2.100 1.964 91 47.91 1.82
Learning 60~80 0.24~0.39 0~10 2.063~2.315 1.936~2.172 7~91 24.60~88.48 0.96~2.23 Forecasting 60~80 0.27~0.36 0~10 2.100~2.298 1.971~2.132 7~91 26.87~82.63 1.04~2.08
Table 6. The sample data of tensile strength in the BP neural network Factors
Number
Cement
(kg) Void ratio PVA content (%)
Wet density (g/cm3)
Dry density (g/cm3)
Age (day)
Tensile strength (kg/cm2)
Failure strain (%)
1 60 0.34 0 2.135 2.003 7 2.75 1.01
…… …… …… …… …… …… …… …… ……
115 80 0.40 10 2.059 1.925 91 11.24 1.55
Learning 60~80 0.25~0.53 0~10 1.874~2.331 1.759~2.162 7~91 2.51~16.56 0.39~2.78 Forecasting 60~80 0.31~0.45 0~10 1.976~2.211 1.854~2.067 7~91 2.78~12.77 0.66~1.74
24 hours, and sprayed with the water under room temperature, the curing temperature was (20 ± 2)℃.
3.3 Design of blends
Based on the characteristics of CSG material and experiences about designing the concrete mixture, we used the same aggre- gate gradation and sand ratio, different amount of cementing materials and age to design the blends by orthogonal test.
Doping with 0%, 1%, 3%, 5%, 10% (as a percentage of the amount of cement) PVA fiber, the final ratio are shown in Table 4.
Based on the changes of curing time, the strength was
measured after a certain age. The experiment was carried out by an electronic universal testing machine of a microcomputer control system. The maximum axial pressure was 1,000 kN and the accuracy was 0.01%. The specific test device is shown in Figure 3.
4. Forecasting model
4.1 Analysis of the influence factor
In order to improve the accuracy of artificial neural network prediction, a large number of experimental data with high accuracy are needed. Generally, the strength characteristics of CSG materials vary significantly with the characteristics of aggregate, water-cement ratio and age of material. Therefore, in order to obtain accurate prediction results, it is necessary to ensure the accuracy of experimental data (Kim et al., 2006). Sample data from the model were based on data from designed laboratory mixture ratio. Because of the errors in the experiment process, it wasn’t able to use all data obtained.
Thus, we obtained 152 unconfined compression strength data and 115 tensile strength data. The specific composition is shown in Table 5 and 6. All data were randomly divided into two types, unconfined compression strength data constituted 122 learning data and 30 forecasting data, tensile strength data constituted 92 learning data and 23 forecasting data (Jin et al., 2013).
The CSG material, a new type of dam materials, has the
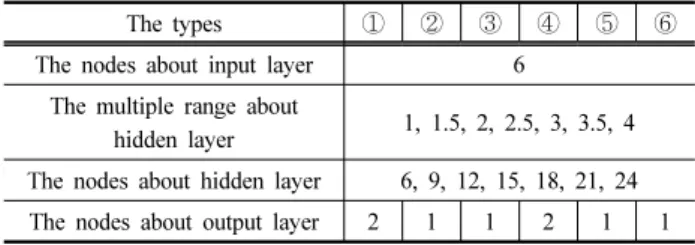
Table 7. Nodes of different layers in the neural network
The types ① ② ③ ④ ⑤ ⑥
The nodes about input layer 6 The multiple range about
hidden layer 1, 1.5, 2, 2.5, 3, 3.5, 4 The nodes about hidden layer 6, 9, 12, 15, 18, 21, 24 The nodes about output layer 2 1 1 2 1 1
both characteristics of concrete and sand and gravel materials.
Its mechanical properties are affected by the influence factors such as the amount of cementing materials, the distribution of grain size (Due to the limitation of experimental conditions, this study adopts the aggregate grading experimental data with the maximum size of 40 mm. The strength of CSG was influenced by aggregate gradation characteristics of aggregate particle size, Cu, Cg and fine particle content. In the future, when using ANN to predict the strength of CSG, the strength experimental data of graded characteristics should be con- sidered), sand ratio, water-cement ratio, age and so on. A large number of studies (Feng et al., 2013; Liu, 2013; Zhang et al., 2015) had shown that the amount of cementing materials had effect on the strength of CSG material. The strength was in proportional to the amount of cementing materials. Moreover, addition of a certain amount of fly ash in the CSG material could improve some mechanical properties, and also saved the cost. Choosing the optimized water-cement ratio and the reasonable sand ratio could make the strength reach the maximum in the experiment. The strength of the CSG material increased with the growth of the age.
4.2 Design of model in the BP neural network 4.2.1 Data pre-processing
Because of a large range of the original sample data, it was normalized to values between 0 and 1. The specific movable formula is:
max min
max min
(1)
The xmax and xmin are the maximum and the minimum of sample data, respectively. X is the original sample data and y is the normalized values. The formula could make the data pre-processing avoid the extreme value of 0 and 1. It could reduce the difficulty of training in the neural network, as well as the training numbers.
4.2.2 Design of node numbers in the layers Since the amount of nodes on each layer of the B.P neural network has great influence on the network’s performance, the amount on the input and output layers of B.P network are chosen in the actual situation of network application and
research. Based on the sample data from the laboratory data and the influence factors, first, we defined six parameters including the cement, the void ratio, the PVA content, the wet density, the dry density and the age as the input variables.
Second, we defined the strength and failure strain as the output variables. The number of nodes on the hidden layer is the key to design the neural network. If the number is too small, it will not obtain sample information from the neural network to hamper finding and extracting the inherent law. If the number is too large, it may reduce the ability of generalization in the neural network, and also will increase the training time of neural network. Thus, it needed to optimize the number of nodes on the output and hidden layers.
(1) Optimization of the hidden layer
So far, there is no accurate numerical calculation for the middle hidden layer. Thus, the amount of the layers was determined empirically, and then determined the right numbers.
At present, the most widely calculation refers to the following empirical formula (Hu, 2014):
;
≤ ≤ ;
(2)
Where, l is the number of nodes in the hidden layer; m is the number of nodes in the input layer; n is the number of nodes in the output layer; the constant a=1 ~ 10. Generally, we can preliminarily get the optimal number of node on hidden layer in the different neural networks by directly using multiple formula.
(2) Optimization of the output layer
From the experiment results, we found large gap of data between the compressive strength, the tensile strength and the failure strain. Thus, we established multi-forecasting models, then combined with results of comprehensive analysis. We
Hidden A Hidden B
Input 1 WA1 WB1
Input 2 WA2 WB2
Input 3 WA3 WB3
Hidden A Hidden B
Input 1 CA1 CB1
Input 2 CA2 CB2
Input 3 CA3 CB3
Hidden A Hidden B Sum
Input 1 γA1 γB1 S1
Input 2 γA2 γB2 S2
Input 3 γA3 γB3 S3
Relative importance/%
Input 1 RI1
Input 2 RI2
Input 3 RI3
① ② ×
③
④ ×
Fig. 4. Input layer structure kept the same number of input layer, optimized the number
of output layer, set one independent parameter (strength or failure strain) and two binding parameters (strength and failure strain). The final values of each layer are shown in Table 7.
4.2.3 Setting up the parameters
Sinusoidal transfer function was used for the connection between layer of neuron, the connection strength were 0.01/0.1, 0.01/0.3, 0.01/0.5, 0.01/0.7, 0.1/0.1, 0.1/0.3, 0.1/0.5, 0.1/0.7, 0.3/0.1, 0.3/0.3, 0.3/0.5, 0.3/0.7, 0.5/0.1, 0.5/0.3, 0.5/0.5, and 0.5/0.7. The network learning function used B.P learning rules with the momentum. The starting learning efficiency was 0.1 and the momentum factor was 0.9. The training function was the algorithm that combined with the gradient descent method and quasi-newton method, the B.P algorithm of Levenberg- Marquardt. The maximum of training steps are 50,000, and the Mean Square Error is 0.0001. The values of weights and thresholds in the B.P neural network were randomly generated by the system, and the network performance analysis function value was the smallest through the reverse propagation to constantly adjust the weights and thresholds of the network.
4.2.4 The evaluating factors for error
(1) To evaluate the effect of forecasting in neural network, generally, the MAE (mean absolute error), the MAPE (mean
absolute percentage error), and MSE (mean square error) method were applied in practice fields. But we chose the RMSE (root mean square error) to evaluate the network performance in the study:
RMSE ⋯ (3)
The en is the deviation between the predicted and the actual value for the number n, n is the number of sample.
The RMSE is used to measure the deviation between the predicted and the actual value, and it can well reflect the accuracy of measurement, especially it’s very sensitive in reflecting the errors in a set of small or large measurements.
It had been shown that 68% of data deviation was less than the RMSE value, 95% was less than twice of the RMSE value. The performance evaluation is very important. If the simulated performance is poor, we need to adjust the network by changing the network parameters to improve the network performance so that it can achieve the desired effect. In this paper, the RMSE is smaller and the forecasting accuracy is higher. This means that the network performance is better.
(2) In each input layer, it has the analysis of relative importance in the influence factors, and we need to sort each
0 20 40 60 80 100
0 20 40 60 80 100
Coumuter Value
True Value
(a1) Hidden node (b1) Connection strength (c1) Error rate about strength
-Consider the compressive strength
0 1 2 3
0 1 2 3
Coumuter Value
True Value
(a2) Hidden node (b2) Connection strength (c2) Error rate about strength
-Consider the failure strain
Fig. 5. The model structure (out put 2 - unconfined compressive strength & strain)-①
0 20 40 60 80 100
0 20 40 60 80 100
Coumuter Value
True Value
(a) The hidden node (b) The connection strength (c) The error rate
Fig. 5. The model structure (out put 1 - unconfined compressive strength)-②
0 1 2 3
0 1 2 3
Coumuter Value
True Value
(a) The hidden node (b) The connection strength (c) The error rate
Fig. 5. The model structure (out put 1 - unconfined compression strain)-③ influence factors. Figure 4 shows the input layer structure
analysis.
4.3 Results analysis
(1) Through the self-learning and forecasting of neural network, the predicted results of the different hidden layer
Fig. 6. The convergence curve about optimal structure model
(a) Out put 2 (strength & strain) (b) Out put 1 (strength) (c) Out put 1 (strain) Fig. 7. The relative importance (unconfined compressive results)
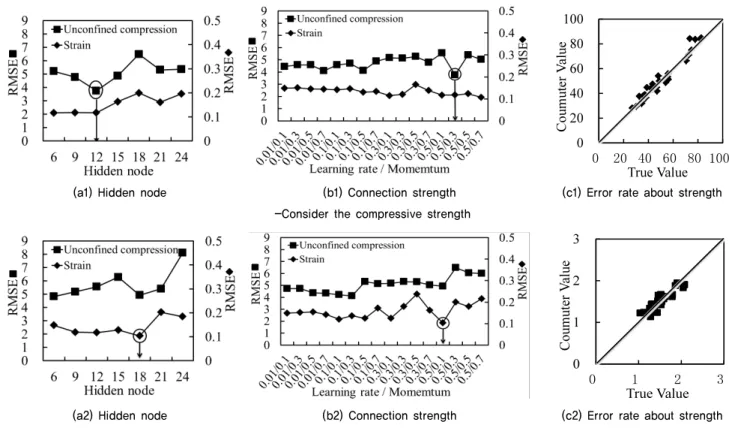
and output layer for unconfined compressive strength are shown in Figure 5. We obtained the optimal structure model.
① the compressive strength was considered the major factor when the output layer was the two parameters of unconfined compressive strength and failure strain. The optimal hidden layer was 12, the connection strength was 0.5/0.3. ② When the output layer was the only parameter for unconfined compressive strength, the optimal hidden layer was 12, the connection strength was 0.1/0.5. ③ When the output layer was the parameter for failure strain, the optimal hidden layer was 9, the connection strength was 0.5/0.1. Based on the error rate of optimal structure in each model, it can be drawn that most of the sample and simulated data had fitted better. The B.P network model has high accuracy, and a small error.
Thus, it can be a good predictor to the real-time strength of CSG.
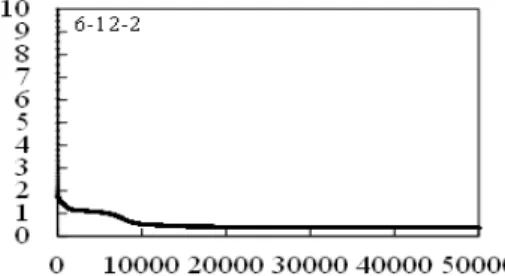
Taken together, the optimal structure model in forecasting the unconfined compression strength, the input layers is 6, the hidden layer is 12, the output layer is 2, and the connection strength is 0.5/0.3. Based the convergence curve obtained based on the proposed model is shown in Figure 6. It showed that the network achieves the best precision when the training time reached 20,000. However, due to the certain limitations of collected data, it can’t be completely applicable to forecast
the strength of CSG material. It can obtain better precision and practicability by increasing the data and expanding the range of data.
In order to make a better evaluation of the B.P network forecasting results, we made the regression analysis of the B.P network between the predictive value and the measured value combined with the analysis of error rate shown in Figure 5. It was found that the correlation coefficient R2 is 0.9504. Furthermore, the importance of the optimal model structure was obtained based on the theoretical research, and it is shown in Figure 7. From the graph, we can see that the PVA content has more influence on the strength.
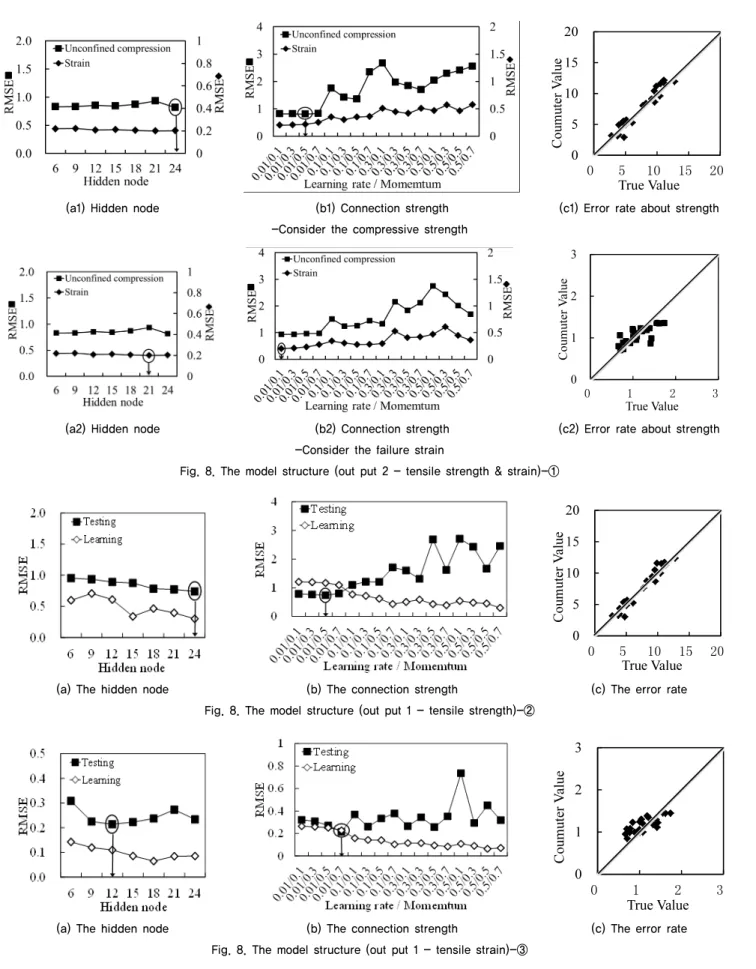
(2) Through the self-learning and forecasting for neural network, the predicted results of the different hidden layer and output layer for tensile strength was obtained and shown in Figure 8. We obtain the optimal structure model. ① When the output layer was the two parameters for tensile strength and failure strain, the tensile strength was the main considered factor, the optimal hidden layer was 24, the connection strength was 0.01/0.5. ② When the output layer was the only para- meter for tensile strength, the optimal hidden layer was 24, the connection strength was 0.01/0.5. ③ When the output layer was the parameter for failure strain, the optimal hidden layer was 12, the connection strength was 0.01/0.7. Considering the all groups, in general the number of hidden layers was higher than the input layer in the optimal structure. Especially, when the number of input is small, the hidden layers often have been increased several times. However, with increase of number of hidden layers, the cost of time also increased.
Taken together, the optimal structure model is: the com- bination of six of input layers, twenty-four of the hidden
0 5 10 15 20
0 5 10 15 20
Coumuter Value
True Value
(a1) Hidden node (b1) Connection strength (c1) Error rate about strength
-Consider the compressive strength
0 1 2 3
0 1 2 3
Coumuter Value
True Value
(a2) Hidden node (b2) Connection strength (c2) Error rate about strength
-Consider the failure strain
Fig. 8. The model structure (out put 2 - tensile strength & strain)-①
0 5 10 15 20
0 5 10 15 20
Coumuter Value
True Value
(a) The hidden node (b) The connection strength (c) The error rate
Fig. 8. The model structure (out put 1 - tensile strength)-②
0 1 2 3
0 1 2 3
Coumuter Value
True Value
(a) The hidden node (b) The connection strength (c) The error rate
Fig. 8. The model structure (out put 1 - tensile strain)-③ layer, one of the output layer and the connection strength
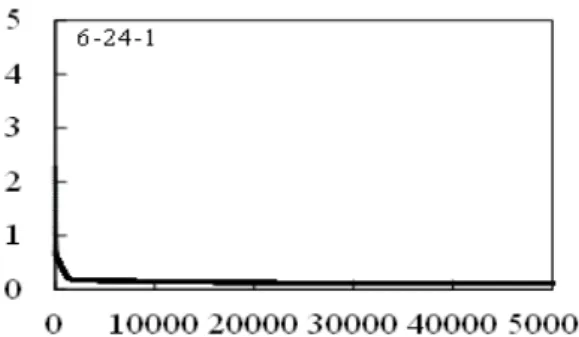
of 0.01/0.5. The convergence curve obtained based on the model is shown in Figure 9. From the figure, it showed that the network achieved the precision when the training time
reached 20,000. However, due to the certain limitations of collected data, it can’t be completely applicable to forecast the strength of C.S.G material. Furthermore, it can reach a better precision and practicability with the increases of the
Fig. 9. The convergence curve about optimal structure model
(a) Out put 2 (strength & strain) (b) Out put 1 (strength) (c) Out put 1 (strain) Fig. 10. The relative importance
data and expand the range of data.
In order to make a better evaluation of the B.P network forecasting results, it was carried out the regression analysis of the B.P network between the predictive value and the measured value combined with the analysis of error rate in Figure 8, and the correlation coefficient R2 is 0.9465. Based on the theoretical research, the optimal model structure was proposed and shown in Figure 10. From the graph, it showed that the PVA content had more influence in strength.
5. Conclusion
In this study, we get the following results:
(1) When using the optimized the six parameters such as cement, void ratio, PVA content, wet density, dry density and age as input variables and the single strength and failure strain or combined as output variables, it can improve the accuracy of forecast the real-time CSG material strength as well as reduce the computing degree of neural network.
(2) Appling this technique to the PVA fiber can improve
the ductility of CSG material. The model can also make the failure mode of specimen turn the brittle fracture into ductile failure, particularly in the content of 3%, the effect is obvious, and the overall strength has been raised effect.
(3) Through changing the number of hidden layers and output layers, we establish the optimal combined forecasting model of the B.P network, and obtained the optimal structure model. When forecasting the unconfined compression strength, six of input layers, twelve of hidden layers, two of output layers and the connection strength of 0.5 / 0.3; when forecasting the tensile strength, six of the input layers, twenty-four of the hidden layer, one of the output layer, and the connection strength of 0.001/ 0.5.
We apply the data and calculated to degree of the important factors, which is 95%.
(4) Using the experimental data obtained from the actual C.S.G materials and the computer technology applied to the neural network in the actual project, we can improve the speed and accuracy of calculation data. It can explain the variation about CSG material strength. Thus, it provides the scientific theoretical basis for the further application of CSG.
(5) Due to the limited experimental data and Restrictions on the expression of qualitative data, the predicted structure model still has some shortcomings. In the future, when using ANN to predict CSG strength, should consider the influence factors of aggregate gradation characteristics (maximum particle size, fine particle content) and fiber type.
Acknowledgement
This research was supported by a grant [MOIS-DP-2015- 04] through the Disaster and Safety Management Institute funded by Ministry of the Interior and Safety of Korean government.
References
1. Chai, Q. H., Yang, S. F. and Sun, M. Q. (2016), Study on the influence factors of compressive strength of CSG material, Journal of the YELLOW RIVER (China), Vol. 38, No. 7, pp.
86~88.
2. Erdal, H. I., Karakurt, O. and Namli, E. (2013), High performance concrete compressive strength forecasting using ensemble models based on discrete wavelet transform, Engineering Applications of Artificial Intelligence, pp. 1246~1254.
3. Feng, W., Jia, J. S. and Ma, F. D. (2013), Study on design parameters of mix proportion for cemented sand and gravel (CSG), Water Resources and Hydropower Engineering (China), Vol. 44, No. 2, pp. 55~58.
4. Hanada, H., Tamezawa, T. and Ooyabu, K. (2003.12), CSG method using muck excavated from the dam foundation, Proceedings 4th International Symposium on Roller Compacted Concrete Dams, pp. 447~456.
5. Harkat, M. F., Mourot, G. and Ragot, J. (2003), Nonlinear PCA combining principal curves and RBF-Networks for process monitoring, In:Proceeding of the 42nd IEEE Conference on Decision and Control, pp. 1956~1961.
6. Hu, X. (2014), Prediction of high performance concrete strength based on artificial neural network, The Master Thesis, in Hunan University, China, pp. 13~16.
7. Jin, G. R., Kim, K. Y., Quan, H. C. and Kim, K. W. (2013), Strength characteristics of PVA fiber reinforced CSG materials, Journal of the Korean Geotechnical Society, Vol. 29, No. 12, pp. 95~104.
8. Kim, I. S., Park, S. K., Yang, D. S., and Lee, J. H. (2002), Prediction on mix proportion factor and strength of concrete using neural network, KCI Concrete Journal, Vol. 14, No. 4,
pp. 457~466.
9. Kim, K. Y., Park, H. G., Lee, S. W. and Cho, S. E. (2006), Prediction of unconfined strength of C.S.G. materials by artificial neural network, 2006 Fall Geotechnical Engineering Conference, pp. 938~843.
10. Kim, Y. S., Jeong, H. C., Huh, J. W. and Jeong, G. H. (2006), Application of artificial neural network theory for evaluation of unconfined compression strength of deep cement mixing treated soil, 2006 Spring Geotechnical Engineering Conference, pp. 1159~1164.
11. Kramer, M. A. (1991), Nonlinear principal component analysis using autoassociative neural network, AICHE Journal, Vol. 37, No. 2, pp. 233~243.
12. Liu, Y. H. (2013), Research on constitutive model of CSG material, The Master Thesis, in North China University Of Water Resources And Electric Power, China, pp. 19~21.
13. Park, H. I., Kim, Y. T. and Kim, H. J. (2006), Prediction of com- pressive strength of reinforced lightweight soil using artificial neural network, 2006 Spring Geotechnical Engineering Conference, pp. 1248~1253.
14. Park, H. I., Kim, Y. T. and Kim, H. J. (2007), Prediction of com- pressive strength of reinforced lightweight soil using artificial neural network, KSCE Journal of Civil Engineering, Vol. 27, No. 2, pp. 111~119.
15. Raplael, J. M. (1992), The optimum gravity dam, Proceedings roller compacted concrete III, ASCE, San Diego, California, and 2-5 February, pp. 5~19.
16. Yang, X. M., Wu, T. Y. and Shi, D. (2014), Sensitivity analysis on influence factors to concrete real-time strength based on artificial neural network, Concrete (China), No. 351, pp. 16~23.
17. You, J., Che, Y. and Zhong, W. Q. (2011), Predition of concrete strength of existing buildings based on BP neural networks, Journal of Architecture and Civil Engineering (China), Vol. 28, No. 1, pp. 70~75.
18. Zhang, D. X., Lin, M. X., Wang, C. X. and Zhu, D. X. (2015), Dynamic mechanical properties of CSG and its constitutive relation, Journal of Changsha University of Science and Technology (Natural Science, China), Vol. 12, No. 2, pp. 83~90.
19. Zhu, X. L., Ding, J. T. and Cai, Y. B. (2016), Experimental research on strength and elasticity modulus of cement sand and gravel, Journal of the YELLOW RIVER (China), Vol. 38, No.
3, pp. 126~128.