ORIGINAL ARTICLE
A Study on the Estimation of Greenhouse Gas Using Oyster Shell Recycling for Paper Filler
Seung-Chel Park
1), Ran-Sug Seo
*, Sung-Hu Kim
2)Department of Airline Services, Hoseo University, Asan 336-795, Korea
1)
Department of Climate Change Fusion Technology, Hoseo University, Asan 336-795, Korea
2)
Department of Energy & Environmental Engineering, Shinhan University, Dongducheon 11340, Korea
Abstract
This study has conducted greenhouse gas emission reduction test as using Oyster-shells originated PCC paper filler compare to non-Oyster shells used PCC. This examination was estimated and calculated in accordance with both IPCC (Intergovernmental Panel on Climate Change) and World Business Council for Sustainable Development (WBSCD). The greenhouse gas emission reduction estimation result indicates that, when oyster shells are recycled and used as paper filler, it reduces 27.97 tCO2 per 100 ton of oyster shells. It is greenhouse gas emission 44.27 tCO2 from PCC production changed to carbon emission reduction when replaced with oyster shell. LNG greenhouse gas emission 16.3 tCO2 in relation to the pre-treatment with oyster shell per 100 ton is also reflected. As a result, it is assumed that roughly 0.2797 tCO2/oyster shell·ton.
Key words : Oyster shell, Lime stone, Precipitated calcium carbonate, Calculation methodology, Greenhouse gas
1. Introduction
1)If oyster shells generated from the farming and processing processes are left alone, then microor -ganisms will proliferate due to the influence of flesh attached to the shells. As a result, those microor -ganisms might cause diseases with odor, leachate, etc. This environment pollution becomes a cause for pollution in the coastal fishing grounds, a manage -ment issue for public water and damage to natural landscape. Furthermore, it will have a negative impact on the image for those ocean tourist cities.
Therefore, it is imperative to resolve this issue through an appropriate process. However, oyster shells cannot be transported via a general vehicle
since they are classified as a work site waste pursuant to the Waste Management Act. They should be transported only through those vehicles specially designed for transporting wastes. Thus, they become a cause for increasing the consigned process fee. In particular, the economic burden of fishermen is on the rise.
To produce high value-added products by recycling oyster shells, this study aimed to manufacture quicklime (CaO), slacked lime (Ca(OH)
2), precipitated calcium carbonate (CaCO3) through calcination, hydration and carbon gasification reaction in order to produce high value-added products by recycling oyster shells and estimate reduction effect along with the review of calculation methodology for estimation of
Received 8 October, 2015; Revised 14 December, 2015;
Accepted 21 December, 2015
*Corresponding author : Ran-Sug Seo, Department of Airline services, Hoseo University, Asan 336-795, Korea
Phone: +82-41-540-9904 E-mail: [email protected]
ⓒ The Korean Environmental Sciences Society. All rights reserved.
This is an Open-Access article distributed under the terms of the Creative Commons Attribution Non-Commercial License (http://
creativecommons.org/licenses/by-nc/3.0) which permits unrestricted non-commercial use, distribution, and reproduction in any medium, provided the original work is properly cited.
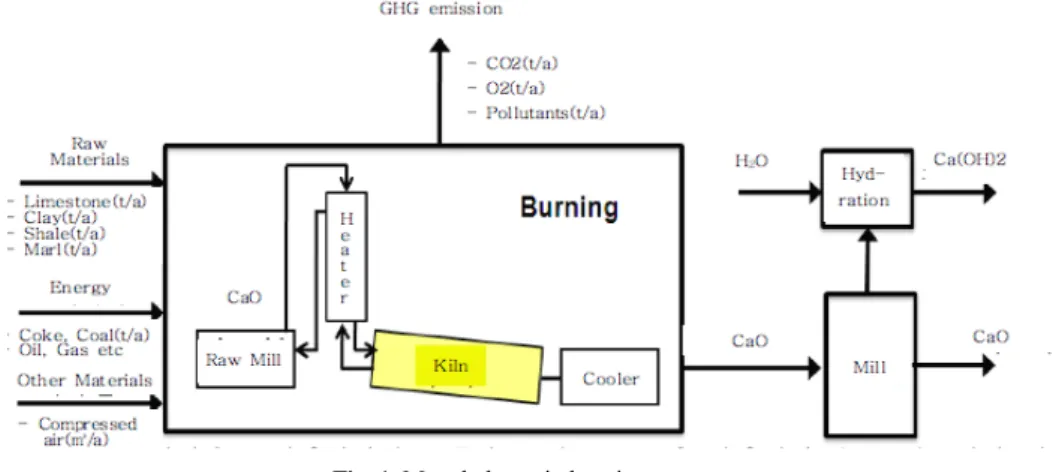
Fig. 1. Mass balance in burning system.
reducible greenhouse gas quantity by replacement effect for the original products after using them as a paper filler.
2. Materials and Methods
This study considered the case in which all of the oyster shells (308,277 tons as of 2011) generated in Korea from lime stone used in the paper mills were recycled and manufactured as a precipitated calcium carbonate that is a paper filler. In this regard, this study utilized the method of applying greenhouse gas emission generated from the lime production process as reduction quantity. (Korea maritime institute(KMI), 2002)
The process related to lime production stated in
"the guideline on operation and management of greenhouse gas energy target (Ministry of Environ -ment, June 2012)" for the estimation of greenhouse gas emission generated from the lime production process is as follows.7 Lime is mainly used in refining of metals (aluminum, steel, copper, etc.), environment (flue gas desulfurization, softening, pH control, waste disposal, etc.) and construction (soil stabilization, asphalt additives, etc.). It mainly utilizes dolomite or dolomite limestone (lime stone whose magnesium carbonate accounts for at least 44
percent of its whole contents) as raw material and produces lime through the following reaction at 900 to 1,500 in kiln.
The firing facility in the lime production process is equivalent to the firing facility in the cement production process unit. In the general lime production process, a variety of firing facilities are used. These include long rotary kiln, preheater-rotary kiln, parallel flow regenerative kiln, annular shaft kiln, etc.
Greenhouse gas emission in the lime production process is conducted mainly in the firing process.
More specifically, it can be sub-divided into process emission related to firing reaction of lime stone and combustion activity of fuel (fossil fuel and waste fuel are included) within the firing facility. Greenhouse gas emission quantity per quicklime production quantity (BM, Bench-Ma) can be estimated through the following equation.(National Institute of Environ -mental Research(NIER), 2007; Lee, 2012)
It is possible to reduce lime stone consumption by
reaching the maximum yield of gemstone for lime
stone with the optimized mining technique (blasting
and drilling) and continuing to use by reducing the
fuel consumption as much as possible in the
production process from gemstone for kiln to finished
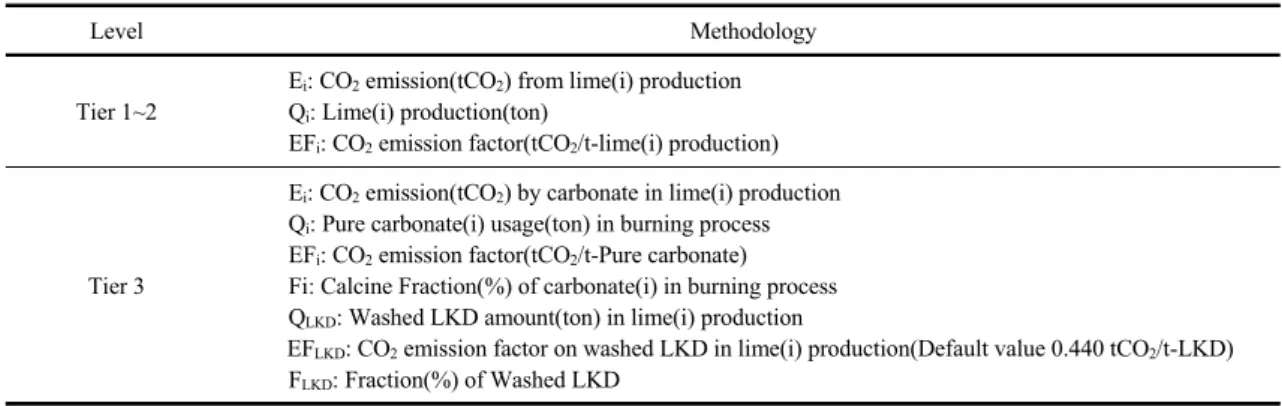
Level Methodology
Tier 1~2
Ei: CO2 emission(tCO2) from lime(i) production Qi: Lime(i) production(ton)
EFi: CO2 emission factor(tCO2/t-lime(i) production)
Tier 3
Ei: CO2 emission(tCO2) by carbonate in lime(i) production Qi: Pure carbonate(i) usage(ton) in burning process EFi: CO2 emission factor(tCO2/t-Pure carbonate) Fi: Calcine Fraction(%) of carbonate(i) in burning process QLKD: Washed LKD amount(ton) in lime(i) production
EFLKD: CO2 emission factor on washed LKD in lime(i) production(Default value 0.440 tCO2/t-LKD) FLKD: Fraction(%) of Washed LKD
Table 1. The calculation methodology for greenhouse gas emission in lime manufacturing process
Level Emission factors (EFi)
Tier 1
Using the IPCC default factors (Lime production per CO2 emissions) - Lime production per CO2 emissions: 0.750 tCO2/t-Quicklime * Source: 2006 IPCC guidelines for national greenhouse gas inventories
Tier 2
Using the country specific emission factors
Fi: Fraction purity of limestone (%) MwCO2: CO2 molecular weight (=44.01) MwCaO: CaO molecular weight (=56) MgO molecular weight (=40)
Tier 3 Analysis of the material and adjunct material go into lime burning structures and using according to below equation of the inherent emission factors
Tier 4 Using the Continuous Emission Monitoring (CEM) Table 2. The CO2 emission factor of each Tier
goods as optimizing the production process technique.
It will be possible to approach to an optimized kin technique more closely, which can reduce fuel consumption to apply lime stone with a wide range of particle size to the process. In this study, the emission estimation calculation methodology in the slacked lime production unit of the industrial process of IPCC 2006 guideline was quoted in order to evaluate greenhouse gas reduction for the recycling of paper process of oyster shells. The use of slacked lime for soft water is a reaction of CO
2and lime; thus, it does not generate CO
2net emission in the air by regenerating calcium carbonate (CaCO
3). In addition, lime kiln dust (LKD) will be generated during the
lime production period; thus, this should be taken into consideration when estimating emission quantity. The estimation calculation methodology for greenhouse gas emission is classified as Tier 1 to 4 calculation methodologies and each estimation calculation methodology is as Table 1.(NIER, 2007;
Lee, 2012)
First, Tier-1 estimates greenhouse gas emission by
applying CO
2emission coefficient (tCO
2/t-lime
production) to the amount of produced lime. In this
case, the accuracy of Tier-2 will be enhanced by
applying the national emission coefficient that is the
unique value at national level as the emission
coefficient to be applied. The estimation method is
Carbonate(i) Emission factor (tCO2/tCarbonate)
CaCO3 0.4397 (tCO2/tCaCO3)
MgCO3 0.5220 (tCO2/tMgCO3)
CaMg (CO3)2 0.4773 (tCO2/tCaMg (CO3)2)
C 3.6640 (tCO2/tC)
* Source: 2006 IPCC guidelines for national greenhouse gas inventories Table 3. The CO2 emission factor for pure carbonate
classified as Tier-1 when applying the emission coefficient to be applied in IPCC. On the other hand, Tier-3 is a method to estimate emission in conside -ration of the input of fuel (pure carbonate) for lime production based on actual production plants. In this case, it is possible to estimate CO
2emission that is closer to an actual value through reducing the amount of lime kiln dust to be lost in the production process.
Theoretically, it is more accurate than Tier-1 and Tier-2.
[3-6](Lee, 2012; Ministry of Environment(ME);
Korea Environment Corporation(KECO), 2012) Tier-3 can be applied when estimating the emission for each workplace. In this case, it will be inevitable to develop a unique emission coefficient (EF
i) for each workplace through experiment and analysis reflecting the nature of target workplace. In this regard, it will be possible to estimate it through the following equation.(NIER, 2007)
* Assumption: Molecular formula of carbonate (i)
= Xy(CO
3)z
EF
i: CO
2emission coefficient (tCO
2/t-carbonate material) of carbonate that is injected as fuel (i)
MwCO
2: Molecular weight of CO
2(44 g/mol) MwX: Molecular weight of X (alkali metal or
alkaline earth metal) (g/mol)
MwCO
3-2: Molecular weight of CO
3-2(60 g/mol) Y: Stoichiometric coefficients of X (alkaline
earth metal "1" and the alkali metals "2") Z: Stoichiometric coefficients of CO
3-2(1)
As for the control standard for emission coefficient, workplace measurements are utilized in calcination modulus (F
i) and calcination modulus of lime kiln dust (F
LKD) of each carbonate as to Tier 3 calculation methodology. When there is no measure -ment, 1.0 can be applied. The CO
2emission coefficient for pure carbonate component presented from IPCC guideline is as follows.(ME and KECO, 2008)
Furthermore, the emission coefficient (EFLKD) of lime kiln dust to be lost when applying Tier-3 can be estimated through the following equation.(NIER, 2007)
EF
LKD: Emission coefficient of lime kiln dust (CKD) to be lost during lime production (tCO
2/t-LKD)
LKDCaO: CaO content of LKD that is not recycled in kiln (wt%)
LKD
nCaO: CaO content that is not fired for LKD that is not recycled in kiln (wt%) - CaO that is not fired is a kind of CaO and
non-carbonate that is left in LKD in the form of CaO and CaCO
3. It means CaO in LKD at kiln LKDMgO: MgO content of LKD that is not
recycled in kiln (wt%)
LKD
nMgO: MgO content that is not fired for LKD that is not recycled in kiln (wt%) - MaO that is not fired is a kind of MgO and
non-carbonate that isleft in LKD in the form of
MgO and MgCO
3. It means MgO in LKD at
kiln
Greenhouse gas Qi (m3-fuel) ECi (MJ/m3) EFi,j (kg/TJ) fi Feq,j
CO2
7,671 39.4
56,100
0.98
1
CH4 1 21
N2O 0.1 310
* Source: The guidelines for managing the target management system in Korea Table 4. The emission factor for greenhouse gas calculation
3. Results and Discussion
The calculation methodology used for estimating the greenhouse gas emission estimation is as follows.
(ME and KECO, 2008; ME, 2012)
First, as for the greenhouse gas emission generated from the lime production, the precipitated calcium carbonate produced by the oyster shell recycling process could replace lime; thus, the reducible quantity of greenhouse gas when using the precipitated calcium carbonate instead of lime in the paper mills was estimated. To this end, Tier 2 (CO
2emission coefficient per lime production: 0.785 tCO
2/t-quicklime) in the emission coefficient control standards was applied.
And the greenhouse gas emission generated from the pre-processing for recycling oyster shells was estimated based on the following equation. As for the applied fuel, LNG was reflected in the estimation equation.
E
i,j: Emission for each greenhouse gas (j) in accor -dance with fuel (i) combustion (CO
2-eq ton) Q
i: Fuel (i) amount (measurements and m3-fuel) EC
i: Calorie coefficient of fuel (i) (fuel net calorific
value and MJ / m
3-fuel)
EF
i,j: Greenhouse gas(j) emission coefficient for each fuel (i) (kg-GHG / TJ-fuel)
fi: Oxidation coefficient of fuel (i)
F
eq,j: CO
2equivalent coefficient for each greenhouse gas (j) (CO
2=1, CH
4= 21, N
2O = 310) Each coefficient for the above emission estimation
equation is as shown in the following Table(ME and KECO, 2008; ME, 2012)
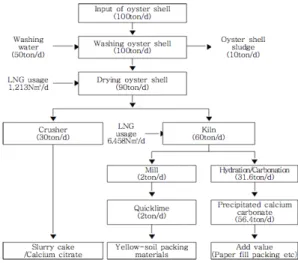
The detailed process diagram for installing 100 ton/
day sized facilities for recycling oyster shells is as shown in the following Fig. 2.
Fig. 2. Oyster Shell Recycling Process.
Those oyster shells, which are supplied to the
oyster shell recycling facility, will be decomposed
into salts and organic matters through the crushing
and cleaning process. Then, water will be removed
through the drying process. Some of them will be
ground to produce cement raw material or calcium
citrate. Some of them will be used to produce slacked
lime through the firing process at a high temperature
of at least 850 . Slacked lime produced through the
firing process will be used to produce high value
Greenhouse gas Qi (m3-fuel) ECi (MJ/m3) EFi,j (kg/TJ) fi Feq,j
CO2
7,671 39.4
56,100
0.98
1
CH4 1 21
N2O 0.1 310
* Source: The guidelines for managing the target management system in Korea Table 5. The emission factor for greenhouse gas calculation