무선통신에 영향을 미치는 태양폭풍의 통계적 분석
박재우*, 김정훈**, 한진욱***
정회원
Statistical analysis for the solar eruption effect on wireless communication
Jae Woo Park*, Jung Hoon Kim**, Jin Wook Han***
Regular Members
요 약
세계2차대전을 통해 태양폭발은 레이더시스템에 큰 영향을 주는 것으로 밝혀졌다. 1942년 2월 28일의 전파교란 현상은 태양활동의 극 대기에 증가한 우주 광선(cosmic ray)에 의한 것이었다. 이러한 사실들이 밝혀지면서 태양폭발 및 태양 입자 활동에 관한 연구가 활발히 이루어졌다. 태양폭발이 우주선에 미치는 영향, 극 운행 비행기에 미치는 영향, 레이더 시스템에 미치는 영향, 무선통신시스템에 미치는 영향 등에 대한 연구가 다양하게 이루어 지고 있다. 본 논문에서는 지난 40여년 간의 태양전파 관측자료를 분석하여 태양폭발에 의해 무 선통신에 미치는 영향과 태양활동주기간의 상관관계를 분석하였다.
Key Words : Solar eruption, Wireless communication systems, Sunspot number, Solar radio burst, solar activity
ABSTRACT
In World War II, the solar eruption (solar flare) was revealed to make a significant effect to radar systems. The radio disturbance in February 28, 1942 was due to increased cosmic ray during solar maximum. Since such phenomena had been disclosed, many studies were accomplished on solar flare and solar particle event. Now various researches about the effects of solar flare on the spacecrafts, the airplanes flying across the pole, the radar systems, and wireless communication systems are studied. In this paper we analyzed the relationship between the harmful effect on the wireless communication by the solar eruption and the period of solar activity from the sunspot number data and the solar radio burst data for last 40 years.
* 한국전자통신연구원 위성무선융합연구부실([email protected])
** SETsystems([email protected])
*** 방통위 국립전파연구원 우주전파센터([email protected])
접수일자 : 2011년 11월 21일, 수정완료일자 : 2011년 11월 29일, 최종게재확정일자 : 2011년 12월 15일
I. Introduction
In World War II, the solar eruption (solar flare) was revealed to make a significant effect to radar systems [1]. The radio disturbance in February 28, 1942 was due to increased cosmic ray during solar maximum [2]. Since such phenomena had been disclosed, many studies were accomplished on solar flare and solar particle event [3][4]. Now various researches about the effects of solar flare on the spacecrafts, the airplanes flying across the pole, the
radar systems, and wireless communication systems are studied.
Bala, Nita, and Lanzerotti have investigated the effects of solar flare on wireless communication systems [5][6][7]. Since the nominal noise power level is PT=3.8x10⁻²¹ W/Hz = 38 SFU m2for a receiver of bandwidth, B = 1Hz operating at temperature, T = 2730K[8],so the receiver power PR will be
P
R= GBλ
2F /(8 π ) W/Hz (1)
where, λ is the carrier wavelength received, G is
a single polarization antenna gain, and F is an isotropic radio flux.
If the thermal noise level is equivalent to solar noise level, Equation (1) is shown as follows:
kTB = GBλ
2F
eq/(8 π ) (2) where, Feq is an equivalent solar flux.
Typically Feqis about 960 SFU for a wireless communication base station where the operating frequency is about 1 GHz and an antenna gain is about 10 dB, so the total input noise (PT + PR) is 3dB more than thermal noise. The equivalent solar flux Feq at a frequency of 1 GHz in some typical wireless communication is in the range from 300 SFU to 1000 SFU. Thus the harmful amount of a solar flux to wireless communication system might be more than 1000 SFU [9].
In this paper we analyzed the relationship between the harmful effect on the wireless communication by the solar eruption and the period of solar activity from the sunspot number data [10] and the solar radio burst data [11] for last 40 years.
2. Solar Flare Event Analysis
NGDC solar flare data in condition of the peak flux ≥ 103SFU and the flare event time duration ≥ 12 min are statistically analyzed for the observed frequency ranges from 30MHz to 2500MHz and from 1GHz to 20GHz.
2.1. Yearly Sunspot Numbers
A sunspot number is varied daily and monthly.
Thus the data of Yearly Mean Sunspot Numbers in the NGDC’s Daily Sunspot numbers in yearly tables were used for analysis. The yearly mean sunspot numbers observed from 1960 to 2007 are as shown in Figure 1.
Figure 1: Yearly Mean Sunspot Numbers
In Figure 1, the yearly distribution of the observed sunspot number shows the period of sunspot number’s increase and decrease according to the solar cycle, about 11 years.
2.2. Frequency Range between 30MHz and 2500MHz Radio Research Agency (RRA) in Korea is able to measure solar flares in the frequency range of 30MHz~2500MHz, so the relationship between the sunspot number (solar cycle) and the solar flare event number in this range was analyzed.
2.2.1. Solar Flare Event Observed in the frequency range between 30MHz and 2500MHz
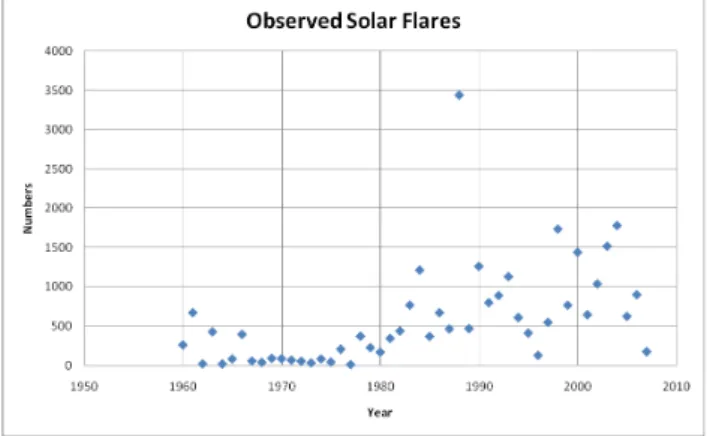
For the solar flare event number, the Solar Radio Burst Listing by year data provided by NGDC was used and the number of the observed solar flares is shown in Figure 2.
Figure 2: Observed Solar Flares (in the range of 30~2500MHz)
As shown in Figure 2, the observed solar flare events in between 1960 and 1977 are less than during other period. According to the NGDC’s observation data, only 11 years including the year of 1961 have the case that the solar flare events were observed for 10 months per one year. It is difficult to decide whether the period of no data means the time of no solar flare event or other reasons like some faults in any observation equipment made no data observed.
Figure 3 shows the relationship between the yearly
sunspot numbers and the solar flare events. The
observed solar flare events trends to increase since
1970’s. It might be caused by the development of
observation equipments. The NGDC’s data for solar
flare events in the observed frequency range between
30MHz and 2500MHz since 1980’s shows to have a
trend of a relationship with a solar cycle, but this
trend cannot make a conclusion for the relationship.
Figure 3: Observed solar flare events and the yearly sunspot numbers (30 MHz ~2500MHz)
2.2.2. Weighting Factor Calculation
Considering to any missing of solar flare events due to any reasons like equipment faults, we introduce a weighting factor for solar flare events from the number of solar flare observation days in order to estimate more practical yearly solar flare events.
The weighting factors were calculated with the number of yearly observation days based on NGDC’s data of the solar flare events in the whole frequency range. The weighting factor is shown in Table 1.
Table 1:Weighting Factors30
Year 1960 1961 1962 1963 1964 1965 1966 1967 1968 1969 Weighting
Factor 0.50 0.09 0.14 0.13 0.17 0.13 0.14 0.25 0.67 0.77 Year 1970 1971 1972 1973 1974 1975 1976 1977 1978 1979 Weighting
Factor 0.43 0.67 0.77 0.67 0.20 0.13 0.08 0.20 0.30 0.63 Year 1980 1981 1982 1983 1984 1985 1986 1987 1988 1989 Weighting
Factor 0.83 0.43 0.56 0.18 0.50 0.14 0.09 0.10 0.09 1.00 Year 1990 1991 1992 1993 1994 1995 1996 1997 1998 1999 Weighting
Factor 0.50 0.50 0.50 0.17 0.11 0.08 0.09 0.08 0.11 0.20 Year 2000 2001 2002 2003 2004 2005 2006 2007
Weighting
Factor 0.20 0.25 0.20 0.14 0.10 0.20 0.08 0.08
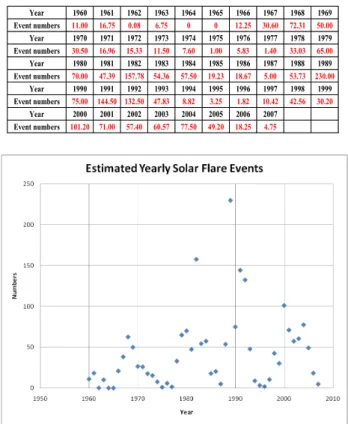
The estimated numbers of yearly solar flare event in the frequency range between 30 MHz and 2500MHz using the calculated weighting factors are described in Table 2 and Figure 4.
Table 2:Estimated Yearly Solar Flare Event (30 MHz ~2500MHz)
Year 1960 1961 1962 1963 1964 1965 1966 1967 1968 1969 Event numbers 131.00 61.09 3.00 53.63 3.33 10.38 56.57 14.25 26.67 70.00
Year 1970 1971 1972 1973 1974 1975 1976 1977 1978 1979 Event numbers 37.83 46.00 42.31 22.00 16.80 5.50 17.33 2.40 113.03 142.50
Year 1980 1981 1982 1983 1984 1985 1986 1987 1988 1989 Event numbers 141.67 150.00 243.89 139.64 606.50 52.86 61.00 46.50 312.55 469.00
Year 1990 1991 1992 1993 1994 1995 1996 1997 1998 1999 Event numbers 630.50 399.50 445.00 188.33 65.70 34.42 11.73 45.75 192.78 153.40
Year 2000 2001 2002 2003 2004 2005 2006 2007 Event numbers 288.00 161.50 207.60 216.71 178.00 125.00 75.00 14.67
Figure 4: Estimated Yearly Solar Flare Event (30 MHz
~2500MHz)
2.2.3. Relationship between the Estimated Solar Flare Event and the Sunspot Number
The trend of the solar flare event estimated using the above method is compared with the trend of the monthly mean sunspot number in Figure 5.
Figure 5: Relationships between Solar Flare Event and Sunspot Number (30 MHz ~2500MHz)
As shown in Figure 5, the estimated number of solar flare event in the frequency range between 30 MHz and 2500MHz must be related closely with the solar activity according to sunspot number.
3. Frequency Range between 1GHz and 20GHz
For the frequency range between 1GHz and
20GHz which is the weakest band for the wireless
communication when the solar flares are occurred,
the relationship between the solar flare event and
sunspot number is analyzed. The sunspot number is
shown in Figure 1. The weighting factor for the
frequency range between 1GHz and 20GHz can be
found using the same method as above. Thus the
estimated numbers of yearly solar flare event in the frequency range between 1GHz and 20GHz with the weighting factors are described in Table 3 and Figure 6.
Table 3: Estimated Yearly Solar Flare Event (1 GHz
~20GHz)
Year 1960 1961 1962 1963 1964 1965 1966 1967 1968 1969 Event numbers 11.00 16.75 0.08 6.75 0 0 12.25 30.60 72.31 50.00
Year 1970 1971 1972 1973 1974 1975 1976 1977 1978 1979 Event numbers 30.50 16.96 15.33 11.50 7.60 1.00 5.83 1.40 33.03 65.00
Year 1980 1981 1982 1983 1984 1985 1986 1987 1988 1989 Event numbers 70.00 47.39 157.78 54.36 57.50 19.23 18.67 5.00 53.73 230.00
Year 1990 1991 1992 1993 1994 1995 1996 1997 1998 1999 Event numbers 75.00 144.50 132.50 47.83 8.82 3.25 1.82 10.42 42.56 30.20
Year 2000 2001 2002 2003 2004 2005 2006 2007 Event numbers 101.20 71.00 57.40 60.57 77.50 49.20 18.25 4.75
Figure 6: Estimated Yearly Solar Flare Event (1 GHz ~20GHz)
The relationship between the estimated solar flare event and the monthly mean sunspot number is plotted in Figure 7.
Figure 7 shows that the estimated number of solar flare event in the frequency range between 1GHz and 20GHz also must be related closely with the solar activity according to sunspot number.
Figure 7: Relationship between Solar Flare Event and Sunspot Number (1GHz ~ 20GHz)
3. Conclusions
The estimated number of solar flare event in the frequency ranges between 30 MHz and 2500MHz and between 1GHz and 20GHz has quite close relationship with the solar activity according to sunspot number. Comparing two figures, Figure 5 and Figure 7, the solar flare event in the frequency range between 1GHz and 20GHz seems to be related with the sunspot number closer than between 30 MHz and 2500MHz.
Figure 8: Relationship between the Solar Flare Events in Different Frequency Ranges