http://e-nrp.org
Dietary intake of fat and fatty acids by 1-5-year-old children in Korea: a cross-sectional study based on data from the sixth Korea National Health and Nutrition Examination Survey
YounJoo Baek
1, Jae Eun Shim
2and SuJin Song
3§1Department of Human Ecology, Korea National Open University, Seoul 03087, Korea
2Department of Food and Nutrition, Daejeon University, Daejeon 34520, Korea
3Department of Food and Nutrition, Hannam University, 1646 yuseong-daero, Yuseong-gu, Daejeon 34054, Korea
BACKGROUND/OBJECTIVES: We examined dietary fat intake and the major food sources by young children in Korea.
SUBJECTS/METHODS: A total of 1,041 children aged 1-5 years were identified from the 2013-2015 Korea National Health and Nutrition Examination Survey. Data on total fat and fatty acid intake were obtained by a single 24-h dietary recall. Food sources were identified based on the amounts of total fat and fatty acids consumption according to each food. Fat and fatty acid intakes and their food sources were presented by age group (1-2-y, n = 401; 3-5-y, n = 640). Fat and fatty acid intakes were also evaluated according to socioeconomic characteristics.
RESULTS: The mean intake of fat was 27.1 ± 0.8 g in the 1-2-y group and 35.5 ± 0.7 g in the 3-5-y group, and about 23%
of the total energy was obtained from fat in both age groups. The mean intake of saturated fatty acids (SFA) was 10.5 ± 0.3 g in the 1-2-y group and 12.7 ± 0.3 g in the 3-5-y group, with the 1-2-y group obtaining more energy from SFA than the 3-5-y group (9.2% vs. 8.3%). The mean intake of polyunsaturated fatty acids (PUFA) was 6.3 ± 0.1 g in the total subjects, with 0.8 ± 0.03 g of n-3 fatty acids and 5.5 ± 0.1 g of n-6 fatty acids being consumed. Milk, pork, and eggs were major food sources of total fat, SFA, and monounsaturated fatty acids, and soybean oil was the main contributor to PUFA in both age groups. In the 1-2-y group, children in rural areas had significantly higher intake of PUFA and n-3 fatty acids than did those in urban areas.
CONCLUSIONS: Our findings provide current information on dietary fat intake among young Korean children and could be used to establish dietary strategies for improvement of health status.
Nutrition Research and Practice 2018;12(4):324-335; https://doi.org/10.4162/nrp.2018.12.4.324; pISSN 1976-1457 eISSN 2005-6168
Keywords: Dietary fats, child, preschool, Korea
INTRODUCTION
*Early childhood is an important period for physical growth and cognitive development. Health status in childhood tends to be associated with the risk of morbidity and mortality in adulthood [1,2]. Therefore, nutrition in early childhood is of great importance to the wellbeing of the child as well as to their health status later in life.
Dietary fat and fatty acids play an essential role in supporting healthy growth and development in young children [3].
Adequate intake of total fat and fatty acids represents a dense energy source, which helps children meet high energy needs for rapid growth [3]. In particular, polyunsaturated fatty acids (PUFA) are involved in the formation and function of cell membranes, visual and neural development, and immune
function [4,5]. Reduced intake of saturated fatty acids (SFA) has been associated with decreased total cholesterol, low-density lipoprotein cholesterol, and blood pressure among both children and adolescents [6,7].
Previous studies conducted in the US and Europe have documented young children’s intakes of total fat and fatty acids [8-17]. Based on the National Health and Nutrition Examination Survey from 2013 to 2014, US children aged 2-5 years consumed 55.7 g of total fat (32% of their energy) and 20.1 g of SFA (11%
of their energy) among males and consumed 51.9 g of total fat (33% of their energy) and 18.8 g of SFA (12% of their energy) among females [8]. Based on recent data collected in the Netherlands, children aged 1-3 years obtained about 30% of their energy from total fat, 11% from SFA, 10% from monounsaturated fatty acid (MUFA), and 6% from PUFA [14,15].
This work was supported by the National Research Foundation of Korea (NRF) grant funded by the Korea government (MSIT; Ministry of Science and ICT) (Grant No. NRF-2017R1C1B5017637).
§Corresponding Author: SuJin Song, Tel. 82-42-629-8791, Fax. 82-42-629-8788. Email. [email protected] Received: April 2, 2018, Revised: July 5, 2018, Accepted: July 16, 2018
This is an Open Access article distributed under the terms of the Creative Commons Attribution Non-Commercial License (http://creativecommons.org/licenses/by-nc/3.0/) which permits unrestricted non-commercial use, distribution, and reproduction in any medium, provided the original work is properly cited.
YounJoo Baek et al.
325
In a Belgian study of 6-36-month-old children, total fat intake was estimated to be 39-45 g per day (31-33% of their energy) [16].
However, there have been few studies conducted on total fat and fatty acid intake among young children in Asian countries. In the 2015 Japan National Health and Nutrition Survey, children aged 1-6 years consumed 40.4 g of total fat (28% of their energy) and 12.8 g of SFA [18]. A Malaysian study reported that 1-6-year-old children gained 30-33% of their energy from total fat, with 11-13% of their energy being from SFA [19], whereas a study in Bangladesh showed much lower intake of total fat and SFA among children aged 24-48 months [20].
Notably, sociodemographic status contributors such as living area, maternal education level, and household income are known to be critical determinants of diet composition among children [19,21-23]. Children with a low household income status [19,22] or with less-educated mothers [21,23] showed a higher risk of having inadequate diets. However, limited information on dietary disparities according to sociode- mographic characteristics in terms of dietary fats is available.
Despite the important role of dietary fat and fatty acids in young children, there have been few studies that have assessed total fat and fatty acid intake in Korean toddlers and children due to the limited information on the fatty acids composition of Korean foods. Recently, a comprehensive database of fatty acid for Korean foods was developed [24], and so it is now possible to produce more precise estimates of the consumption of total fat and fatty acids in the Korean population. To our knowledge, no studies have examined food sources of total fat and fatty acids among young children in Korean, which may differ from food sources in adults.
Identifying the current status of total fat and fatty acids intakes along with their food sources among young children is necessary to provide specific dietary guidelines and tailor nutrition policies for improvement of children’s health.
Therefore, the aim of this study was to evaluate the intake of total fat and fatty acids and their major food sources among 1-5-year-old Korean children using national data. We also examined sociodemographic factors that may relate to the intake of fat and fatty acids in young children, such as living area, household income, and maternal education level.
SUBJECTS AND METHODS
Data and subjectsThis study used data from the sixth Korea National Health and Nutrition Examination Survey (KNHANES VI; conducted from 2013 to 2015), which was administered by the Korea Centers for Disease Control and Prevention. The KNHANES is a cross-sectional and nationally representative survey that employs multistage stratified cluster sampling and consists of a health interview survey, a health examination survey, and a nutrition survey [25]. Survey participants are recruited from a nationally representative sample of non-institutionalized Korean individuals aged 1 year or older.
A total of 1,386 children aged 1-5 years participated in the KNHANES VI. With regard to these individuals, the current study
excluded them if they had missing variables for dietary variables, living area, household income, and/or mother’s education level;
if they had a history of diagnosis of diabetes or congenital heart disease; and if total energy intake was not within ± 3 standard deviation of the mean energy intake for each sex and age group, in order to avoid the inclusion of individuals with implausible intake [19]. The final subjects considered in the analyses in this study were 1,041 children (1-2 years old, n =
401; 3-5 years old, n = 640). This study was approved by the Institutional Review Board of the Korea Centers for Disease Control and Prevention (2013-07CON-03-4C, 2013-12 EXP-03-5C) for the years 2013 and 2014. Since the 2015 KNHANES has been exempted from review about research ethics based on Bioethics and Safety Act. Written informed consent was obtained from parents or guardians of all study subjects.
Assessment of dietary variables
Dietary intake data were obtained by use of a 24-h dietary recall protocol as part of the nutrition survey. The dietary data were collected by trained dietitians at the participant’s home, one week after the health interview survey and health examina- tion survey were completed. Total energy and macronutrient intake were calculated using a food composition table published by the Rural Development Administration of Korea [26]. Fatty acid intake was calculated using a newly developed database containing fatty acid content information for 5,144 foods items [24]. The detailed process of the database development is described elsewhere [24]. Children’s total fat and fatty acid intake were evaluated as absolute intake in grams (g) and percentage of total energy intake (%kcal). The ratio of PUFA to SFA was calculated as PUFA intake divided by SFA intake. The ratio of n-6 fatty acids (n-6 FA) to n-3 fatty acids (n-3 FA) was calculated as n-6 FA intake divided by n-3 FA intake. To identify major food sources of total fat and fatty acids, the tertiary food codes of the KNHANES were used. Food sources of total fat and fatty acids were identified based on the amounts of total fat and fatty acids consumption by each food. The major food sources were determined by taking the ratio of total fat and fatty acids provided by each food over the total intake of fat and fatty acids from all foods.
Measurement of other variables
Demographic (e.g., sex, age) and socioeconomic (e.g., living area, household income, mother’s education level) variables were measured during the health interview survey by a questionnaire. Children’s living area was classified into two groups: urban and rural. Household income was classified into two groups: low (quartiles 1 and 2) and high (quartiles 3 and 4). In the KNHANES VI data, mother’s educational level was determined by four categories in accordance with their gradua- tion status (either elementary school, middle school, high school, or college or more). Based on the distribution of the mother’s education level, the data were re-categorized into the following two groups in this study: ≤ high school graduation and ≥ college graduation.
Statistical analyses
All statistical analyses were performed using the SAS software
Fig. 1. Energy and macronutrient intakes by age group1). 1)All analyses accounted for the complex sampling design effect and appropriate sampling weights.
Total
(n = 1,041) 1-2 yrs
(n = 401) 3-5 yrs
(n = 640) P-value2)
n (%) n (%) n (%)
Sex
Male 540 (51.9) 198 (49.2) 342 (53.7) 0.210
Female 501 (48.1) 203 (50.8) 298 (46.3)
Living area
Urban 882 (84.9) 335 (83.1) 547 (86.1) 0.267
Rural 159 (15.1) 66 (16.9) 93 (13.9)
Household income
Low 370 (35.8) 148 (37.4) 222 (34.8) 0.365
High 671 (64.2) 253 (62.6) 418 (65.2)
Mother’s education
≤ High school 364 (35.6) 139 (34.3) 225 (36.3) 0.535
≥ College 677 (64.4) 262 (65.7) 415 (63.7)
1)All analyses accounted for the complex sampling design effect and appropriate sampling weights.
2)P-values were obtained from the Rao-Scott chi-square test.
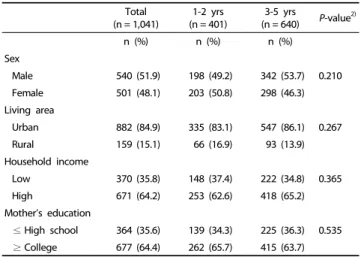
Table 1. Characteristics of the study subjects by age group1)
version 9.4 (SAS Institute, Cary, NC, USA). All analyses accounted for the complex survey design, which consisted of multistage, stratified, and clustered samples, and survey weights to reflect the estimates of the entire Korean population. The analyses were separately conducted for the 1-2-y and 3-5-y groups, respectively. Intake of total energy, macronutrients, and fatty acids were expressed as mean ± standard error (SE) and the food sources of total fat and fatty acids were presented with percentages and cumulative percentages of total consumption.
Children’s characteristics were expressed as frequencies and percentages and compared between the two age groups using the Rao-Scott chi-square test. Intake of total fat and fatty acids by living area, household income, and mother’s education level were analyzed using the analysis of covariance test after adjustment for sex and energy intake. All tests of significance were two-tailed and P-values < 0.05 were considered to be significant.
RESULTS
Characteristics of the study subjects
Table 1 shows the characteristics of the children by age group. Among 1,041 children included in this study, 52% were male, and about 85% of the children lived in urban areas.
Children with higher household income status composed about 64% of this study population, and 64% of the children had mothers who had completed college or more. The distribution of sex, living area, household income, and mother’s education level did not differ by age group. Fig. 1 presents the total energy and macronutrient intake by age group. Children in the 3-5-y group had higher energy intake but lower protein intake than did children in the 1-2-y group (1,386 kcal vs. 1,058 kcal, P-value
< 0.001 for energy intake; 13.2% vs. 13.7%, P-value = 0.042 for protein intake). The percentages of energy obtained from carbohydrates and fat did not statistically differ by age group.
Total fat and fatty acids intake by age group
Table 2 shows the total fat and fatty acids intake according to age group. The mean intake of total fat was 27.1 ± 0.8 g
in the 1-2-y group and 35.5 ± 0.7 g in the 3-5-y group, and about 23% of the children’s energy was obtained from total fat in both age groups. The mean intake of SFA was 10.5 ±
0.3 g in the 1-2-y group and 12.7 ± 0.3 g in the 3-5y group, whereas children in the 1-2-y group obtained more energy from SFA than did children in the 3-5-y group (9.2% vs. 8.3%). The mean intake of PUFA was 6.3 ± 0.1 g in the 1-5-y group, with 0.8 ± 0.03 g of n-3 FA and 5.5 ± 0.1 g of n-6 FA being consumed.
The percentages of energy from PUFA, n-3 FA, and n-6 FA were higher in the 3-5-y group than in the 1-2-y group.
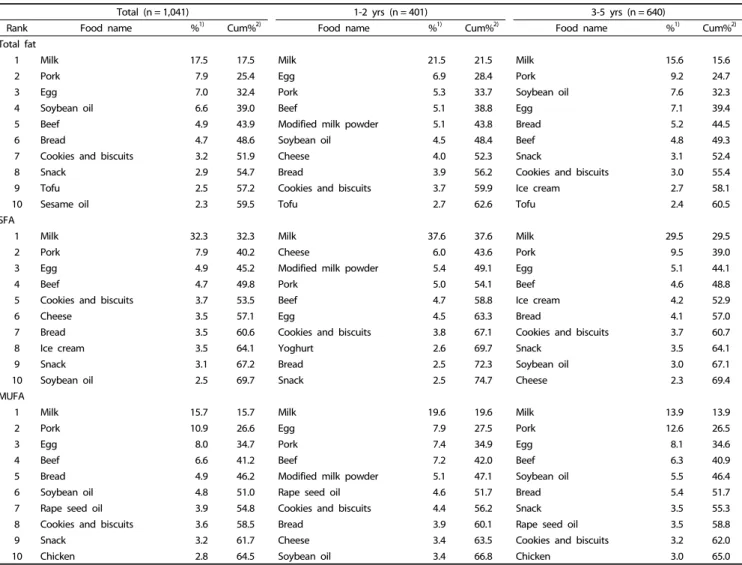
Major food sources of total fat and fatty acids
Main food sources of total fat and fatty acids are presented in Table 3. Milk, pork, and eggs were the major food sources of total fat, SFA, and MUFA in this study. In the 1-2-y group, cheese and modified milk powder also provided 6.0% and 5.4%
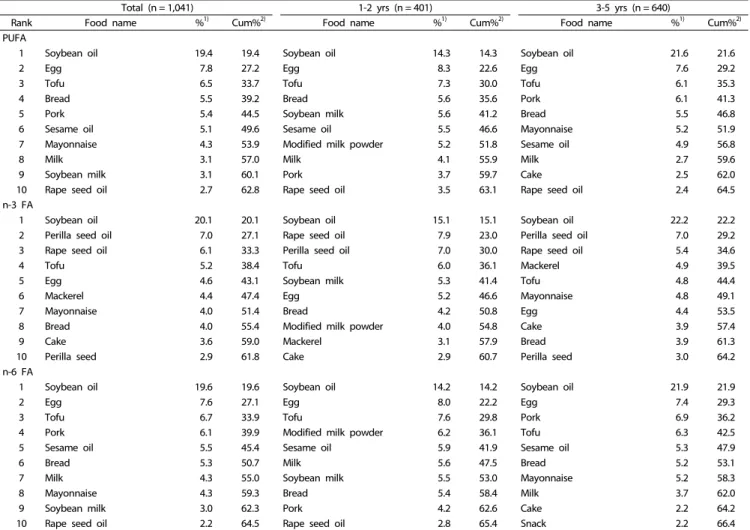
of SFA intake, respectively. Soybean oil was the main contributor to PUFA intake in both age groups, providing 14.3% and 21.6%
of PUFA in the 1-2-y and 3-5-y groups, respectively. Eggs, tofu,
Total (n = 1,041) 1-2 yrs (n = 401) 3-5 yrs (n = 640)
Rank Food name %1) Cum%2) Food name %1) Cum%2) Food name %1) Cum%2)
Total fat
1 Milk 17.5 17.5 Milk 21.5 21.5 Milk 15.6 15.6
2 Pork 7.9 25.4 Egg 6.9 28.4 Pork 9.2 24.7
3 Egg 7.0 32.4 Pork 5.3 33.7 Soybean oil 7.6 32.3
4 Soybean oil 6.6 39.0 Beef 5.1 38.8 Egg 7.1 39.4
5 Beef 4.9 43.9 Modified milk powder 5.1 43.8 Bread 5.2 44.5
6 Bread 4.7 48.6 Soybean oil 4.5 48.4 Beef 4.8 49.3
7 Cookies and biscuits 3.2 51.9 Cheese 4.0 52.3 Snack 3.1 52.4
8 Snack 2.9 54.7 Bread 3.9 56.2 Cookies and biscuits 3.0 55.4
9 Tofu 2.5 57.2 Cookies and biscuits 3.7 59.9 Ice cream 2.7 58.1
10 Sesame oil 2.3 59.5 Tofu 2.7 62.6 Tofu 2.4 60.5
SFA
1 Milk 32.3 32.3 Milk 37.6 37.6 Milk 29.5 29.5
2 Pork 7.9 40.2 Cheese 6.0 43.6 Pork 9.5 39.0
3 Egg 4.9 45.2 Modified milk powder 5.4 49.1 Egg 5.1 44.1
4 Beef 4.7 49.8 Pork 5.0 54.1 Beef 4.6 48.8
5 Cookies and biscuits 3.7 53.5 Beef 4.7 58.8 Ice cream 4.2 52.9
6 Cheese 3.5 57.1 Egg 4.5 63.3 Bread 4.1 57.0
7 Bread 3.5 60.6 Cookies and biscuits 3.8 67.1 Cookies and biscuits 3.7 60.7
8 Ice cream 3.5 64.1 Yoghurt 2.6 69.7 Snack 3.5 64.1
9 Snack 3.1 67.2 Bread 2.5 72.3 Soybean oil 3.0 67.1
10 Soybean oil 2.5 69.7 Snack 2.5 74.7 Cheese 2.3 69.4
MUFA
1 Milk 15.7 15.7 Milk 19.6 19.6 Milk 13.9 13.9
2 Pork 10.9 26.6 Egg 7.9 27.5 Pork 12.6 26.5
3 Egg 8.0 34.7 Pork 7.4 34.9 Egg 8.1 34.6
4 Beef 6.6 41.2 Beef 7.2 42.0 Beef 6.3 40.9
5 Bread 4.9 46.2 Modified milk powder 5.1 47.1 Soybean oil 5.5 46.4
6 Soybean oil 4.8 51.0 Rape seed oil 4.6 51.7 Bread 5.4 51.7
7 Rape seed oil 3.9 54.8 Cookies and biscuits 4.4 56.2 Snack 3.5 55.3
8 Cookies and biscuits 3.6 58.5 Bread 3.9 60.1 Rape seed oil 3.5 58.8
9 Snack 3.2 61.7 Cheese 3.4 63.5 Cookies and biscuits 3.2 62.0
10 Chicken 2.8 64.5 Soybean oil 3.4 66.8 Chicken 3.0 65.0
Table 3. Main food sources of total fat and fatty acids by age group
YounJoo Baek et al.
327
Total (n = 1,041) 1-2 yrs (n = 401) 3-5 yrs (n = 640)
Daily intake (g, mean ± SE) P-value2)
Total fat 32.2 ± 0.5 27.1 ± 0.8 35.5 ± 0.7 0.392
SFA 11.8 ± 0.2 10.5 ± 0.3 12.7 ± 0.3 0.033
MUFA 10.2 ± 0.2 8.5 ± 0.3 11.3 ± 0.2 0.708
PUFA 6.3 ± 0.1 4.9 ± 0.2 7.1 ± 0.2 0.154
n-3 FA 0.8 ± 0.03 0.6 ± 0.03 0.9 ± 0.04 0.356
n-6 FA 5.5 ± 0.1 4.4 ± 0.2 6.3 ± 0.2 0.253
PUFA:SFA ratio 0.6 ± 0.01 0.6 ± 0.02 0.6 ± 0.02 0.050
n-6:n-3 FA ratio 8.6 ± 0.2 8.9 ± 0.3 8.4 ± 0.2 0.452
Percentage of energy (%kcal, mean ± SE) P-value3)
Total fat 23.1 ± 0.3 23.3 ± 0.5 23.0 ± 0.3 0.603
SFA 8.6 ± 0.1 9.2 ± 0.3 8.3 ± 0.1 0.003
MUFA 7.3 ± 0.1 7.3 ± 0.2 7.3 ± 0.1 0.604
PUFA 4.4 ± 0.1 4.2 ± 0.1 4.6 ± 0.1 0.007
n-3 FA 0.6 ± 0.02 0.5 ± 0.02 0.6 ± 0.02 0.012
n-6 FA 3.9 ± 0.1 3.7 ± 0.1 4.0 ± 0.1 0.032
SE, standard error; MUFA, monounsaturated fatty acid; n-3 FA, n-3 fatty acid; n-6 FA, n-6 fatty acid; PUFA, polyunsaturated fatty acid; SFA, saturated fatty acid.
1)All analyses accounted for the complex sampling design effect and appropriate sampling weights.
2)P-valueswere obtained from the analysis of covariance test after adjustment for sex and total energy intake.
3)P-valueswere obtained from the analysis of covariance test after adjustment for sex.
Table 2. Total fat and fatty acids intakes by age group1)
Total 1-2 yrs 3-5 yrs Urban
(n = 882)
Rural (n = 159)
Urban (n = 335)
Rural (n = 66)
Urban (n = 547)
Rural (n = 93)
Daily intake (g, mean ± SE) P-value2) P-value2) P-value2)
Total fat 32.5 ± 0.6 30.7 ± 1.4 0.515 27.1 ± 0.8 27.0 ± 2.5 0.885 35.8 ± 0.8 33.5 ± 1.9 0.292
SFA 12.0 ± 0.2 11.0 ± 0.7 0.257 10.6 ± 0.3 10.1 ± 1.2 0.674 12.8 ± 0.3 11.7 ± 0.8 0.173
MUFA 10.3 ± 0.2 9.7 ± 0.5 0.574 8.5 ± 0.3 8.4 ± 0.8 0.952 11.4 ± 0.3 10.7 ± 0.6 0.391
PUFA 6.3 ± 0.2 6.3 ± 0.3 0.381 4.8 ± 0.2 5.5 ± 0.4 0.020 7.1 ± 0.2 6.9 ± 0.4 0.902
n-3 FA 0.8 ± 0.03 0.8 ± 0.1 0.377 0.6 ± 0.03 0.8 ± 0.1 0.037 0.9 ± 0.04 0.9 ± 0.1 0.771
n-6 FA 5.5 ± 0.1 5.6 ± 0.3 0.401 4.3 ± 0.2 4.8 ± 0.4 0.056 6.3 ± 0.2 6.1 ± 0.4 0.999
PUFA:SFA ratio 0.6 ± 0.02 0.7 ± 0.04 0.053 0.5 ± 0.03 0.7 ± 0.06 0.049 0.6 ± 0.02 0.7 ± 0.03 0.389
n-6:n-3 FA ratio 8.7 ± 0.2 8.3 ± 0.3 0.298 9.0 ± 0.3 8.2 ± 0.5 0.185 8.4 ± 0.2 8.3 ± 0.4 0.788
Percentage of energy (%kcal, mean ± SE) P-value3) P-value3) P-value3)
Total fat 23.2 ± 0.3 22.6 ± 0.6 0.393 23.3 ± 0.5 23.1 ± 1.3 0.844 23.1 ± 0.3 22.3 ± 0.8 0.288
SFA 8.7 ± 0.1 8.1 ± 0.4 0.157 9.3 ± 0.3 8.5 ± 0.8 0.342 8.4 ± 0.1 7.8 ± 0.4 0.189
MUFA 7.3 ± 0.1 7.2 ± 0.2 0.555 7.3 ± 0.2 7.3 ± 0.5 0.997 7.4 ± 0.1 7.1 ± 0.3 0.359
PUFA 4.4 ± 0.1 4.6 ± 0.2 0.265 4.1 ± 0.1 4.7 ± 0.2 0.021 4.6 ± 0.1 4.6 ± 0.2 0.967
n-3 FA 0.6 ± 0.02 0.6 ± 0.04 0.182 0.5 ± 0.02 0.7 ± 0.1 0.036 0.6 ± 0.02 0.6 ± 0.04 0.941
n-6 FA 3.9 ± 0.1 4.1 ± 0.2 0.348 3.7 ± 0.1 4.1 ± 0.2 0.066 4.0 ± 0.1 4.0 ± 0.2 0.999
SE, standard error; MUFA, monounsaturated fatty acid; n-3 FA, n-3 fatty acid; n-6 FA, n-6 fatty acid; PUFA, polyunsaturated fatty acid; SFA, saturated fatty acid.
1)All analyses accounted for the complex sampling design effect and appropriate sampling weights.
2)P-valueswere obtained from the analysis of covariance test after adjustment for sex and total energy intake.
3)P-valueswere obtained from the analysis of covariance test after adjustment for sex.
Table 4. Total fat and fatty acids intakes by age group and living area1)
Total (n = 1,041) 1-2 yrs (n = 401) 3-5 yrs (n = 640)
Rank Food name %1) Cum%2) Food name %1) Cum%2) Food name %1) Cum%2)
PUFA
1 Soybean oil 19.4 19.4 Soybean oil 14.3 14.3 Soybean oil 21.6 21.6
2 Egg 7.8 27.2 Egg 8.3 22.6 Egg 7.6 29.2
3 Tofu 6.5 33.7 Tofu 7.3 30.0 Tofu 6.1 35.3
4 Bread 5.5 39.2 Bread 5.6 35.6 Pork 6.1 41.3
5 Pork 5.4 44.5 Soybean milk 5.6 41.2 Bread 5.5 46.8
6 Sesame oil 5.1 49.6 Sesame oil 5.5 46.6 Mayonnaise 5.2 51.9
7 Mayonnaise 4.3 53.9 Modified milk powder 5.2 51.8 Sesame oil 4.9 56.8
8 Milk 3.1 57.0 Milk 4.1 55.9 Milk 2.7 59.6
9 Soybean milk 3.1 60.1 Pork 3.7 59.7 Cake 2.5 62.0
10 Rape seed oil 2.7 62.8 Rape seed oil 3.5 63.1 Rape seed oil 2.4 64.5
n-3 FA
1 Soybean oil 20.1 20.1 Soybean oil 15.1 15.1 Soybean oil 22.2 22.2
2 Perilla seed oil 7.0 27.1 Rape seed oil 7.9 23.0 Perilla seed oil 7.0 29.2
3 Rape seed oil 6.1 33.3 Perilla seed oil 7.0 30.0 Rape seed oil 5.4 34.6
4 Tofu 5.2 38.4 Tofu 6.0 36.1 Mackerel 4.9 39.5
5 Egg 4.6 43.1 Soybean milk 5.3 41.4 Tofu 4.8 44.4
6 Mackerel 4.4 47.4 Egg 5.2 46.6 Mayonnaise 4.8 49.1
7 Mayonnaise 4.0 51.4 Bread 4.2 50.8 Egg 4.4 53.5
8 Bread 4.0 55.4 Modified milk powder 4.0 54.8 Cake 3.9 57.4
9 Cake 3.6 59.0 Mackerel 3.1 57.9 Bread 3.9 61.3
10 Perilla seed 2.9 61.8 Cake 2.9 60.7 Perilla seed 3.0 64.2
n-6 FA
1 Soybean oil 19.6 19.6 Soybean oil 14.2 14.2 Soybean oil 21.9 21.9
2 Egg 7.6 27.1 Egg 8.0 22.2 Egg 7.4 29.3
3 Tofu 6.7 33.9 Tofu 7.6 29.8 Pork 6.9 36.2
4 Pork 6.1 39.9 Modified milk powder 6.2 36.1 Tofu 6.3 42.5
5 Sesame oil 5.5 45.4 Sesame oil 5.9 41.9 Sesame oil 5.3 47.9
6 Bread 5.3 50.7 Milk 5.6 47.5 Bread 5.2 53.1
7 Milk 4.3 55.0 Soybean milk 5.5 53.0 Mayonnaise 5.2 58.3
8 Mayonnaise 4.3 59.3 Bread 5.4 58.4 Milk 3.7 62.0
9 Soybean milk 3.0 62.3 Pork 4.2 62.6 Cake 2.2 64.2
10 Rape seed oil 2.2 64.5 Rape seed oil 2.8 65.4 Snack 2.2 66.4
MUFA, monounsaturated fatty acid; n-3 FA, n-3 fatty acid; n-6 FA, n-6 fatty acid; PUFA, polyunsaturated fatty acid; SFA, saturated fatty acid.
1)Percentages of total intake.
2)Cumulative percentages of total intake.
Table 3. continued
YounJoo Baek et al.
329
Total 1-2 yrs 3-5 yrs
Low (n = 370)
High (n = 671)
Low (n = 148)
High (n = 253)
Low (n = 222)
High (n = 418)
Daily intake (g, mean ± SE) P-value2) P-value2) P-value2)
Total fat 30.3 ± 0.8 33.3 ± 0.7 0.122 26.4 ± 1.2 27.6 ± 1.1 0.841 33.0 ± 1.1 36.8 ± 0.9 0.071
SFA 11.1 ± 0.3 12.2 ± 0.3 0.120 10.2 ± 0.5 10.7 ± 0.4 0.751 11.7 ± 0.4 13.2 ± 0.4 0.076
MUFA 9.7 ± 0.3 10.6 ± 0.2 0.349 8.3 ± 0.4 8.6 ± 0.4 0.949 10.6 ± 0.4 11.7 ± 0.3 0.215
PUFA 5.8 ± 0.2 6.5 ± 0.2 0.221 4.6 ± 0.3 5.1 ± 0.3 0.383 6.6 ± 0.3 7.4 ± 0.3 0.334
n-3 FA 0.7 ± 0.04 0.8 ± 0.05 0.464 0.6 ± 0.1 0.6 ± 0.05 0.616 0.9 ± 0.1 1.0 ± 0.05 0.530
n-6 FA 5.1 ± 0.2 5.8 ± 0.2 0.191 4.1 ± 0.2 4.6 ± 0.2 0.351 5.8 ± 0.2 6.5 ± 0.2 0.309
PUFA:SFA ratio 0.6 ± 0.03 0.6 ± 0.02 0.566 0.6 ± 0.04 0.6 ± 0.03 0.950 0.7 ± 0.03 0.6 ± 0.02 0.406
n-6:n-3 FA ratio 8.9 ± 0.3 8.5 ± 0.2 0.236 9.1 ± 0.4 8.8 ± 0.3 0.543 8.7 ± 0.3 8.3 ± 0.2 0.257
Percentage of energy (%kcal, mean ± SE) P-value3) P-value3) P-value3)
Total fat 22.7 ± 0.4 23.3 ± 0.3 0.267 23.3 ± 0.7 23.3 ± 0.6 0.994 22.4 ± 0.5 23.3 ± 0.3 0.106
SFA 8.5 ± 0.2 8.7 ± 0.2 0.385 9.1 ± 0.4 9.2 ± 0.3 0.814 8.0 ± 0.2 8.4 ± 0.2 0.204
MUFA 7.2 ± 0.2 7.4 ± 0.1 0.356 7.3 ± 0.3 7.2 ± 0.2 0.901 7.1 ± 0.2 7.5 ± 0.1 0.165
PUFA 4.3 ± 0.1 4.5 ± 0.1 0.414 4.1 ± 0.2 4.2 ± 0.2 0.752 4.5 ± 0.1 4.6 ± 0.1 0.448
n-3 FA 0.5 ± 0.02 0.6 ± 0.03 0.267 0.5 ± 0.03 0.5 ± 0.04 0.451 0.6 ± 0.03 0.6 ± 0.03 0.396
n-6 FA 3.8 ± 0.1 4.0 ± 0.1 0.408 3.7 ± 0.2 3.8 ± 0.2 0.764 3.9 ± 0.1 4.1 ± 0.1 0.430
SE, standard error; MUFA, monounsaturated fatty acid; n-3 FA, n-3 fatty acid; n-6 FA, n-6 fatty acid; PUFA, polyunsaturated fatty acid; SFA, saturated fatty acid.
1)All analyses accounted for the complex sampling design effect and appropriate sampling weights.
2)P-valueswere obtained from the analysis of covariance test after adjustment for sex and total energy intake.
3)P-valueswere obtained from the analysis of covariance test after adjustment for sex.
Table 5. Total fat and fatty acids intakes by age group and household income1)
Total 1-2 yrs 3-5 yrs
≤ High school
(n = 364) ≥ College
(n = 677) ≤ High school
(n = 139) ≥ College
(n = 262) ≤ High school
(n = 225) ≥ College (n = 415)
Daily intake (g, mean ± SE) P-value2) P-value2) P-value2)
Total fat 31.2 ± 0.9 32.8 ± 0.7 0.921 26.4 ± 1.3 27.5 ± 1.0 0.560 34.1 ± 1.3 36.3 ± 0.8 0.758
SFA 11.6 ± 0.4 12.0 ± 0.3 0.709 10.4 ± 0.7 10.6 ± 0.4 0.612 12.3 ± 0.5 12.9 ± 0.3 0.824
MUFA 9.8 ± 0.3 10.5 ± 0.2 0.841 8.2 ± 0.4 8.7 ± 0.4 0.805 10.8 ± 0.4 11.6 ± 0.3 0.652
PUFA 5.9 ± 0.2 6.4 ± 0.2 0.599 4.7 ± 0.3 5.0 ± 0.2 0.834 6.7 ± 0.3 7.4 ± 0.2 0.367
n-3 FA 0.8 ± 0.05 0.8 ± 0.03 0.711 0.6 ± 0.04 0.7 ± 0.04 0.407 0.9 ± 0.1 0.9 ± 0.04 0.884
n-6 FA 5.3 ± 0.2 5.7 ± 0.2 0.630 4.3 ± 0.3 4.5 ± 0.2 0.675 5.9 ± 0.3 6.5 ± 0.2 0.333
PUFA:SFA ratio 0.6 ± 0.03 0.6 ± 0.02 0.939 0.6 ± 0.04 0.6 ± 0.03 0.657 0.6 ± 0.03 0.6 ± 0.02 0.546
n-6:n-3 FA ratio 9.2 ± 0.3 8.3 ± 0.2 0.011 10.1 ± 0.6 8.3 ± 0.2 0.006 8.7 ± 0.3 8.3 ± 0.2 0.335
Percentage of energy (%kcal, mean ± SE) P-value3) P-value3) P-value3)
Total fat 23.1 ± 0.5 23.1 ± 0.3 0.979 23.9 ± 0.9 22.9 ± 0.6 0.369 22.6 ± 0.5 23.2 ± 0.4 0.304
SFA 8.7 ± 0.3 8.6 ± 0.2 0.880 9.4 ± 0.5 9.1 ± 0.3 0.650 8.2 ± 0.2 8.3 ± 0.2 0.862
MUFA 7.3 ± 0.2 7.3 ± 0.1 0.838 7.5 ± 0.3 7.1 ± 0.2 0.424 7.2 ± 0.2 7.4 ± 0.1 0.229
PUFA 4.4 ± 0.1 4.4 ± 0.1 0.650 4.3 ± 0.2 4.1 ± 0.2 0.396 4.4 ± 0.2 4.7 ± 0.1 0.183
n-3 FA 0.6 ± 0.03 0.6 ± 0.02 0.626 0.5 ± 0.04 0.5 ± 0.03 0.721 0.6 ± 0.04 0.6 ± 0.02 0.657
n-6 FA 3.9 ± 0.1 3.9 ± 0.1 0.691 3.9 ± 0.2 3.7 ± 0.1 0.287 3.9 ± 0.1 4.1 ± 0.1 0.151
SE, standard error; MUFA, monounsaturated fatty acid; n-3 FA, n-3 fatty acid; n-6 FA, n-6 fatty acid; PUFA, polyunsaturated fatty acid; SFA, saturated fatty acid.
1)All analyses accounted for the complex sampling design effect and appropriate sampling weights.
2)P -valueswere obtained from the analysis of covariance test after adjustment for sex and total energy intake.
3)P -valueswere obtained from the analysis of covariance test after adjustment for sex.
Table 6. Total fat and fatty acids intakes by age group and mother’s education level1)
and bread were also major food sources of PUFA in children aged 1 year to 5 years. Children in both age groups mainly obtained n-3 FA from the consumption of perilla seed oil and rapeseed oil.
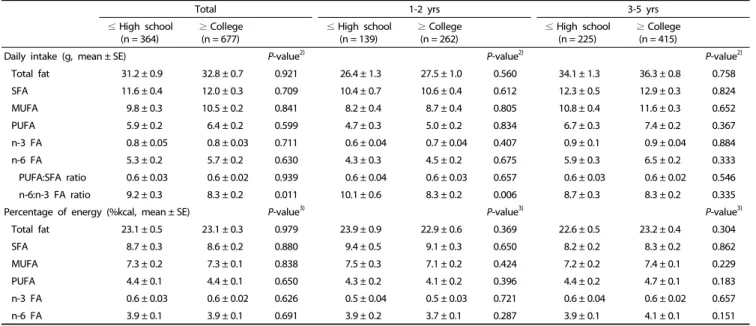
Total fat and fatty acids intake by socioeconomic characteristics
Among children in the 1-2-y group, those living in rural areas
had significantly higher PUFA and n-3 FA intakes and PUFA:
SFA ratio than did children living in urban areas. In comparison,
in the 3-5-y group, there was no difference in total fat and fatty
acids intake observed according to living area (Table 4). Total
fat and fatty acids intakes except the n-6:n-3 FA ratio did not
differ with respect to household income or mother’s education
level (Tables 5 and 6).
First author (publication year)CountrySubjectsStudy periodDietary assessmentTotal fatSFAMUFAPUFAn-3 FAn-6 FA Butte et al. [27]US- 0-47 mo (n=3,273) - By age group: 12-23 mo (n=925), 24-47 mo (n=1,461)
June 2008- January 200924-h dietary recallMean±SE (g)---- 12-23 mo: 42±0.417±0.2 24-47 mo: 45±0.317±0.2 Mean±SE (%kcal) 12-23 mo: 33±0.114±0.1 24-47 mo: 30±0.112±0.1 Goldbohm et al. [15]Netherlands- 10-48 mo (n=1,526) - By age group: 1 yrs (n=411), 2 yrs (n=497), 3 yrs (n=410)
2011-20142 days of dietary recordsMean±SD (g) Total: 42±1114.8±3.8 14.4±4.5 8.6±3.2 1.0±0.4 7.3±2.8 1 yrs: 38±1013.5±3.4 12.9±4.2 8.0±3.1 1.0±0.3 6.8±2.7 2 yrs: 42±1014.8±3.7 14.4±4.5 8.6±3.0 1.0±0.4 7.3±2.6 3 yrs: 45±1116.1±3.815.8±4.49.4±3.41.1±0.48.0±3.0 Mean±SD (%kcal) Total: 29.1±4.6 10.4±1.8 10.0±2.3 6.0±1.80.7±0.2 5.1±1.6 1 yrs: 28.7±4.8 10.3±1.9 9.8±2.4 6.1±1.90.7±0.2 5.1±1.7 2 yrs: 28.9±4.510.3±1.8 9.9±2.3 5.9±1.70.7±0.2 5.0±1.5 3 yrs: 29.3±4.310.4±1.710.2±2.26.0±1.70.7±0.25.1±1.5 Gubbels et al. [14]Netherlands- 1-3 yrs (n=1,016) - By age group: 1 yrs (n=313), 2 yrs (n=330), 3 yrs (n=274)
March 2011- August 20132 days of dietary recordsMean±SD (%kcal)---- Total: 30.0±4.810.7±1.8 1 yrs: 29.8±5.110.7±1.9 2 yrs: 29.9±4.710.6±1.7 3 yrs: 30.0±4.410.6±1.6 Huybrechts et al. [9]Belgium- 2.5-6.5 yrs (n=661) - By sex and age group: male 2.5-3 yrs (n=102), 4-6.5 yrs (n=236), female 2.5-3 yrs (n=95), 4-6.5 yrs (n=228)
October 2002- February 20033 days of dietary recordsMean±SD (g)--- Male 2.5-3 yrs: 50.85±8.09 Male 4-6.5 yrs: 51.95±10.37 Female 2.5-3 yrs: 46.80±11.78 Female 4-6.5 yrs: 47.19±8.01 Mean±SD (%kcal) Male 2.5-3 yrs: 29.22±3.8213.03±2.6710.45±1.314.37±1.37 Male 4-6.5 yrs: 30.09±3.9413.39±1.9910.81±1.394.54±1.16 Female 2.5-3 yrs: 30.30±4.9613.76±2.6310.84±1.954.33±1.11 Female 4-6.5 yrs: 29.68±3.2513.46±1.7210.62±1.504.37±1.00 Huysentruyt et al. [16]Belgium- 6-36 mo (n=465) - By sex and age group: male 13-24 mo (n=97), 25-36 mo (n=86), female 13-24 mo (n=103), 25-36 mo (n=87)
January- February 20124 days of nutritional diaryMean±SD (g)--- Male 13-24 mo: 38.9±12.2 Male 25-36 mo: 43.5±12.0 Female 13-24 mo: 38.5±14.3 Female 25-36 mo: 45.2±15.0 Mean±SD (%kcal) Male 13-24 mo: 30.6±5.2 Male 25-36 mo: 32.5±6.5 Female 13-24 mo: 32.0±9.0 Female 25-36 mo: 32.2±5.4
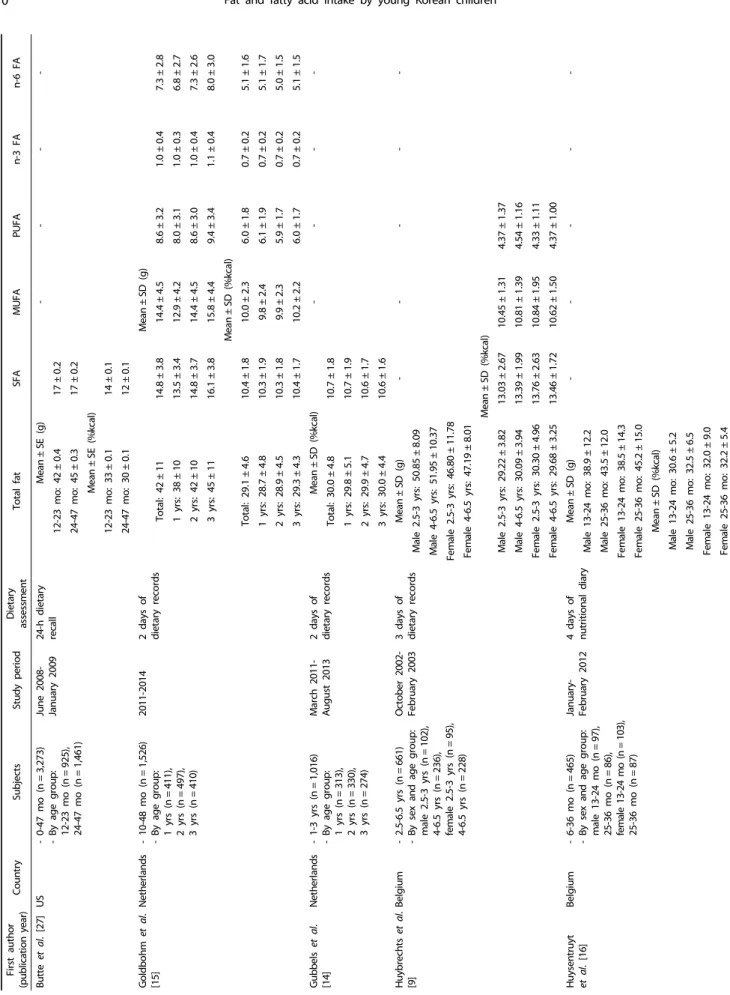
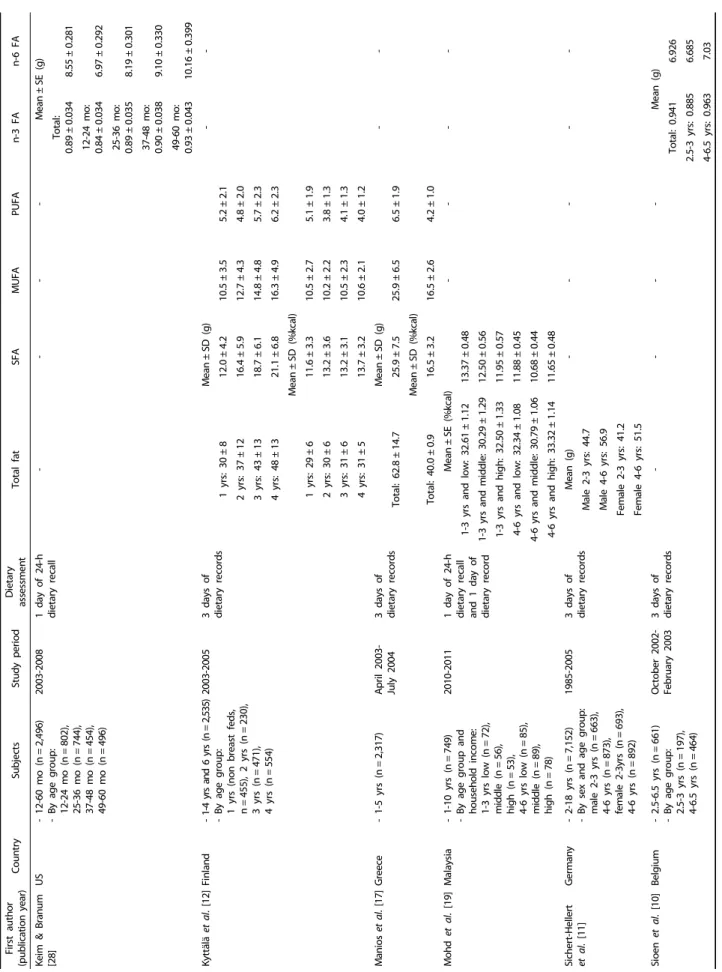
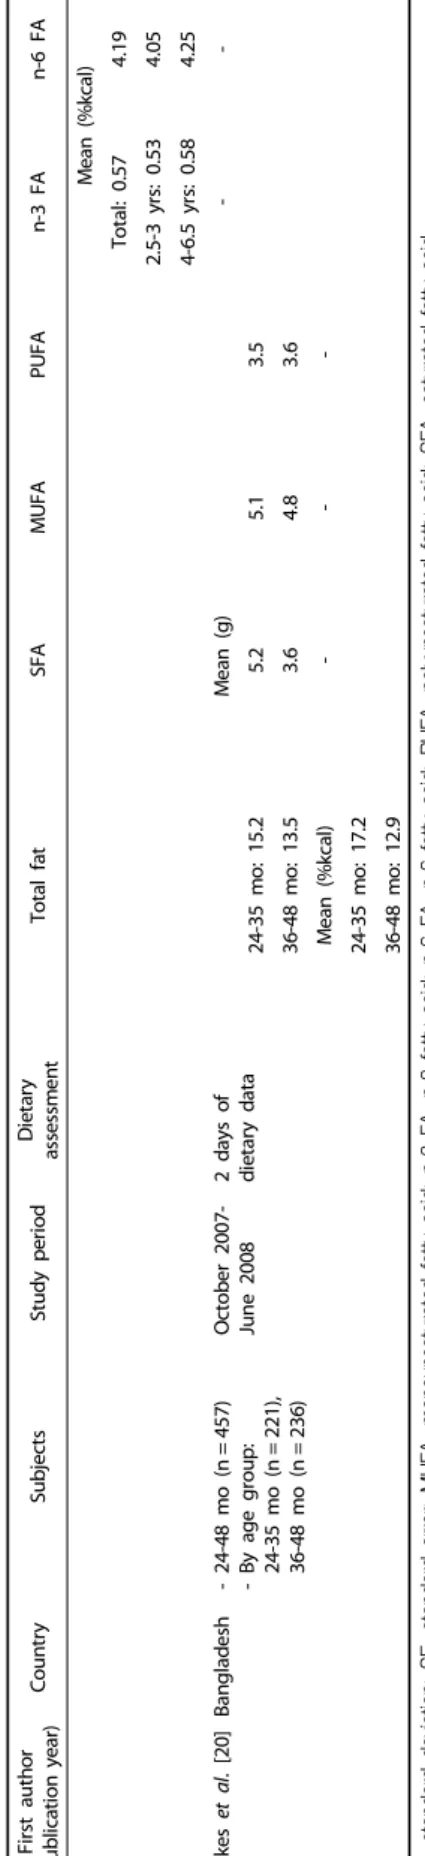
Table 7. Comparison of total fat and fatty acids intakes in young children across countries
YounJoo Baek et al·
331
First author (publication year)CountrySubjectsStudy periodDietary assessmentTotal fatSFAMUFAPUFAn-3 FAn-6 FA Keim & Branum [28]US- 12-60 mo (n=2,496) -By age group: 12-24 mo (n=802), 25-36 mo (n=744), 37-48 mo (n=454), 49-60 mo (n=496)
2003-20081 day of 24-h dietary recall----Mean±SE (g) Total: 0.89±0.0348.55±0.281 12-24 mo: 0.84±0.0346.97±0.292 25-36 mo: 0.89±0.0358.19±0.301 37-48 mo: 0.90±0.0389.10±0.330 49-60 mo: 0.93±0.04310.16±0.399 Kyttälä et al. [12]Finland- 1-4 yrs and 6 yrs (n=2,535) - By age group: 1 yrs (non breast feds, n=455), 2 yrs (n=230), 3 yrs (n=471), 4 yrs (n=554)
2003-20053 days of dietary recordsMean±SD (g)-- 1 yrs: 30±812.0±4.210.5±3.55.2±2.1 2 yrs: 37±1216.4±5.912.7±4.34.8±2.0 3 yrs: 43±1318.7±6.114.8±4.85.7±2.3 4 yrs: 48±1321.1±6.816.3±4.96.2±2.3 Mean±SD (%kcal) 1 yrs: 29±611.6±3.310.5±2.75.1±1.9 2 yrs: 30±613.2±3.610.2±2.23.8±1.3 3 yrs: 31±613.2±3.110.5±2.34.1±1.3 4 yrs: 31±513.7±3.210.6±2.14.0±1.2 Manios et al. [17]Greece- 1-5 yrs (n=2,317)April 2003- July 20043 days of dietary recordsMean±SD (g)-- Total: 62.8±14.725.9±7.525.9±6.56.5±1.9 Mean±SD (%kcal) Total: 40.0±0.916.5±3.216.5±2.6 4.2±1.0 Mohd et al. [19]Malaysia- 1-10 yrs (n=749) - By age group and household income: 1-3 yrs low (n=72), middle (n=56), high (n=53), 4-6 yrs low (n=85), middle (n=89), high (n=78) 2010-20111 day of 24-h dietary recall and 1 day of dietary record
Mean±SE (%kcal)---- 1-3 yrs and low: 32.61±1.1213.37±0.48 1-3 yrs and middle: 30.29±1.2912.50±0.56 1-3 yrs and high: 32.50±1.3311.95±0.57 4-6 yrs and low: 32.34±1.0811.88±0.45 4-6 yrs and middle: 30.79±1.0610.68±0.44 4-6 yrs and high: 33.32±1.1411.65±0.48 Sichert-Hellert et al. [11]Germany- 2-18 yrs (n=7,152) - By sex and age group: male 2-3 yrs (n=663), 4-6 yrs (n=873), female 2-3yrs (n=693), 4-6 yrs (n=892)
1985-20053 days of dietary recordsMean (g)--- Male 2-3 yrs: 44.7 Male 4-6 yrs: 56.9 Female 2-3 yrs: 41.2 Female 4-6 yrs: 51.5 Sioen et al. [10]Belgium- 2.5-6.5 yrs (n=661) - By age group: 2.5-3 yrs (n=197), 4-6.5 yrs (n=464) October 2002- February 20033 days of dietary records----Mean (g) Total: 0.9416.926 2.5-3 yrs: 0.8856.685 4-6.5 yrs: 0.9637.03
Table 7. continued
First author (publication year)CountrySubjectsStudy periodDietary assessmentTotal fatSFAMUFAPUFAn-3 FAn-6 FA Mean (%kcal) Total: 0.574.19 2.5-3 yrs: 0.534.05 4-6.5 yrs: 0.584.25 Yakes et al. [20]Bangladesh- 24-48 mo (n=457) - By age group: 24-35 mo (n=221), 36-48 mo (n=236) October 2007- June 20082 days of dietary dataMean (g)-- 24-35 mo: 15.25.25.13.5 36-48 mo: 13.53.64.83.6 Mean (%kcal)--- 24-35 mo: 17.2 36-48 mo: 12.9
Table 7. continued SD, standard deviation; SE, standard error; MUFA, monounsaturated fatty acid; n-3 FA, n-3 fatty acid; n-6 FA, n-6 fatty acid; PUFA, polyunsaturated fatty acid; SFA, saturated fatty acid.
YounJoo Baek et al.
333
DISCUSSION
The current study evaluated the intake of total fat and fatty acids and their food sources among 1-5-year-old Korean children using nationally representative data. We also estimated fat and fatty acids consumption according to sociodemographic characteristics, such as living area, household income, and maternal education level.
As a fatty acids database for common Korean foods was established in 2014 [24], population-level estimations of fatty acids consumption can now be performed in the Korean population. Consequently, we compared total fat and fatty acids intakes by Korean children to studies in other countries (Table 7). This study showed much lower intakes of total fat, SFA, and MUFA in comparison with findings from the US [8,27] or Europe [9,11,12,14-17]. Average levels of PUFA and n-3 FA consumption were similar to those in Western studies [9,10,12,17,28]. Only a small number of Asian studies have been published on dietary fat and fatty acids intakes in young children. Malaysian children aged 1-6 years showed higher intakes of total fat and SFA [19], whereas Bangladeshi children aged 1-5 years consumed much lower fat and fatty acids amounts compared with children in the current study [20]. The performance of a direct comparison of fat and fatty acids consumption among identified studies was limited due to differences in the age of the study population, study period, dietary assessment tools, and food composition tables of total fat and fatty acids. In future studies, population-specific dietary recommendations on total fat and fatty acid intakes should be determined for young children to evaluate their intakes of total fat and fatty acids.
In this study, the major food sources for total fat, SFA, and MUFA among young children included milk, pork, and eggs.
Children aged 1-2 years in this study also reported cheese and modified milk powder as sources of SFA consumption. In European studies, milk, dairy products, and meat products demonstrated high contributions to total fat, SFA, and MUFA intake among children [15,29,30]. According to the Healthy Lifestyle in Europe by Nutrition in Adolescence study, European adolescents also obtained considerable amounts of total fat, SFA, and MUFA from cake, pies and biscuits, cheese, and chocolate [30].
In Korean children of this study, the major food sources for PUFA were soybean oil, followed by eggs and tofu. In particular, n-3 FA were obtained from several types of oils, such as soybean oil, rapeseed oil, and perilla seed oil, which are frequently used in Korean dishes. Similar to our study, Bangladeshi children aged 24-48 months had soybean oil as their main food source of PUFA intake. Among Indonesian children aged 4-12 years, vegetable dishes and soup were the major contributing foods for alpha-linolenic acid (ALA) intake, followed by legumes, nuts, and seeds [31]. Among young children in US and Belgium, the greatest contributing food group was milk and yogurt for ALA;
fish and sea foods for eicosapentaenoic acid (EPA) and docosahexaenoic acid (DHA); and meat, poultry, and eggs for arachidonic acid (AA) [10,28]. The development and updating of food-based dietary guidelines will be necessary to ensure appropriate intakes of total fat and individual fatty acids in young children.
In this study, children aged 1-2 years showed differences in intake of PUFA and n-3 FA by living area. In addition, disparity in the ratio of n-6 to n-3 FA intake was observed based on mother’s education level. Disparities in children’s diets by socioeconomic status have been reported. Children with low household income status or who live in disadvantaged commu- nities had higher intake of total fat or SFA due to consuming low-quality and energy-dense foods [32,33]. Besides presenting data on fat and fatty acids, the Malaysian study also showed that low-income preschoolers had lower intake of most nutrients and high percentages of children did not meet the recom- mended levels [19]. Generally, low socioeconomic status places limitations on access to grocery stores and diverse and high-priced foods as well as nutrition-related information, often resulting in the consumption of low-quality diets [34]. However, little information on the association between socioeconomic characteristics and dietary intake in young children has been published. The effects of socioeconomic status on young children’s diets should be examined to tailor specific nutrition education and programs targeting vulnerable populations.
The current study has several limitations. The use of a single 24-h dietary recall might not reflect the usual nutrient intake of children and could be subject to under- and over-reporting by parents or caregivers. Our analysis of energy and nutrients also did not include the consumption of breast milk or dietary supplements, which could lead to an underestimation of reported values. Despite these limitations, to the best of our knowledge, this is the first study that has described current national data on dietary fat and fatty acid intake of preschool- aged children in Korea.
In conclusion, our findings provide current information on total fat and fatty acid intake of young children in Korea. The assessment of fat and fatty acid consumption among young children may be helpful in efforts to improve their health status through the development and implementation of national nutrition policies and programs. Future research should focus on establishing specific recommendations for fatty acid intake to examine gaps between the recommended levels and current intakes of young children. In addition, further investigation of the associations of dietary fat intake with health status is necessary.
CONFLICT OF INTEREST
The authors declare no potential conflicts of interests.
ORCID
YounJoo Baek: https://orcid.org/0000-0003-1806-1250 Jae Eun Shim: https://orcid.org/0000-0001-8458-9112 SuJin Song: https://orcid.org/0000-0003-1871-4346
REFERENCES
1. Srinivasan SR, Frontini MG, Xu J, Berenson GS. Utility of childhood non-high-density lipoprotein cholesterol levels in predicting adult dyslipidemia and other cardiovascular risks: the Bogalusa Heart Study. Pediatrics 2006;118:201-6.
2. Wu TC, Chen PH. Health consequences of nutrition in childhood and early infancy. Pediatr Neonatol 2009;50:135-42.
3. Sioen I, van Lieshout L, Eilander A, Fleith M, Lohner S, Szommer A, Petisca C, Eussen S, Forsyth S, Calder PC, Campoy C, Mensink RP. Systematic review on n-3 and n-6 polyunsaturated fatty acid Intake in European countries in light of the current recommen- dations - Focus on specific population groups. Ann Nutr Metab 2017;70:39-50.
4. Abedi E, Sahari MA. Long-chain polyunsaturated fatty acid sources and evaluation of their nutritional and functional properties. Food Sci Nutr 2014;2:443-63.
5. Calder PC. Functional roles of fatty acids and their effects on human health. JPEN J Parenter Enteral Nutr 2015;39:18S-32S.
6. Te Morenga L, Montez JM. Health effects of saturated and trans-fatty acid intake in children and adolescents: Systematic review and meta-analysis. PLoS One 2017;12:e0186672.
7. Niinikoski H, Jula A, Viikari J, Rönnemaa T, Heino P, Lagström H, Jokinen E, Simell O. Blood pressure is lower in children and adolescents with a low-saturated-fat diet since infancy: the special turku coronary risk factor intervention project. Hypertension 2009;53:918-24.
8. US Department of Agriculture, Agricultural Research Service.
Nutrient Intakes from Food and Beverages: Mean Amounts Consumed per Individual, by Gender and Age, What We Eat in America, NHANES 2013-2014. Washington, D.C.: US Department of Agriculture, Agricultural Research Service; 2016.
9. Huybrechts I, De Henauw S. Energy and nutrient intakes by pre-school children in Flanders-Belgium. Br J Nutr 2007;98:600-10.
10. Sioen I, Huybrechts I, Verbeke W, Camp JV, De Henauw S. n-6 and n-3 PUFA intakes of pre-school children in Flanders, Belgium. Br J Nutr 2007;98:819-25.
11. Sichert-Hellert W, Wicher M, Kersting M. Age and time trends in fish consumption pattern of children and adolescents, and consequences for the intake of long-chain n-3 polyunsaturated fatty acids. Eur J Clin Nutr 2009;63:1071-5.
12. Kyttälä P, Erkkola M, Kronberg-Kippilä C, Tapanainen H, Veijola R, Simell O, Knip M, Virtanen SM. Food consumption and nutrient intake in Finnish 1-6-year-old children. Public Health Nutr 2010;13:
947-56.
13. Lehtisalo J, Erkkola M, Tapanainen H, Kronberg-Kippilä C, Veijola R, Knip M, Virtanen SM. Food consumption and nutrient intake in day care and at home in 3-year-old Finnish children. Public Health Nutr 2010;13:957-64.
14. Gubbels JS, Raaijmakers LG, Gerards SM, Kremers SP. Dietary intake by Dutch 1- to 3-year-old children at childcare and at home.
Nutrients 2014;6:304-18.
15. Goldbohm RA, Rubingh CM, Lanting CI, Joosten KF. Food consumption and nutrient intake by children aged 10 to 48 months attending day care in the Netherlands. Nutrients 2016;8:pii: E428.
16. Huysentruyt K, Laire D, Van Avondt T, De Schepper J, Vandenplas Y. Energy and macronutrient intakes and adherence to dietary guidelines of infants and toddlers in Belgium. Eur J Nutr 2016;55:
1595-604.
17. Manios Y, Grammatikaki E, Papoutsou S, Liarigkovinos T, Kondaki K, Moschonis G. Nutrient intakes of toddlers and preschoolers in Greece: the GENESIS study. J Am Diet Assoc 2008;108:357-61.
18. Ministry of Health. Labour and Welfare. The National Health and Nutrition Survey in Japan, 2015 [Internet]. Tokyo: Ministry of Health,
Labour and Welfare; 2015. Available from: http://www.mhlw.go.jp/
seisakunitsuite/bunya/kenkou_iryou/kenkou/kenkounippon21/en/e iyouchousa/keinen_henka_eiyou.html.
19. Mohd Shariff Z, Lin KG, Sariman S, Lee HS, Siew CY, Mohd Yusof BN, Mun CY, Mohamad M. The relationship between household income and dietary intakes of 1-10 year old urban Malaysian. Nutr Res Pract 2015;9:278-87.
20. Yakes EA, Arsenault JE, Islam MM, Ahmed T, German JB, Drake C, Hossain MB, Lewis BL, Rahman AS, Jamil KM, Brown KH. Dietary intake of polyunsaturated fatty acids among breast-feeding and non-breast-feeding 24- to 48-month-old children in Bangladesh. J Pediatr Gastroenterol Nutr 2011;52:351-9.
21. Rogers I, Emmett P; ALSPAC Study Team. The effect of maternal smoking status, educational level and age on food and nutrient intakes in preschool children: results from the Avon Longitudinal Study of Parents and Children. Eur J Clin Nutr 2003;57:854-64.
22. Kirkpatrick SI, Dodd KW, Reedy J, Krebs-Smith SM. Income and race/ethnicity are associated with adherence to food-based dietary guidance among US adults and children. J Acad Nutr Diet 2012;112:624-635.e6.
23. van Ansem WJ, Schrijvers CT, Rodenburg G, van de Mheen D.
Maternal educational level and children's healthy eating behaviour:
role of the home food environment (cross-sectional results from the INPACT study). Int J Behav Nutr Phys Act 2014;11:113.
24. Yoon MO, Kim K, Hwang JY, Lee HS, Son TY, Moon HK, Shim JE.
Development of a fatty acids database using the Korea National Health and Nutrition Examination Survey data. J Nutr Health 2014;47:435-42.
25. Kweon S, Kim Y, Jang MJ, Kim Y, Kim K, Choi S, Chun C, Khang YH, Oh K. Data resource profile: the Korea National Health and Nutrition Examination Survey (KNHANES). Int J Epidemiol 2014;43:
69-77.
26. Rural Development Administration, National Institute of Agricultural Sciences. Food Composition Table. Wanju: Rural Development Administration, National Institute of Agricultural Sciences; 2011.
27. Butte NF, Fox MK, Briefel RR, Siega-Riz AM, Dwyer JT, Deming DM, Reidy KC. Nutrient intakes of US infants, toddlers, and preschoolers meet or exceed dietary reference intakes. J Am Diet Assoc 2010;110:S27-37.
28. Keim SA, Branum AM. Dietary intake of polyunsaturated fatty acids and fish among US children 12-60 months of age. Matern Child Nutr 2015;11:987-98.
29. Joyce T, Wallace AJ, McCarthy SN, Gibney MJ. Intakes of total fat, saturated, monounsaturated and polyunsaturated fatty acids in Irish children, teenagers and adults. Public Health Nutr 2009;12:156-65.
30. Vyncke KE, Libuda L, De Vriendt T, Moreno LA, Van Winckel M, Manios Y, Gottrand F, Molnar D, Vanaelst B, Sjöström M, González-Gross M, Censi L, Widhalm K, Michels N, Gilbert CC, Xatzis C, Cuenca García M, de Heredia FP, De Henauw S, Huybrechts I;
HELENA consortium. Dietary fatty acid intake, its food sources and determinants in European adolescents: the HELENA (Healthy Lifestyle in Europe by Nutrition in Adolescence) Study. Br J Nutr 2012;108:2261-73.
31. Neufingerl N, Djuwita R, Otten-Hofman A, Nurdiani R, Garczarek U, Sulaeman A, Zock PL, Eilander A. Intake of essential fatty acids in Indonesian children: secondary analysis of data from a nationally representative survey. Br J Nutr 2016;115:687-93.
32. Keita AD, Casazza K, Thomas O, Fernandez JR. Neighborhood-level
YounJoo Baek et al.
335
disadvantage is associated with reduced dietary quality in children.
J Am Diet Assoc 2009;109:1612-6.
33. Kong A, Odoms-Young AM, Schiffer LA, Berbaum ML, Porter SJ, Blumstein L, Fitzgibbon ML. Racial/ethnic differences in dietary
intake among WIC families prior to food package revisions. J Nutr Educ Behav 2013;45:39-46.
34. Darmon N, Drewnowski A. Does social class predict diet quality?
Am J Clin Nutr 2008;87:1107-17.