15
Computational Solution Method Results from the Simulation
Conclusion
Chemical Engineering Department Student Reg. No. 200863019
Naim Hasolli
Oxygen Diffusion in Animal Cells – Slab Model
Oxygen Diffusion in Animal Cells – Slab
Model
15 2
Problem Statement: Slab Model Problem Statement: Slab Model
Oxygen Diffusion in Animal Cells
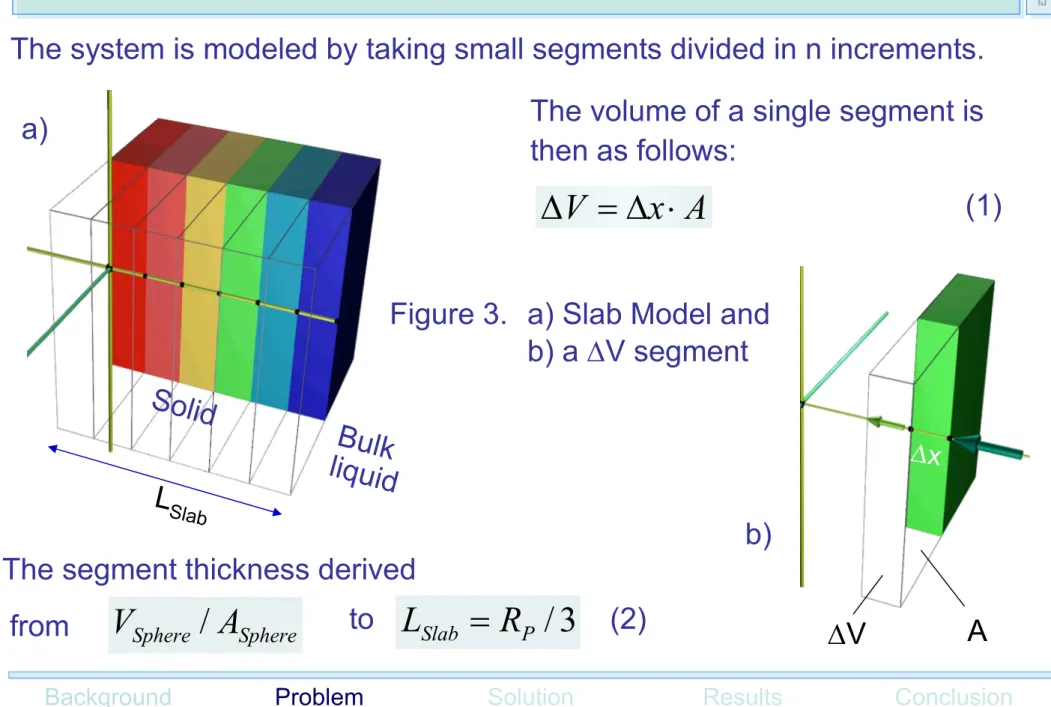
The system is modeled by taking small segments divided in n increments.
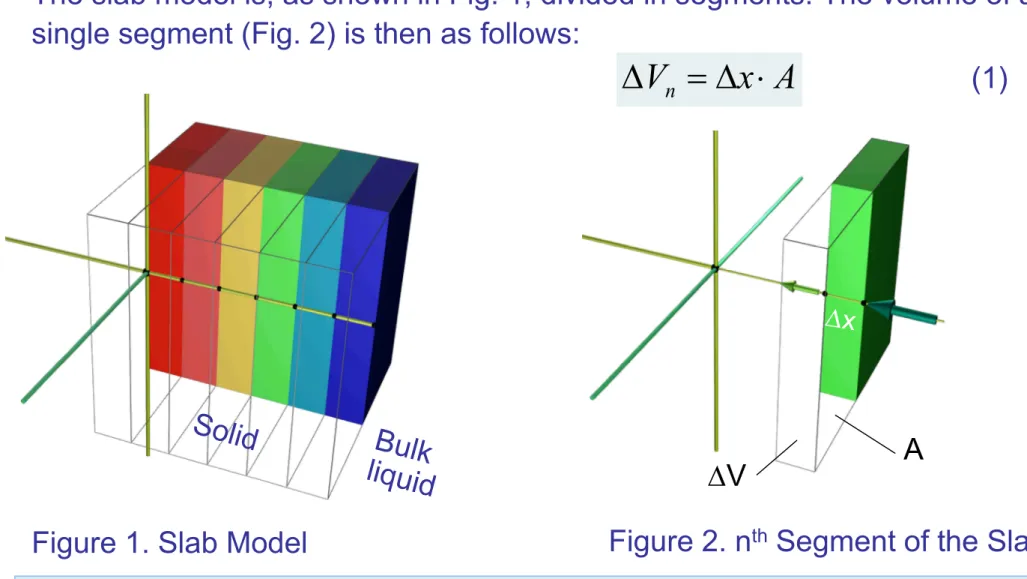
The slab model is, as shown in Fig. 1, divided in segments. The volume of a single segment (Fig. 2) is then as follows:
Solid Bulk
liquid
Dx
DV A
A x V
n= D ×
D
(1)Figure 1. Slab Model Figure 2. nth Segment of the Slab
Problem Statement: Slab Model
15Problem Statement: Slab Model
The system is modeled by taking small segments divided in n increments.
The volume of a single segment is then as follows:
Solid
Bulk
liquid Dx
DV A
A x V = D ×
D
(1)LSlab
Sphere Sphere
A
V /
The segment thickness derived
3
P
/
Slab
R
L =
Figure 3. a) Slab Model and b) a DV segment a)
b)
from to (2)
15 4
Dx
DV
A
Mass Balance: Mathematical Model Mass Balance: Mathematical Model
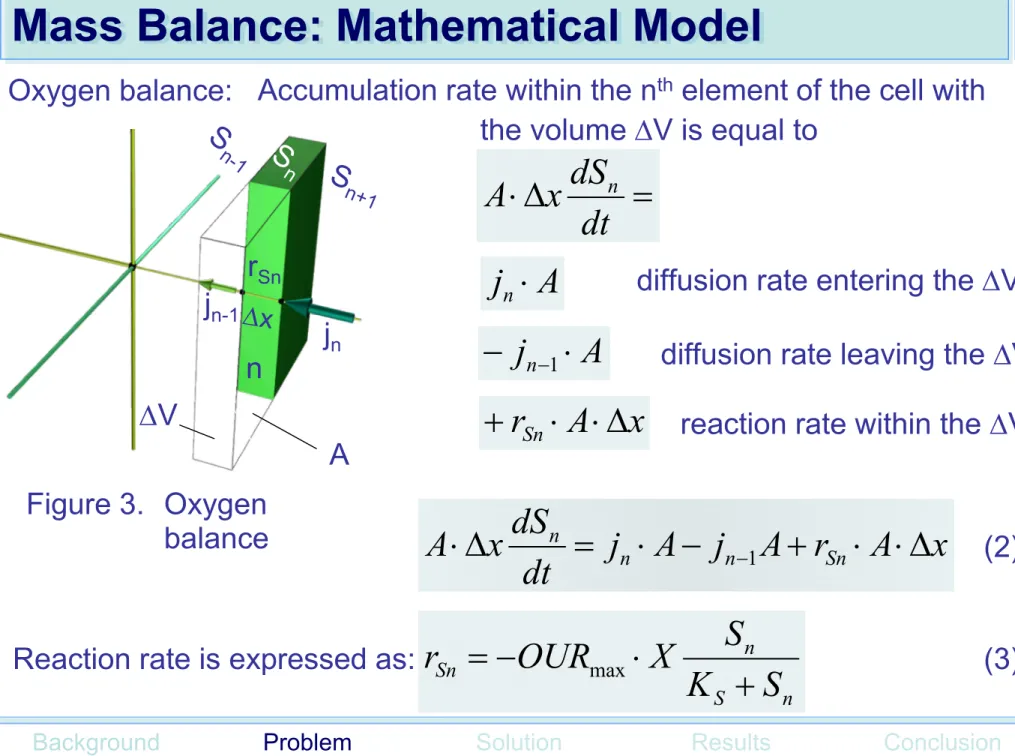
Oxygen balance: Accumulation rate within the nth element of the cell with the volume DV is equal to
= D
× dt x dS
A
nn jn-1
jn Sn+1
Sn
Sn-1
rSn
j
n× A
diffusion rate entering the DV diffusion rate leaving the DVA j
n× -
-1reaction rate within the DV
x A
r
Sn× × D +
x
(2)A r
A j
A dt j
x dS
A × D
n=
n× -
n-1+
Sn× × D
n S
n
Sn
K S
X S OUR
r = -
max× +
Reaction rate is expressed as: (3)
Oxygen Diffusion in Animal Cells: Exercise
Figure 3. Oxygen balance
Solving ODEs in MATLAB: Initial Values
15Solving ODEs in MATLAB: Initial Values
Symbol Description Value Unit
Deltax (Dx) Increment length, LSlab/6 LSlab/6 m
DS Diffusion coefficient 7.0E-6 m2/h
KS Saturation constant 1 kg/m3
OURmax Oxygen uptake rate 0.01 g/(kg h)
LSlab Length of the slab 3.3E-5 m
S0 Substrate concentration in Bulk Liquid 10 g/m3 Sn Initial Substrate concentration of S1-6 1 g/m3
X Biomass concentration 1 kg/m3
15 6
Solving ODEs in MATLAB: Function File Solving ODEs in MATLAB: Function File
Oxygen Diffusion in Animal Cells: Exercise
The Oxygen balance ODEs are slightly modified to fit the condition for the slab model according to Fig. 2.
Code 4. Matlab Function File for Slab Model.
Command Window File
15Command Window File
Code 5. Matlab Command Window File for Slab Model.
15 8
Sphere vs. Slab: Substrate Concentration Sphere vs. Slab: Substrate Concentration
Oxygen Diffusion in Animal Cells: Exercise
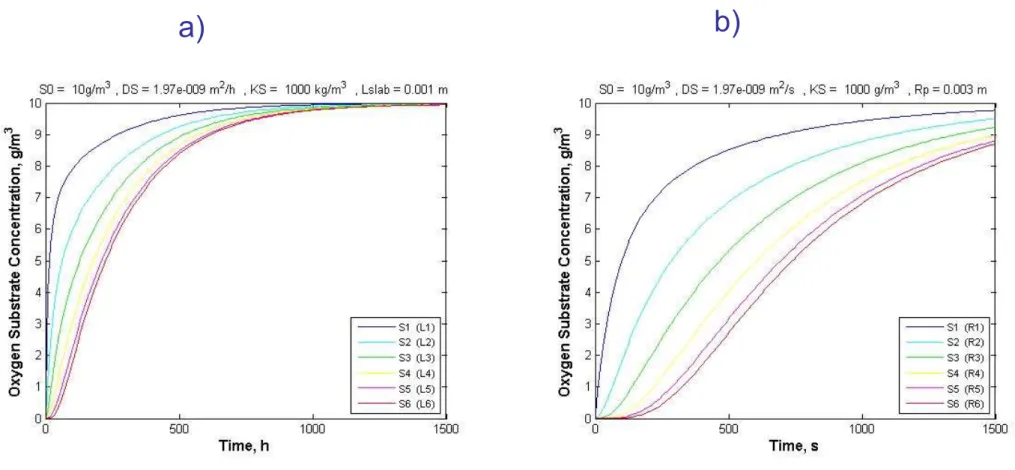
Figure 4. Concentration vs. Time for a) Slab and b) Spherical Model a) b)
Sphere vs. Slab: Substrate Concentration
15Sphere vs. Slab: Substrate Concentration
a) b)
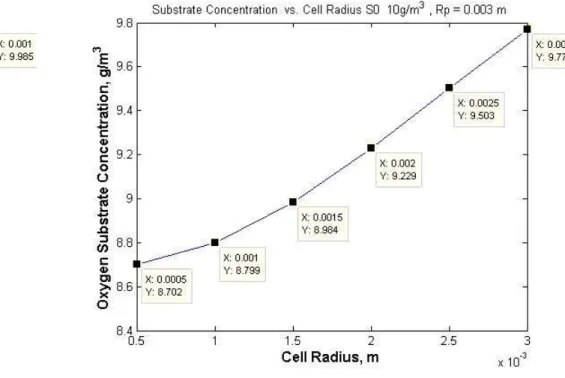
Figure 5. Concentration vs. Radius/Length for a) Slab and b) Spherical Model
15 10
Conclusion Conclusion
Oxygen Diffusion in Animal Cells
For given conditions the oxygen concentration within the aggregate of the
animal cell the most noticeable effect of the parameters is shown for variation of diffusion coefficient DS and radius RP in case the conditions are
considered unchanged concerning the saturation constant KS and the bulk liquid concentration S0.
The bulk liquid concentration S0 shows the effect on the level outer substrate concentration but no significant effect on the diffusion behavior inside the cell.
The change of the DS by one order of magnitude effects the penetration distance for given reaction end time. For order (-9), oxygen reaches the center of the cell soon after reaction is started.
For saturation constant KS values the effect is hardly noticeable .
The smaller the radius RP of cell the faster the reaction is proceeded and the oxygen reaches the center of the cell for given reaction end time.
15
[1] I. J. Dunn, E. Heinzle, J. Ingham, J. E. Pfenosil, Biological Reaction Engineering Dynamic Modeling Fundamentals with Simulation Examples, 2nd Edition
2003, WILEY-VCH Verlag, Weinheim, pp. 388-392.
[2] http://www.css.cornell.edu/compost/oxygen/oxygen.diff.water.html
Reference Reference
[3] http://micro.magnet.fsu.edu/cells/animalcell.html