Fault Detection of Governor Systems Using Discrete Wavelet Transform Analysis
Sungshin Kim1․Hyeon Bae2․Jae-Hyun Lee†
(Received June 26, 2012; Revised July 4, 2012; Accepted July 10, 2012)
Abstract: This study introduces a condition diagnosis technique for a turbine governor system. The governor system is an important control system to handle turbine speed in a nuclear power plant. The turbine governor system includes turbine valves and stop valves which have their own functions in the system. Because a turbine governor system is operated by high oil pressure, it is very difficult to maintain under stable operating conditions. Turbine valves supply oil pressure to the governor system for proper operation. Using the pressure variation of turbine and governor valves, operating conditions of the turbine governor control system are detected and identified. To achieve automatic detection of valve status, time-based and frequency-based analysis is employed. In this study, a new approach, wavelet decomposition, was used to extract specific features from the pressure signals of the governor and stop valves. The extracted features, which represent the operating conditions of the turbine governor system, include important information to control and diagnose the valves. After extracting the specific features, decision rules were used to classify the valve conditions. The rules were generated by a decision tree algorithm (a typical simple method for data-based rule generation). The results given by the wavelet-based analysis were compared to detection results using time- and frequency-based approaches. Compared with the several related studies, the wavelet transform-based analysis, the proposed in this study has the advantage of easier application without auxiliary features.
Key w ords: Fault detection, Governor system, Wavelet transform, Decision tree
†Corresponding Author(Korea Maritime University, E-mail: [email protected], Tel: 051-410-4254)
1 School of Electrical Engineering, Pusan National University, E-mail: [email protected], Tel: 051-510-2374 2 Busan Development Institute, E-mail: [email protected], Tel: 051-860-8743
1. Introduction
Nuclear power generation was introduced in the mid-1950s and has been continuously expanded.
Recently, 440 nuclear power plants produce 16% of the total electric power production in the world [1].
However, nuclear power generation is a large-scale and complex system which must be stably operated.
Particularly, when important functional devices fail, a fault can be derivatively enlarged to a serious accident; that is, a radiation accident. Therefore, condition diagnosis and management should be precisely achieved for stable operation of the plant.
In this study, the turbine valve system, one of the core systems in a nuclear power plant is the target system. It is difficult to gather data from the operating system of a turbine valve because it is a mechanically controlled analog device and it is difficult to predict the performance of the valve because it has strong non-linearity. Oil leaking can occur at several parts in the system, so condition diagnosis and maintenance is complicated. For example, from 2001 to the end of 2005, in the K nuclear power plant, the turbine operating systems failed 30 times and it was difficult to analyze and
to find some of the fault causes [2-4].
According to our survey, the NPPC (national pollution prevention center) was developed at the Georgia Institute of Technology. The developed system is a type of expert systems that supports the operator of a nuclear power plant to find the cause of abnormal failure by applying a system operating model and relative rules [5]. EG&G Idaho Company designed a rule-based expert system that inspects measuring instruments and diagnoses the nuclear reactors in order to check reaction conditions [6]. Diagnosis systems for a nuclear power plant have recently been developed using neural networks and fuzzy logic. However, researches related to governor valves are not yet adequate.
In this study, a decision support system was developed to diagnose the governor operating system based on inspecting the pressure variation of the turbine valves. However, it is not easy to diagnose and analyze the operating systems automatically in the field, so time-series data mining based on a wavelet transform was applied to extract features for condition diagnosis. In this study, four-scale wavelet decomposition was performed to find the proper features from the pressure signals. After feature extraction, a decision tree algorithm was used to develop identification rules. Valve conditions were correctly classified by decision rules. Previous diagnosis results via fuzzy logic and Fourier transforms that were achieved in our prior research were also useful to diagnose valve status [7].
In this manuscript, Section 2 gives a description of the turbine operating systems of nuclear power plant, Section 3 summarizes several related studies, and Section 4 explains the diagnosis information and pressure signals of the valves. Section 5 introduces our proposal for condition diagnosis using wavelet transforms. Conclusions are given in
Section 6.
2. Turbine Governor System
2.1 Operating Systems in the Physical Plant
The governor system has an important role in controlling the revolution speed of the turbine blade. However, it is necessary to inspect the system on an ongoing basis and to maintain it in good operating condition, because the system uses oil pressure to operate. Oil pressure-based systems are often faced with the problem of oil leakage, but until now, most of the systems have been maintained by hand. This operating situation causes difficulty of automatic system maintenance. Figure 1 shows a monitoring window of the power governing valve in the nuclear power plant. In the window, the dotted lines indicate the high pressure stop valve and the governor valve. The both turbine valves (stop valve and governor valve) include oil supplying and operating devices for valve operating.
The turbine valves are opened by a hydraulic servo-cylinder and are closed by a compressed spring [8-9].
2.1.2. Characteristics of the Turbine Governor At starting up, a governor valve of the turbine system controls the velocity of a moving fluid to the reference speed. After the transient state, the governor valve controls the speed to 1800 rpm using 16 valves of 4 groups, as shown in Fig. 1.
The high pressure turbine valve, which handles about 80% of the fluid, must be able to obtain a response from the control command and limit the variation of the valve opening to less than 0.5%.
Oil pressure can be changed according to the conditions of the governor and stop valves. Pressure is cyclically controlled and an internal leak continuously occurs in the driving system because of the mechanical characteristics of the system.
This pressure variation affects control performance
Governor and stop valve
Figure 1: The hydraulic lines of turbine valve driver.
of the valves and can cause a system malfunction.
Figure 2 shows the pressure signal of the valve.
The slope of the unloading time is strongly related to the condition of the valve, so unloading times are used for valve condition diagnosis in this study.
The loading time is the time interval between the pressing point and the set point (pressurization).
0 100 200 300 400 500 600 700 800 900 1000
95 100 105 110
115 HP-GV1 Press wave
Press (Kg/cm2)
Time(0.5s)
Loading time Unloading time
Figure 2: A normal pressure variation of the operating cycling of a governor valve.
The unloading time is the time interval between the peak point and the valley point (compression).
The time interval contains important information for valve control. Field operators check the value, and
evaluate the valve status for maintenance requirements.
3. Related Works
Many subsequent papers extended this approach to handle scaling and gaps [10], subsequence matching using minimum bounding rectangles [11-12], formalizing query constraints and incorporating them into the indexing procedure [13-14], using the last k DFT coefficients with the conjugate property of the DFT [15], and using Haar DWT instead of DFT [16]. The competition between DFT and Haar DWT was resolved in [17], concluding that they are comparable in energy preservation, but that DWT is faster to calculate and offers multi-resolution decomposition. In addition, there are approaches to combine DWT with time warping [18].
Popivanov et al. [19] pursued the suggestion by Chan [16] that wavelet bases other than Haar, might be better for certain data sets. They showed that the contraction property needed for indexing holds for all (bi-)orthogonal wavelet transforms, making a large family of transforms available for
the feature extraction. In particular the Daubechies wavelet family [20] was shown to have better energy preservation on several real life and synthetic data-sets.
One possibility to search for groups in a set of time series is clustering. The approximate distance functions from the indexing literature and other sophisticated distance functions have been combined with clustering algorithms- for example, k-Means clustering [21-22] (with ARIMA based distance), and [23] (with DWT); hierarchical clustering [24]
(with Euclidean distance) and [25] (with dynamic time warping distance); or SOM clustering [26]
(with perceptually important point distance).
4. Diagnosis Information from Pressure Signals of the Valves
4.1 Operating Conditions of the Valves
The hydraulic pressure of the governor valves should be from 100 to 110 ㎏/㎠ to handle the driving system, and it must be higher than 80 kg/
㎠ under any circumstance. If pressure variation increases, internal leaking of the cylinder and valve swing can occur. If the pressure is lower than 80
㎏/㎠, the spring tension of the inner cylinder can be overcome, and the valve can be closed regardless of the control commend. Thus, it is best to shorten loading time and to lengthen unloading time for the optimal operating condition.
Under the normal operating condition of 55~60%
of valve opening and 100~115 ㎏/㎠ of pressure, if the dump solenoid coil is cut off, oil pressure will rapidly decrease due to loss of the power supply, and the valve will quickly closed. The major faults causing this phenomenon are coil defect, stop interlocking driving, and inner faults of the solenoid driver. Close interlocking is promptly closed after 4 s when 20% of the deviation compared with the reference value occurs. This fault can occur based on motor stop. Tables 1 and 2 show the standard
values of the time and pressure. The valves can be completely operated under the normal pressure and loading time within the standard ranges. This phenomenon can be represented by the slope of the pressure signals; therefore, the fault or abnormal conditions of the valves can be detected and diagnosed by the slope patterns. The relation between slope and operating condition is applied as a diagnosis feature in valve management. For example, when transforming time-based signals using Fourier or wavelet transforms, inflection and specific points of the pressure signals can be converted to frequency-based signals. These values are used as specific features for checking valve conditions.
In practical terms, field operators usually diagnose a leak condition and other defects using the slope of the loading time. In this study, we developed an automatic diagnosis algorithm that extracts features from data based on field information.
Table 1: Standard values for the operation pressure of the stop and governor valve.
Variable Valve type Normal value (㎏/㎠) Bottom pressure Stop valve 123~127
Governor valve 96~102 Upper pressure Stop valve 134~140
Governor valve 107~113
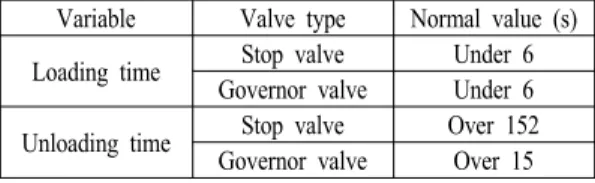
Table 2: Standard values for the operation loading time of the stop and governor valve.
Variable Valve type Normal value (s) Loading time Stop valve Under 6
Governor valve Under 6 Unloading time Stop valve Over 152
Governor valve Over 15
4.2 Signals for Valve Diagnosis
The goal of the diagnosis system proposed in this study is to classify the valve conditions using
four levels: best, adequate, marginal, and worst.
Conditions of the valves are assessed using valve pressure based on the operating information discussed previously. Pressure magnitudes and patterns of each valve indicate the status of the valves. Pressure signals are generally used in the actual fields. Field operators can empirically make a decision regarding the valve condition using the pressure signals.
Figure 3 shows the pressure signals of the stop and the governor valves based on valve condition.
One point signal is measured by 0.5 s, and the whole signal is measured for about two h, so 14,000 points are gathered for one set. 2500 data points among the whole signals are resampled by a
(a) Pressure variation of the stop valves
(b) Pressure variation of the governor valves Figure 3: Pressure values of the HP turbine valves.
sampling window, and are applied for diagnosis.
The stop valve has a small leakage in the following order: SV3 (best), SV4, SV2, and SV1 (worst). In addition, the governor valve has a small leakage in the following order: GV1 (best), GV4, GV2, and GV3 (worst). As shown in Fig. 3, the pressure value of each valve is significantly different with respect to valve performance. SV and GV are abbreviation of the stop valve and the governor valve, respectively. If the maximum pressure value increases, the performance of the valve improves. That is, the amplitude of the pressure signal has an opposite relation to the amount of leakage by the valves. Inclining and declining slopes of the signal have specific features representing valve performance (namely, the degree of slope is related to the amount leakage in the valves), and therefore the pressure signals can be used as a powerful diagnosis tool.
5. Condition Diagnosis Using the Wavelet Transform Method
It is difficult to diagnose the status of the governor valves using only Fourier transform analysis, so three features from the Fourier transform and one feature from the original signal (amplitude) were used to compensate for the weak point of the Fourier transform. In this case, two types of features were applied, which can be complicated. Also, signal errors can occur when the maximum variation is calculated from maximum and minimum points, because of noise in the signals. To solve this problem, an alternative algorithm is proposed based on wavelet transform analysis.
The wavelet transform can convert the original signal to a multi scale signal and energy values calculated from detail coefficients of each scale can be the specific features. In particular, multiresolution analysis of the wavelet transform
can provide an index (summation index: S-Index) that is calculated by summation of the energy values of the detail coefficients. The S-index can be used for diagnosis of the valves without a long test time. The performance of newly - installed valves can be compared to a ranking list, and they can be ranked based on a condition list.
5.1 Signal Preprocessing Using Z-Score Standardization Control commands can cyclically compress and decompress the high pressure valves within a certain interval, but variation of the pressure between maximum and minimum values differs according to valve’s conditions. On the other words, the peak (maximum charging point) and valley (minimum leaking point) values are determined by the valve’s status. However, the different amplitudes of the pressure signals from each valve can cause inaccurate results in feature extraction from the detail coefficients. In this study, the peak and slant patterns are employed in information extraction.
To remove the influence of pressure amplitude, the signals were standardized, and power values were calculated by normal distribution with zero mean and one standard deviation. Standardization was performed on the pressure signals before conducting the wavelet transform using Z-score standardization [27]. Z-score standardization, which is widely used in statistical analysis, is described by
( ) ( )
* X mean X X SD X
= −
(1) where X are the measured values, and SD is the standard deviation of X.
5.2 Feature Extraction for Status Detection Using Wavelet Transform
Wavelet decomposition was used for feature extraction from pressure signals of the valves as
shown in Figure 4 and 6. The pressure signals were transformed to four scaled signals, and the power values were calculated using the detail coefficients of the four scales. Figures 5 and 7 show the power values calculated using the power spectrum equation. The detail coefficients are a part of the high frequency of the signals, and the power values of the high frequency signals include the specific features. In particular, the valve pressure applied in this study was charged and leaked periodically, so the upper and lower vertices have the high frequency components. The energy values of the detail coefficients of each level can quantify information regarding the charging and leaking number repeated during the period that represents the valve characteristics. Also, the patterns of the inclining and declining slopes of the pressure signals can be included in the detail coefficients;
thus, the valve’s performance can be diagnosed by the power values.
In this application, the Coiflet function was used for the mother wavelet function. The Haar, Coif1, and Coif4 function [28] were applied and evaluated to compare performance, and the Coiflet function was selected after conducting several repeated trials.
Stop Valve Result
0 200 400 600 800 1000
-1 0 1
Valve 1
Detail Coeff.
0 200 400 600 800 1000
-0.5 0 0.5
Valve 2
0 200 400 600 800 1000
-0.5 0 0.5
Valve 3
0 200 400 600 800 1000
-0.5 0 0.5
(a) Detail coefficient of level1 of SV
Stop Valve Result
0 100 200 300 400 500
-2 0 2
Valve 1
0 100 200 300 400 500
-1 0 1
Valve 2
0 100 200 300 400 500
-1 0 1
Valve 3
0 100 200 300 400 500
-1 0 1
(b) Detail coefficient of level2 of SV
Stop Valve Result
0 50 100 150 200 250
-5 0 5
Valve 1
0 50 100 150 200 250
-2 0 2
Valve 2
0 50 100 150 200 250
-2 0 2
Valve 3
0 50 100 150 200 250
-2 0 2
(c) Detail coefficient of level3 of SV
Stop Valve Result
0 20 40 60 80 100 120
-5 0 5
Valve 1
0 20 40 60 80 100 120
-5 0 5
Valve 2
0 20 40 60 80 100 120
-5 0 5
Valve 3
0 20 40 60 80 100 120
-5 0 5
(d) Detail coefficient of level4 of SV Figure 4: 4-scales multiresolution for stop valves.
Two thousand sampling data points were extracted by the window, and the re-sampled signals were transformed for diagnosis. Energy values were calculated by the general spectrum equation. Finally, as shown in Figure 4 and Figure 6, we determined that the Coif1 function had the best performance in correctly classifying the valve condition. Also, considering Figures, the energy values of level 3 and level 4, and the sum of the energy values can be selected as the features in the next condition classification.
Power of Detail Coefficient Using Haar Wavelet
0 1 2 3 4
Level 1 Level 2 Level 3 Level 4 SUM Level
Power
SV 1 SV 2 SV 3 SV 4
(a) Results of Haar wavelet function
Power of Detail Coefficient Using Coif1 Wavelet
0 1 2 3
Level 1 Level 2 Level 3 Level 4 SUM Level
Power
SV 1 SV 2 SV 3 SV 4
(b) Results of Coif1 wavelet function Figure 5: 4-scales multiresolution for stop valves.
Governor Valve Result
0 200 400 600 800 1000
-0.2 0 0.2
Valve 1
0 200 400 600 800 1000
-0.5 0 0.5
Valve 2
0 200 400 600 800 1000
-0.2 0 0.2
Valve 3
0 200 400 600 800 1000
-0.5 0 0.5
(a) Detail coefficient of level1 of GV
Governor Valve Result
0 100 200 300 400 500
-1 0 1
Valve 1
Detail Coeff.
0 100 200 300 400 500
-1 0 1
Valve 2
Detail Coeff.
0 100 200 300 400 500
-0.5 0 0.5
Valve 3
0 100 200 300 400 500
-1 0 1
Detail Coeff.
(b) Detail coefficient of level2 of GV
Governor Valve Result
0 50 100 150 200 250
-2 0 2
Valve 1
0 50 100 150 200 250
-2 0 2
Valve 2
0 50 100 150 200 250
-1 0 1
Valve 3
0 50 100 150 200 250
-2 0 2
(c) Detail coefficient of level3 of GV
Governor Valve Result
0 20 40 60 80 100 120
-5 0 5
Valve 1
0 20 40 60 80 100 120
-5 0 5
Valve 2
0 20 40 60 80 100 120
-5 0 5
Valve 3
0 20 40 60 80 100 120
-5 0 5
(d) Detail coefficient of level4 of GV Figure 6: 4-scales multiresolution for stop valves.
Power of Detail Coefficient Using Haar Wavelet
0 0.1 0.2 0.3 0.4 0.5 0.6
Level 1 Level 2 Level 3 Level 4 SUM Level
Power
GV 1 GV 2 GV 3 GV 4
(a) Results of Haar wavelet function
Power of Detail Coefficient Using Coif1 Wavelet
0 0.1 0.2 0.3 0.4
Level 1 Level 2 Level 3 Level 4 SUM Level
Power
GV 1 GV 2 GV 3 GV 4
(b) Results of Coif1 wavelet function Figure 7: 4-scales multiresolution for stop valves.
5.2.1 Results of Features Extraction
Condition diagnosis of both valves was accomplished using the seven sampling sets that were measured from the field after repairing the stop valves. The data sets used in wavelet analysis for this study are different than the data sets used in the previous research [7]. Tables 3 and 4 show the power values of the detail coefficients that were transformed by wavelet decomposition. As shown in the tables, the power values of level 3 and level 4 have the significant patterns corresponding to the valve conditions; therefore, both values can be used for effective fault identification and also summation values of the power values called S-Index can represent the feature of the performance. On the other words, the energy values of the detail coefficients of each scale level can show significant features of each valve. In this study, diagnosis rules were extracted using the energy values of the 3rd and 4th scale levels and the S-Index values; that is, two sets of rule-based diagnosis systems were designed and compared according to classification performance. As shown in the results, the energy values of the details decomposed by wavelet transform indicate the status of the valves, and whether the valves are good or not. As mentioned previously, the applied signals used in this diagnosis are different because this diagnosis was performed using valve pressures after repair of the valves during one month. However, the diagnosis
results of the governor valves through FFT or wavelet analysis are the same even though different pressure signals are applied, because the governor valves were not fixed during the overall period. In the FFT analysis (before repairing), the status of the stop valves is in the following order: SV3, SV4, SV2, and SV1. However, in the wavelet
Table 3: Results of feature extraction from stop valves using wavelet decomposition.
(a) Power of the detail coefficients of stop valve1 Details Stop Valve1: Seven Test Samples
1 2 3 4 5 6 7 Avg
Level1 0 0 0 0 0 0 0 0
Level2 0.0002 0.0002 0.0002 0.0002 0.0002 0.0002 0.0002 0.0002 Level3 0.0041 0.0041 0.0041 0.0041 0.0041 0.0042 0.0043 0.0041 Level4 0.0573 0.0567 0.0576 0.0589 0.0572 0.0564 0.0574 0.0574 SUM 0.0616 0.061 0.0619 0.0632 0.0615 0.0608 0.0619 0.0617
(b) Power of the detail coefficients of stop valve2 Details Stop Valve2: Seven Test Samples
1 2 3 4 5 6 7 Avg
Level1 0 0 0 0 0 0 0 0
Level2 0 0 0 0 0 0 0 0
Level3 0.0013 0.0014 0.0014 0.0014 0.0014 0.0014 0.0014 0.0014 Level4 0.0269 0.027 0.0263 0.0259 0.0263 0.0269 0.0267 0.0266 SUM 0.0282 0.0284 0.0277 0.0273 0.0277 0.0283 0.0281 0.0280
Details Stop Valve3: Seven Test Samples
1 2 3 4 5 6 7 Avg
Level1 0 0 0 0 0 0 0 0
Level2 0 0 0 0 0 0 0 0
Level3 0.001 0.0011 0.0011 0.0011 0.0011 0.0011 0.0011 0.0011 Level4 0.0191 0.0193 0.0181 0.018 0.0191 0.0187 0.0185 0.0187 SUM 0.0201 0.0204 0.0192 0.0191 0.0202 0.0198 0.0196 0.0198 (c) Power of the detail coefficients of stop valve3
Details Stop Valve4: Seven Test Samples
1 2 3 4 5 6 7 Avg
Level1 0 0 0 0 0 0 0 0
Level2 0.0001 0.0001 0.0001 0.0001 0.0001 0.0001 0.0001 0.0001 Level3 0.0019 0.0019 0.0018 0.0018 0.0018 0.0019 0.0019 0.0019 Level4 0.0287 0.0286 0.0284 0.0277 0.0276 0.0282 0.0279 0.0282 SUM 0.0307 0.0306 0.0303 0.0296 0.0295 0.0302 0.0299 0.0301 (d) Power of the detail coefficients of stop valve4
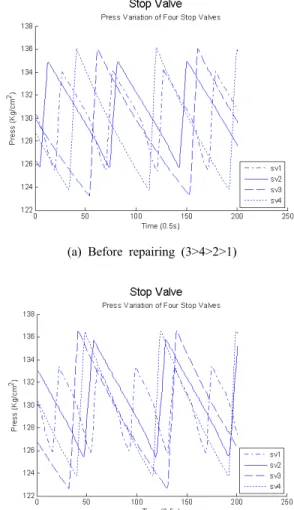
analysis (after repairing), the status of the stop valves changed to the following order: SV3, SV2, SV4, and SV1. This is because stop valve SV2 was repaired during the overall period to decrease leakage of the pressure. As shown in Figure 8, the pressure leakage of stop valve 2 was reduced and the maximum pressure increased to 136 kg/cm2.
From the results, the changed conditions of the valves can be detected and diagnosed by the applied algorithm without retraining the diagnosis algorithm. Therefore the proposed system can be employed in the field for nuclear plant diagnosis.
(a) Before repairing (3>4>2>1)
(b) After repairing during overall periods (3>2>4>1) Figure 8: 4-scales multiresolution for stop valves.
Details Governor Valve1: Seven Test Samples
1 2 3 4 5 6 7 Avg
Level1 0 0 0 0 0 0 0 0
Level2 0 0 0 0 0 0 0 0
Level3 0.001 0.0001 0.0001 0.0001 0.0001 0.0001 0.0001 0.0002 Level4 0.0042 0.0037 0.0036 0.0041 0.0029 0.0016 0.0027 0.0033 SUM 0.0052 0.0038 0.0037 0.0042 0.003 0.0017 0.0028 0.0035 Table 4: Results of feature extraction from governor valve signal.
(a) Power of the detail coefficients of governor valve1
Details Governor Valve2: Seven Test Samples
1 2 3 4 5 6 7 Avg
Level1 0 0 0 0 0 0 0 0
Level2 0 0 0 0 0 0 0 0
Level3 0.0005 0.0005 0.0005 0.0006 0.0006 0.0006 0.0005 0.0005 Level4 0.0127 0.0128 0.0123 0.0113 0.0114 0.0107 0.0108 0.0117 SUM 0.0132 0.0133 0.0128 0.0119 0.012 0.0113 0.0113 0.0123 (b) Power of the detail coefficients of governor valve2
Details Governor Valve3: Seven Test Samples
1 2 3 4 5 6 7 Avg
Level1 0 0 0 0 0 0 0 0
Level2 0 0 0 0 0 0 0 0
Level3 0.006 0.0006 0.0006 0.0006 0.0006 0.0006 0.0007 0.0014 Level4 0.0135 0.0136 0.014 0.0135 0.0133 0.0133 0.0134 0.0135 SUM 0.0195 0.0142 0.0146 0.0141 0.0139 0.0139 0.0141 0.0149 (c) Power of the detail coefficients of governor valve3
Details Governor Valve4: Seven Test Samples
1 2 3 4 5 6 7 Avg
Level1 0 0 0 0 0 0 0 0
Level2 0 0 0 0 0 0 0 0
Level3 0.0004 0.0003 0.0004 0.0005 0.0005 0.0004 0.0005 0.0004 Level4 0.0083 0.0095 0.0103 0.0083 0.0076 0.0079 0.0086 0.0086 SUM 0.0087 0.0098 0.0107 0.0088 0.0081 0.0083 0.0091 0.0091 (d) Power of the detail coefficients of governor valve4
5.3 Rule Generation for Condition Diagnosis Based on Decision Tree
The features extracted by wavelet decomposition
were classified using diagnosis rules. Energy values of the four levels and the S-index, a total of five inputs, were used for rule extraction using the decision tree algorithm. The decision tree is a map of the reasoning process, so it can be used to explain why a question is being asked. The decision tree algorithm was applied to generate classification rules for the valve conditions. The following decision tree assumes that questions are answered with a certain yes or no. A tree that allows answering with a partial yes or no would have a much larger number of end nodes. In practical problems, the intuition of a human expert, or expert system software, is necessary to determine the likely end node. Each end node represents a situation with known effective and efficient leadership styles. Entropy and gain are used to extend branches of trees.
i c
i
i p
p S
Entropy 2
1
log )
(
∑
= −
≡ (2)
) ( )
( )
, (
) (
v A
Values v
vEntropyS S S S
Entropy A
S
Gain ∑
∈
−
≡ (3)
5.3.1 Results of Condition Diagnosis
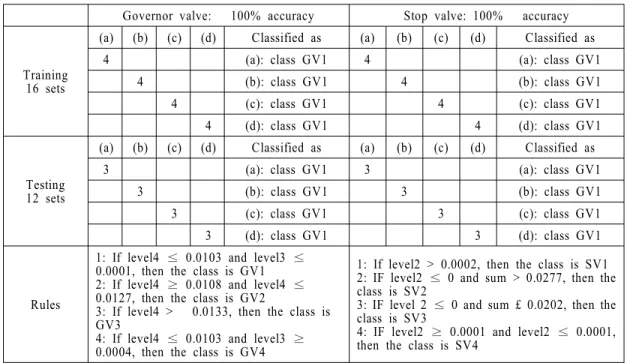
Table 5 shows the results of the condition diagnosis using the wavelet-based features and decision tree. Seven sampling data sets were applied. Among the whole data sets, four data sets were used for training and three sets were used for validation using the developed tree model. The four energy values (from level 1 to level 4) obtained using wavelet decomposition and the sum of the four level energy values were employed as inputs to the model. As shown in Figures 4 and 6, the sum values were quite different between the valve statuses. The signals used in this study have significant information to diagnose the valve conditions, so there is no error in the training and testing results. In comparing the results, it was assumed that level 3 and level 4 values had a
Governor valve: 100% accuracy Stop valve: 100% accuracy
Training 16 sets
(a) (b) (c) (d) Classified as (a) (b) (c) (d) Classified as
4 (a): class GV1 4 (a): class GV1
4 (b): class GV1 4 (b): class GV1
4 (c): class GV1 4 (c): class GV1
4 (d): class GV1 4 (d): class GV1
Testing 12 sets
(a) (b) (c) (d) Classified as (a) (b) (c) (d) Classified as
3 (a): class GV1 3 (a): class GV1
3 (b): class GV1 3 (b): class GV1
3 (c): class GV1 3 (c): class GV1
3 (d): class GV1 3 (d): class GV1
Rules
1: If level4 ≤ 0.0103 and level3 ≤ 0.0001, then the class is GV1 2: If level4 ≥ 0.0108 and level4 ≤ 0.0127, then the class is GV2
3: If level4 > 0.0133, then the class is GV34: If level4 ≤ 0.0103 and level3 ≥ 0.0004, then the class is GV4
1: If level2 > 0.0002, then the class is SV1 2: IF level2 ≤ 0 and sum > 0.0277, then the class is SV2
3: IF level 2 ≤ 0 and sum £ 0.0202, then the class is SV3
4: IF level2 ≥ 0.0001 and level2 ≤ 0.0001, then the class is SV4
Table 5: Results of condition diagnosis and generated rules.
greater effect on the diagnosis performance of the governor valves, because the diagnosis rules were generated by using both values. However, in the stop valve results, level 2 and sum values were selected for rule generation. The selected variables mean that the pressure signals associated with the status have their own features at the specific frequency. The value of level 1 shows the highest frequency and the value of level 4 indicates the lowest frequency in this study.
By using the extracted rules, condition diagnosis of the governor and stop valves was accomplished.
The performance of this algorithm using wavelet transform was similar to the previous approaches such as fuzzy logic- and Fourier transform-based analysis. However, in the fuzzy logic-based analysis, it is not easy to extract the inference rules without expert’s knowledge. In particular, it is quite difficult to generate the inference rules with too many inputs. In Fourier transform-based analysis, the conditions were not diagnosed using Fourier
transform alone, so one auxiliary feature (amplitude) extracted from the raw signal was used together. The Fourier transform approach is very useful in analyzing high frequency signals, but the pressure signals used in this study did not have many high frequency elements. In comparing the results between the previous approaches and the proposed approach, wavelet transform-based analysis was easy to apply because there is no inference rule, and the status can be clearly diagnosed using only the proposed approach.
6. Conclusions
This study deals with the condition diagnosis of the turbine valves in the K nuclear power plant.
The control valves in the high pressure turbine consist of the four stop valves and the four governor valves that are operated by oil pressure.
Information gathering from the valves is limited, so pressure variation of the oil pressure system can be just monitored. Therefore, aging conditions and
faults of the valves inside can be analyzed and diagnosed using pressure information. In this study, wavelet transform for signal transform of the pressure signals were applied to design the condition diagnosis system for the valves. The wavelet analysis is the easier method than the FFT analysis because feature extraction is achieved easily. It was a major advantage for the wavelet based condition diagnosis. Energy values of wavelet decomposition were employed as features in the proposed study.
After feature extraction based on wavelet transform, the decision tree algorithm was applied to extract the rules for status classification. The diagnosis results using wavelet transform were compared with those using fuzzy logic and Fourier transform. In the comparison of the results, it ensures that wavelet transform-based condition diagnosis for the stop valve and the governor valve is effectively achieved. In special, performance variation of the valves operated under the changed valve condition was immediately detected by the designed diagnosis algorithm. Therefore leakage of the valve oil pressure system can be reduced without physical experiments and performance analysis.
References
[1] S. H. Jang and W. P. Baek, Nuclear Safety, Cheong Moon Gak, pp. 1-37, 1998.
[2] Korea Electric Power Research Institute, Development of Digital Control System of Turbine Governor of Nuclear Power Plant, Technical Report, Korea Electric Power Research Institute, 2003.
[3] Electric Power Research Institute, Governor Control Logic Drawing of Kori Nuclear Power Plant #2, Technical Report, Electric Power Research Institute, 2004.
[4] J. P. Kim, B. M. Goo, and J. G. Park,
"Development of water quality monitoring and diagnosis system of the secondary circuit of the nuclear power station," Power Research, vol. 1, pp. 303-315, 1994.
[5] W. R. Nelson, "REACTOR: An expert system for diagnosis and treatment of nuclear reactor accidents," Proceedings Association for the Advancement of Artificaial Inteligence, pp.
296-301, 1982.
[6] W. R. Nelson, "Response Trees and Expert System for nuclear reactor operation,"
Technical Report NUREG/CR-3631, Idaho National Engineering Laboratory, EG & G Idaho, 1984.
[7] Hyeon Bae, Yountae Kim, Gyeongdong Baek, Byung-Wook Jung, Sungshin Kim, and Jung-Pil Shin, "Diagnosis of turbine valves in the kori nuclear power plant using fuzzy Logic and neural networks," Lecture Notes in Computer Science, vol. 4493, pp. 641-650, 2007.
[8] Korea Electric Power Corporation, Control System of the Turbine Governor, Technical Report, Korea Electric Power Corporation, 1995.
[9] GEC, Sub-Contractor’s Instrumentation Book 30 (Electro-Hydraulic Governor), GEC MANUAL, vol. 4, 1982.
[10] R. Agrawal, K. I. Lin, H. S. Sawhney, and K.
Shim, "Fast similarity search in the presence of noise, scaling, and translation in times-series databases," Proceedings of the 21st International Conference on Very Large Data Bases, pp. 490-500, 1995.
[11] C. Faloutsos, M. Ranganathan, and Y.
Manolopoulos, "Fast subsequence matching in time-series databases," Proceedings of the ACM SIGMOD Conference, Mineapolis, MN, pp. 419-429, 1994.
[12] Y. S. Moon, K. Y. Whang, and W. K. Loh,
"Efficient time-series subsequence matching using duality in constructing windows,"
Information Systems, vol. 26, no. 4), pp.
279-293, 2001.
[13] Dina Q. Goldin and Paris C. Kanellakis, "On similarity queries for timeseries data:
Constraint specification and implementation,"
Proceedings of the 1st International Conference on Principles and Practice of Constraint Programming (CP'95), Cassis, France, 1995.
[14] Davood Rafiei and Alberto O. Mendelzon,
“Similarity-based queries for time series data,”
Proceedings of the ACM SIGMOD International Conference on Management of Data, pp. 13-25, USA, 1997.
[15] Davood Rafiei and Alberto O. Mendelzon,
“Efficient retrieval of similar time sequences using DFT”, Proceedings of the 5th International Conference on Foundation of Data Organization, Japan, 1998.
[16] Kin-Pong Chan and Ada Wai-Chee Fu,
"Efficient time series matching by wavelets,"
Proceedings of the 15th International Conference on Data Engineering, pp. 126-133, 1999.
[17] Yi-Leh Wu, Divyakant Agrawal, and Amr El Abbadi, "A comparison of DFT and DWT based similarity search in time-series databases," Proceedings of the ninth international conference on Information and knowledge management, pp. 488-495, 2000.
[18] Kin-Pong Chan, Ada Wai-Chee Fu, and Clement T. Yu, "Haar wavelets for efficient similarity search of time-series: With and without time warping," IEEE Transactions on Knowledge and Data Engineering, vol 15, no.
3, pp. 686-705, 2003.
[19] Ivan Popivanov and Renee J. Miller,
"Similarity search over time-series data using wavelets," Proceedings of the 18th International
Conference on Data Engineering, pp. 212-221, 2002.
[20] I. Daubechies, Ten Lectures on Wavelets.
SIAM, 1992.
[21] C. Goutte, "On clustering fMRI time series,"
NeuroImage, vol. 9, no. 3, pp. 298-310. 1999.
[22] K. Kalpakis, D. Gada, and V. Puttagunta,
"Distance measures for effective clustering of ARIMA time-series," Proceedings of the 2001 IEEE International Conference on Data Mining (ICDM'01), pp. 273-280, 2001.
[23] Eamonn Keogh Michail Vlachos, Jessica Lin and Dimitrios Gunopulos, "A wavelet-based anytime algorithm for k-means clustering of time series," Proceedings of Workshop on Clustering High Dimensionality Data and Its Applications, 2003.
[24] Jarke J. van Wijk and Edward R. van Selow,
"Cluster and calendar based visualization of time series data," Proceedings of IEEE Symposium on Information Visualization, pp.
4-9, 1999.
[25] O. Tim, L. Firoiu, and P. Cohen, "Clustering time series with hidden Markov models and dynamic time warping," Proceedings of the IJCAI-99 Workshop on Neural, Symbolic and Reinforcement Learning Methods for Sequence Learning, pp. 17-21, 1999.
[26] T. C. Fu, F. L. Chung, V. Ng, and R. Luk,
"Pattern discovery from stock time series using self-organizing maps," Workshop Notes of KDD2001 Workshop on Temporal Data Mining, pp. 27–37, 2001.
[27] Daniel T. Larose, Discovering Knowledge in Data: An Introduction to Data Mining, Wiley, 2004.
[28] Wavelet Toolbox™ 4.2, MATLAB®, The MathWorks, Inc., 01 Mar 2008.