INTRODUCTION
Multiple myeloma (MM) is characterized by a widespread proliferation of monoclonal plasma cells in the bone marrow.
The common clinical features of MM are bone destruction, in- cluding osteolytic lesions, fracture, vertebral collapse, and os- teoporosis.
Bone mineral density (BMD) measured by dual-energy X- ray absorptiometry (DXA) is used to diagnose osteoporosis and assess fracture risk. DXA is a diagnostic technique based on low dose radiation that is non-invasive, has short scan times, involves a quick setup for patients, and has good measurement
precision (1). It provides a value of BMD which can be com- pared with an age- and sex-matched reference range.
The Saville index has been a widely used method for the grading of osteoporosis in daily practice (2). While osteoporo- sis is one of the major features of MM, there has been no study that the Saville index can be used for assessing osteoporosis even in MM to our knowledge.
We wondered whether the pattern or extent of myeloma cell involvement on magnetic resonance (MR) imaging was corre- lated with the degree of osteoporosis. There has been only one study comparing the MR pattern with the degree of osteoporo- sis in MM (3).
J Korean Soc Radiol 2013;68(1):63-69
Received October 23, 2012; Accepted December 4, 2012 Corresponding author: Soon Tae Kwon, MD Department of Radiology, Chungnam National University Hospital, 282 Munhwa-ro, Jung-gu, Daejeon 301-721, Korea.
Tel. 82-42-280-7836 Fax. 82-42-253-0061 E-mail: [email protected]
Copyrights © 2013 The Korean Society of Radiology
Purpose: To analyze the bone mineral density (BMD) in multiple myeloma (MM) and to compare BMD with plain radiography, MRI and clinical stage.
Materials and Methods: We reviewed 59 patients with MM and an age- and sex- matched control group, with measured BMD. The L-spine and femoral neck (FN) BMD were measured by dual-energy X-ray absorptiometry. Lateral plain radio- graphs of the L-spine were graded as 3 stages using the modified Saville index. Four bone marrow patterns were classified on sagittal T1- and T2-weighted magnetic resonance images of the L-spine. BMD in the MM and control group were analyzed.
BMD in MM was compared with the modified Saville index, bone marrow patterns on MRI, and clinical stages.
Results: In MM, spine BMD was reduced and the difference between spine and FN BMD was larger than the control group (p < 0.001). The modified Saville index was negatively correlated with spine T scores (p < 0.01). The spine BMD in normal mar- row pattern on the MRI was the most reduced. There was no statistical correlation between BMD and clinical stage.
Conclusion: In MM, spine BMD was significantly reduced and the difference be- tween spine and FN BMD was larger than the control group. The modified Saville index was significantly correlated with spine BMD in MM.
Index terms Multiple Myeloma Bone Mineral Density Magnetic Resonance Imaging Plain Radiography
Analysis of Bone Mineral Density in Multiple Myeloma: A Comparison of Bone Mineral Density with Plain Radiography, Magnetic Resonance Imaging, and Clinical Staging
1다발성 골수종 환자의 골밀도 분석: 골밀도와 요추 단순방사선영상, 자기공명영상, 임상병기와의 비교1
Ji Na Kim, MD
1, Soon Tae Kwon, MD
1, Ik Chan Song, MD
2Departments of 1Radiology, 2Internal Medicine, Chungnam National University Hospital, Daejeon, Korea
detected (type II). Bone marrow demonstrating a very inho- mogeneous patchy pattern on both T1- and T2-weighted imag- es was described as a so-called “salt-and-pepper” pattern (type III). Fourth, a diffuse infiltration pattern was defined by the presence of a homogenous hypointense change in the whole spine, similar or lower than the disc signal intensity on T1- weighted images with a hyperintense signal on T2-weighted images (type IV). The clinical stage was graded by the Durie- Salmon staging system (DSS) (5) and the international staging system (ISS) (6).
A t-test was used to compare the difference between the spine and femoral neck BMD in both the study and control groups.
The BMD values in MM were compared with the grade by the modified Saville index, the bone marrow patterns on MR im- aging, and the clinical stages, using one-way and repeated mea- sures analysis of variance. Statistical analysis was performed us- ing the SPSS 10.0/PC computer program (SPSS Inc., Chicago, IL, USA).
RESULTS
Out of 113 patients, 59 were enrolled in this study. They con- sisted of 28 men and 31 women (mean age, 66 years; range, 40- 86 years). An age- and sex-matched control group of 59 sub- jects was also collected.
In patients with MM, the spine BMD T score was -2.7 ± 1.5 (mean ± SD, g/cm2) and Z score was -1.3 ± 1.3 and femoral neck BMD T score was -1.6 ± 1.2 and Z score was -0.6 ± 1.0. In the control group, spine BMD T score was -1.6 ± 1.2 and Z score was -0.3 ± 1.2 and femoral neck BMD T score was -1.5 ± 0.9 and Z score was -0.5 ± 0.9 (Table 1).
The spine BMD was significantly reduced in MM patients compared to the control group (p < 0.001). The difference be- tween spine and femoral neck BMD (T score 1.0 ± 1.0, Z score 0.7 ± 0.9) in MM was significantly greater than that in the control group (T score 0.2 ± 0.9, Z score 0.2 ± 0.9) (p < 0.001) (Fig. 1).
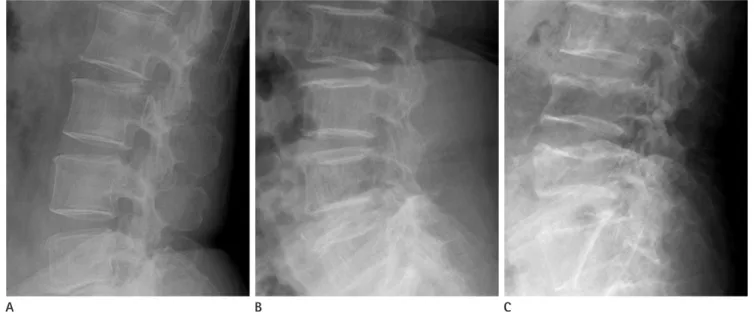
According to the modified Saville index, plain radiographs of the patients with MM were classified as grade 1 (n = 24), grade 2 (n = 20), and grade 3 (n = 15) (Fig. 2). The results of the mod- ified Saville index were negatively correlated with the spine BMD T scores (r = 0.3, p < 0.01).
With regard to the analysis of the bone marrow pattern on The purpose of our study was to analyze the BMD in patients
with MM and compare the BMD value with a grade of osteo- porosis on plain radiograph, the bone marrow pattern on the MR image, and the clinical stage.
MATERIALS AND METHODS
We retrospectively reviewed 113 patients with newly diag- nosed MM between 2005 and 2012 in our institute. Among them, 67 patients who had BMD measurements and who un- derwent plain radiography and MR imaging of the lumbar spine were selected. Six patients with a metal prosthesis or bone cement insertion in the spine were excluded from the analysis.
Two patients were excluded due to an inadequate laboratory test. An age and sex matched control group with BMD mea- surements obtained for health-screening purposes was also col- lected.
In both the study and control groups, BMD (g/cm2) was measured in the spine (L1-L4, antero-posterior view) and fem- oral neck by a DXA (Hologic, Inc., Bedford, MA, USA). Lateral plain radiographs of the lumbar spine were classified as three grades using a modified Saville index (grade 1, minimal loss of density; grade 2, more obvious vertical striation and concave endplate; grade 3, more severe loss of bone density than grade 2, greater reduction in height, or collapsed vertebral body).
MR imaging was taken by a 3.0-T and 1.5-T MR systems (Achieva, Philips Medical Systems, Best, The Netherlands; Sig- na HDxt, GE Healthcare, Milwaukee, WI, USA; Signa Excite, GE Healthcare, Milwaukee, WI, USA). All patients underwent sagittal fat-suppressed T2-weighted MR images, sagittal T1- weighted MR images, and axial T1- and T2-weighted images of the lumbar spine. Among them, sagittal T1- and fat-suppressed T2-weighted images were evaluated in this session.
Two radiologists specializing in the musculoskeletal system assessed the bone marrow infiltrative pattern in consensus. Four different bone marrow patterns on MR imaging could be dif- ferentiated. Bone marrow with a hyperintense signal compared with the disc on T1-weighted images and a hypointense signal compared to the muscle tissue on T2-weighted images was re- garded as normal (type I) (4). The bone marrow pattern was described as a multiple focal pattern if any T1-weighted hy- pointense and T2-weighted hyperintense signal lesions were
Fig. 1. BMD in MM and control group.
A. Spine BMD was significantly reduced in MM patients compared to the control group (p < 0.001).
B. The difference between spine and femoral neck BMD in MM was larger than that in the control group (p < 0.001).
Note.-BMD = bone mineral density, MM = multiple myeloma
-6.0 -3.0
-4.0 -2.0
-2.0
-1.0 0.0
0.0 1.0
2.0 2.0
4.0 3.0
Spine T score Difference of spine and femoral neck T score
40 50 60 70 80 90 40 50 60 70 80 90
Age B Age
A
Control group Multiple myeloma
Control group Multiple myeloma Control group Multiple myeloma
Control group Multiple myeloma
A B C
Fig. 2. Modified Saville index.
A. Lateral plain radiograph of L-spine shows minimal decreased bone density indicating modified Saville index grade 1.
B. More obvious vertical striation with concave endplates reveals modified Saville index grade 2.
C. Severe diminished bone density and a more collapsed vertebral body indicates modified Saville index grade 3.
Table 1. Comparison of Spine and Femoral Neck BMD in Both MM and Control Group
Multiple Myeloma Control Group
Mean (g/cm2) SD Mean (g/cm2) SD
T score Spine -2.69 1.52 -1.63 1.20
Femoral neck -1.64 1.20 -1.48 0.93
Difference 1.05 0.96 0.15 0.86
Z score Spine -1.30 1.28 -0.34 1.25
Femoral neck -0.60 1.00 -0.51 0.88
Difference 0.70 0.94 0.17 0.87
Note.-BMD = bone mineral density, MM = multiple myeloma, SD = standard deviation
cells characterized by bone marrow infiltration and the produc- tion of monoclonal immunoglobulin. While myeloma cells in- duce increased osteoclast activation and osteoclastic bone re- sorption, the effects on the osteoblasts are more complex, leading to painful osteolytic destruction and pathologic fractures (7, 8).
Demineralization and lytic bone lesions in MM can be as- sessed by plain radiography, computed tomography, MR imag- ing, and DXA. Among them, DXA is a sensitive, noninvasive, and relatively inexpensive technique for the diagnosis and fol- low-up of metabolic bone disease such as osteoporosis (9-11).
Since MM is one of the etiologies of secondary osteoporosis, MR imaging, 12 patients showed type I (Fig. 3), 14 type II (Fig.
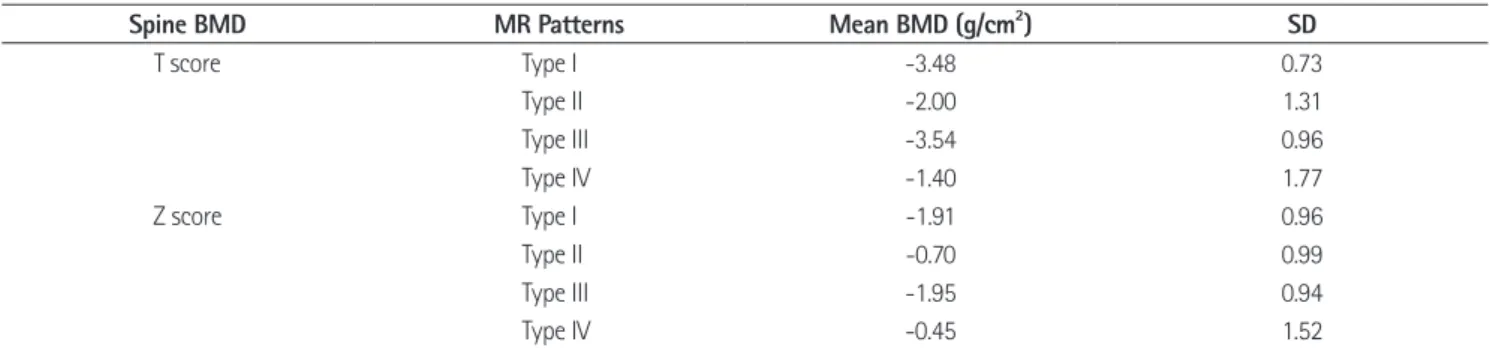
4), 20 type III (Fig. 5) and 13 type IV (Fig. 6). Compared to MR images, the BMD in the type I and type III was lower than the BMD in the other 2 patterns (p < 0.5), with the BMD in the type I on MR images showing the greatest decrease (Table 2).
There was no statistical correlation between BMD and clini- cal stages by DSS and ISS.
DISCUSSION
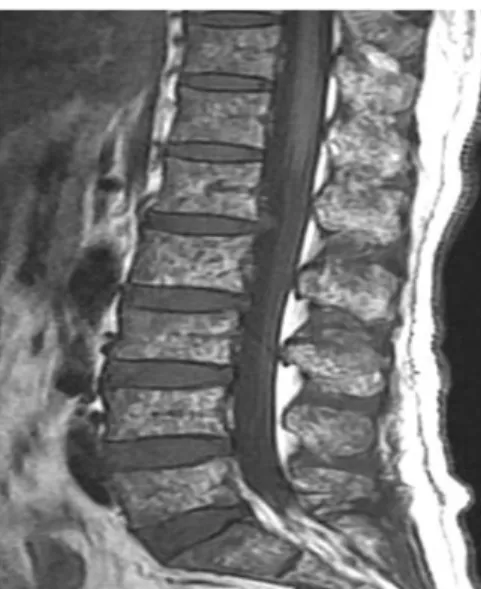
The clinical features of MM result from the proliferation of B Fig. 3. Normal marrow pattern on magnetic resonance images. Bone marrow shows hyperintense signal compared with the disc on T1- weighted images.
Fig. 5. Salt-and-pepper pattern. The bone marrow shows a very inho- mogeneous patchy signal on T1-weighted images.
Fig. 4. Multiple focal pattern on magnetic resonance images. Multifocal
T1-weighted hypointense lesions are detected in the L-spine. Fig. 6. Diffuse infiltrative pattern. Homogenous hypointense change which is similar or lower than disc signal intensity on T1-weighted im- ages is shown in the spine.
pecially in the femoral neck.
In our study, femoral neck BMD was slightly higher than spine BMD in the control group; however, the difference between spine and femoral neck BMD in the control group was quite smaller than in patients with MM. This suggests that MM may involve the spine much more such that, with its high proportion of cancellous bone, it may be more prone to osteoporosis.
Generally, the Saville index has been used for the scoring of spinal osteopenia from grade 0 to grade 4 (2). In this study, the spine was graded by a modified Saville index to improve inter- and intra-observer agreement between the original Saville in- dex grade 1 and grade 2. In our study, the grades by the modi- fied Saville index in MM were correlated with the T-score by DXA. We therefore concluded that the modified Saville index on plain radiography was a valuable grading system for osteo- porosis in MM in daily practice.
In theory, a collapsed vertebral body may increase BMD per unit area and thus result in a falsely elevated BMD value. How- ever, in our study, spine BMD in MM with a modified Saville index grade 3 indicating vertebral collapse tended to reduce compared to grade 1 or 2. Consistent with a previous study (14), we concluded that demineralization and loss of trabecular bone in MM may not lead to bone condensation in a collapsed vertebra. Therefore, we agreed that when using DXA in pa- tients with MM, collapsed vertebrae need not be excluded from the analysis.
Recently, MR imaging has been used for diagnosis, staging, and assessing the treatment response in MM. To our knowl- edge, there has only been one report comparing BMD and MR imaging patterns in MM. Mariette et al. (3) suggested that, in asymptomatic patients with stage I MM, spine BMD values the efficacy of the measurement of BMD by DXA in MM has
previously been reported. Some studies have suggested that an increased risk of early vertebral collapse could be predicted by DXA (7, 12). Other studies have reported that measuring the BMD value by DXA can be used as a marker of treatment re- sponse in MM (11, 13). Another study supported an advantage of DXA in predicting the prognosis in the asymptomatic stage I MM (3). In addition, low lumbar BMD correlated with the se- verity of the radiological finding at the time of diagnosis (14).
In our study, measuring BMD by DXA was useful in distin- guishing certain characteristics of MM. Compared to the con- trol group spine BMD in MM was significantly diminished.
Femoral neck BMD was not significantly different in both groups. Hence, in MM, the difference between spine BMD and femoral neck BMD was larger than that in the control group.
This discrepancy of spine and femoral neck BMD in MM has been rarely reported previously. One study reported that lum- bar BMD was often diminished in MM at diagnosis, whereas femoral neck BMD was rarely affected (14).
Discordance between spine and femoral neck BMD could also be present in the normal population (1). A possible expla- nation is the varying proportion of cancellous and cortical bone at the different sites. First, cancellous bone, which repre- sents 20% of the total bone mass, has an accelerated metabo- lism and therefore a more rapid and earlier loss than cortical bone. This could be an important explanation for the presence of a lower spine BMD in the relatively young population in the early postmenopausal period (1). Second, most of the causes for secondary osteoporosis first affect the spine, leading to a higher prevalence of lumbar spine osteoporosis. Third, there is the possibility that weight bearing can cause a rise in BMD, es-
Table 2. Comparison of Spine BMD and Bone Marrow Patterns on MR Imaging in MM
Spine BMD MR Patterns Mean BMD (g/cm2) SD
T score Type I -3.48 0.73
Type II -2.00 1.31
Type III -3.54 0.96
Type IV -1.40 1.77
Z score Type I -1.91 0.96
Type II -0.70 0.99
Type III -1.95 0.94
Type IV -0.45 1.52
Note.-Type I = normal pattern, Type II = multiple focal pattern, Type III = salt-and-pepper pattern, Type IV = diffuse infiltrative pattern. BMD = bone min- eral density, MM = multiple myeloma, MR = magnetic resonance, SD = standard deviation
be considered as a useful method for assessing osteoporosis in MM. The BMD with a normal marrow pattern on MR imaging tended to be lower than in other patterns. Furthermore, the BMD did not correlate with the clinical stage in MM.
REFERENCES
1. Mounach A, Abayi DA, Ghazi M, Ghozlani I, Nouijai A, Achemlal L, et al. Discordance between hip and spine bone mineral density measurement using DXA: prevalence and risk factors. Semin Arthritis Rheum 2009;38:467-471 2. Saville PD. A quantitative approach to simple radiographic
diagnosis of osteoporosis: its application to the osteoporosis of rheumatoid arthritis. Arthritis Rheum 1967;10:416-422 3. Mariette X, Zagdanski AM, Guermazi A, Bergot C, Arnould
A, Frija J, et al. Prognostic value of vertebral lesions de- tected by magnetic resonance imaging in patients with stage I multiple myeloma. Br J Haematol 1999;104:723- 729
4. Baur A, Stäbler A, Bartl R, Lamerz R, Scheidler J, Reiser M.
MRI gadolinium enhancement of bone marrow: age-relat- ed changes in normals and in diffuse neoplastic infiltra- tion. Skeletal Radiol 1997;26:414-418
5. Durie BG, Salmon SE. A clinical staging system for multi- ple myeloma. Correlation of measured myeloma cell mass with presenting clinical features, response to treatment, and survival. Cancer 1975;36:842-854
6. Greipp PR, San Miguel J, Durie BG, Crowley JJ, Barlogie B, Bladé J, et al. International staging system for multiple myeloma. J Clin Oncol 2005;23:3412-3420
7. Abildgaard N, Brixen K, Eriksen EF, Kristensen JE, Nielsen JL, Heickendorff L. Sequential analysis of biochemical markers of bone resorption and bone densitometry in multiple my- eloma. Haematologica 2004;89:567-577
8. Lütje S, de Rooy JW, Croockewit S, Koedam E, Oyen WJ, Raymakers RA. Role of radiography, MRI and FDG-PET/CT in diagnosing, staging and therapeutical evaluation of pa- tients with multiple myeloma. Ann Hematol 2009;88:1161- 1168
9. Dhodapkar MV, Weinstein R, Tricot G, Jagannath S, Parfitt AM, Manolagas SC, et al. Biologic and therapeutic deter- minants of bone mineral density in multiple myeloma.
were similar between the two groups that had initial normal and abnormal MR findings. An abnormal MRI pattern did not correlate with the degree of osteoporosis evaluated by spine BMD in stage I MM.
In our study, the bone marrow pattern on MR imaging was classified as normal, multiple focal, salt-and-pepper, and dif- fuse infiltrative (8, 15-18). We compared the bone marrow pat- terns on MR imaging to the BMD. We found that BMD with a normal marrow pattern tended to be lower than other patterns.
A normal marrow pattern reveals as minor microscopic plasma cell infiltration (< 20 volume% in bone marrow biopsy) (8).
These patients are eligible for a “watch and wait” strategy. Al- though MR imaging is a sensitive modality for detecting bone marrow lesions, we concluded that the MR imaging pattern did not correlate with the status of mineralization. Further, in MM, the general MR pattern cannot predict fracture risk because of secondary osteoporosis.
In our study, the clinical stage in MM using the DSS and ISS was not correlated with spine and femoral neck BMD. Howev- er, because a strong correlation with vertebral fracture and low spine BMD has been suggested in previous studies (7, 14), we agree that BMD measurements are still useful in the initial di- agnosis of MM in addition to monitoring after treatment.
There were several limitations in our study. First, the evalua- tion of MR imaging patterns was difficult owing to the usage of 3 different MR machines. Nonetheless, 2 radiologists specializ- ing in the musculoskeletal system reached a consensus con- cerning bone marrow patterns. Second, BMD values were not adjusted to reflect age-related degenerative changes and, there- fore, relied on comparisons with BMD values in the control group. Third, other disease processes that would lead to a dis- cordance between femoral neck and spin BMD values could not be excluded. Fourth, our small sample size could have af- fected the observed decrease in BMD in the normal marrow pattern on MR imaging.
In MM, spine BMD was significantly reduced and the differ- ence between spine and femoral neck BMD was larger than in the control group. Multiple myeloma should therefore be in- cluded in the differential diagnosis when the discrepancy be- tween spine and femoral neck BMD in patients with osteopo- rosis is detected. The modified Saville index was significantly correlated with BMD in MM. The modified Saville index may
Haematol 1996;57:370-376
15. Hanrahan CJ, Christensen CR, Crim JR. Current concepts in the evaluation of multiple myeloma with MR imaging and FDG PET/CT. Radiographics 2010;30:127-142
16. Fechtner K, Hillengass J, Delorme S, Heiss C, Neben K, Goldschmidt H, et al. Staging monoclonal plasma cell dis- ease: comparison of the Durie-Salmon and the Durie- Salmon PLUS staging systems. Radiology 2010;257:195- 204
17. Baur-Melnyk A, Buhmann S, Dürr HR, Reiser M. Role of MRI for the diagnosis and prognosis of multiple myeloma.
Eur J Radiol 2005;55:56-63
18. Moulopoulos LA, Varma DG, Dimopoulos MA, Leeds NE, Kim EE, Johnston DA, et al. Multiple myeloma: spinal MR imaging in patients with untreated newly diagnosed dis- ease. Radiology 1992;185:833-840
Leuk Lymphoma 1998;32:121-127
10. Johnston CC Jr, Slemenda CW, Melton LJ 3rd. Clinical use of bone densitometry. N Engl J Med 1991;324:1105-1109 11. Mariette X, Khalifa P, Ravaud P, Frija J, Laval-Jeantet M,
Chastang C, et al. Bone densitometry in patients with multiple myeloma. Am J Med 1992;93:595-598
12. Karsh J. Diagnostic challenges in osteoporosis. Indications for bone densitometry and establishing secondary causes.
Can Fam Physician 2001;47:1244-1250
13. Mariette X, Bergot C, Ravaud P, Roux C, Laval-Jeantet M, Brouet JC, et al. Evolution of bone densitometry in pa- tients with myeloma treated with conventional or inten- sive therapy. Cancer 1995;76:1559-1563
14. Abildgaard N, Brixen K, Kristensen JE, Vejlgaard T, Charles P, Nielsen JL. Assessment of bone involvement in patients with multiple myeloma using bone densitometry. Eur J
다발성 골수종 환자의 골밀도 분석: 골밀도와 요추 단순방사선영상, 자기공명영상, 임상병기와의 비교1
김지나
1· 권순태
1· 송익찬
2목적: 다발성 골수종 환자의 골밀도를 분석하고 영상 소견, 임상병기와 비교 분석하였다.
대상과 방법: 다발성 골수종 환자 59명 및 건진으로 골밀도를 측정한 대조군 59명을 대상으로 하였다. 이중 에너지 방사 선 흡수 계측기로 요추 및 대퇴 경부의 골밀도를 측정하였다. 요추 측면 단순방사선영상에서 변형 Saville 지수를 측정하 고, 시상면 T1, T2 강조 자기공명영상에서 요추 골수 신호강도 양상을 네 가지로 분석하였다. 환자군과 대조군의 요추와 대퇴경부 골밀도 및 차이 정도를 알아보았다. 환자군 골밀도를 변형 Saville 지수, 골수 신호강도 양상, 임상병기와 각각 비 교 분석하였다.
결과: 다발성 골수종 환자의 요추 골밀도는 대조군보다 낮았다(p < 0.001). 환자군에서 요추와 대퇴경부 골밀도 차이는 대조군보다 더 컸다(p < 0.001). 변형 Saville 지수는 요추 골밀도 T값과 음의 상관관계를 보였다(p < 0.01). 자기공명영 상에서 정상 골수 신호강도를 보이는 환자의 골밀도가 가장 낮았다. 골밀도와 임상병기는 관련성이 없었다.
결론: 다발성 골수종의 골밀도는 정상군에 비해 의미있게 감소되었고, 요추와 대퇴경부 골밀도 차이도 컸다. 다발성 골수 종에서 변형 Saville 지수는 요추 골밀도와 유의한 상관관계를 보였다.
충남대학교병원 1영상의학과, 2내과