A Study on Car Ownership Forecasting Model using Category Analysis at High Density Mixed Use District in Subway Area
Tae-Gyun Kim1, Wan-Hee Byun2 and Young-Hoon Lee3 (Received June 7, 2011 / Revised July 5, 2011 / Accepted July 18, 2011)
ABSTRACT
The Seoul Metropolitan Government is striving to minimize the amount of traffic according to the supply of apartment houses along with the solution of housing shortage for the low income people through high density development near the subway area. Therefore, a stronger policy is necessary to control the traffic of the passenger cars in a subway area for the successful high density development focusing on public transportation, and especially, the estimation of the demand of cars with high reliability is necessary to control the demand of parking such as the limited supply of parking lot. Accordingly, this study developed car ownership forecasting model using Look-up Table among category analyses which are easy to be applied and have high reliability. The estimation method using Look-up-Table is possible to be applied to both measurable and immeasurable types, easy to accumulate data, and features the flexible responding depending on the changes of conditions. This study established Look-up-Table model through the survey of geographical location, the scale of housing, the accessible distance to a subway station and to a bus station, the number of bus routes, and the number of car owned with data regarding 242 blocks in Seoul City as subjects.
Key words: Subway area, High density mixed use development, Parking demand management, Category analysis, Look-up table, Car-ownership Forecasting model
http://lhi.lh.or.kr
1) Research Fellow, Land & Housing Institute (Main author: [email protected]) 2) Research Fellow, Land & Housing Institute (Corresponding author: [email protected]) 3) Researcher, Land & Housing Institute
1. Introduction
Recently, the government intends to convert a city through TOD (Transit Oriented Development) into the traffic system focusing on public transportation. Under this background, Seoul city makes an effort to minimize the traffic amount of cars according to the supply of apartment houses along with relief of house shortage for low income people by planning high-density mixed use development around the subway area that is provided with good quality service of public transportation.
However, once the current standard of housing complex construction is looked into, there are somewhat differences depending on regions but each household must have parking lot for more than at least one car on average, but in the case that exclusively used area is less than 60m2, it is stated that parking lot for more than 0.7 car must be provided1). Some argue that this standard for supplying parking lot has been excessively appro- priated, it is considered that in the case of foreign countries, the failure of TOD was attributed to the excessive supply of parking
lot (Land & Housing Institute, 2010). Moreover, there is room for the excessive supply in the case of rental houses having relatively low income in the current standard of parking lot construction, and even in case of the subway area, despite good quality service of public transportation being provided, it can cause rather a result to boost the increase of cars as sufficient parking lot is supplied. Therefore, the current status of car ownership depending on features of regions or social and economic conditions needs to be comprehended for efficient demand control of cars and the prospect of demand and supply of parking lot of houses that will be built in the future.
However, in spite of this necessity, since regional features and social and economic conditions are diverse depending on actual regions and it is necessary to investigate a field with a scale of inspection of the whole households to comprehend the current status of car ownership by regions, it is actually difficult to figure out the status of possession through this survey. Therefore, a method able to estimate representative value by grouping according to features should be sought to reflect diverse features by regions.
– 218 –
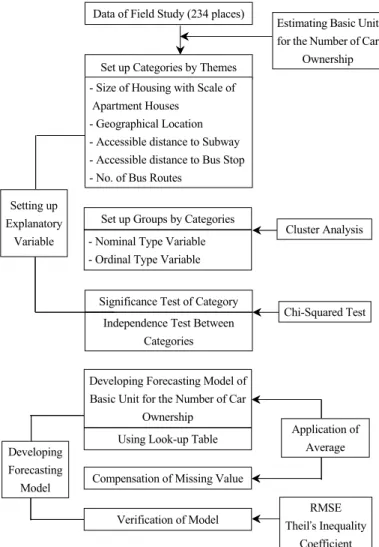
Developing Forecasting
Model
Data of Field Study (234 places)
Set up Categories by Themes
Set up Groups by Categories - Nominal Type Variable - Ordinal Type Variable
Significance Test of Category Independence Test Between
Categories
Using Look-up Table
Compensation of Missing Value
Verification of Model - Size of Housing with Scale of Apartment Houses
- Geographical Location - Accessible distance to Subway - Accessible distance to Bus Stop - No. of Bus Routes
Developing Forecasting Model of Basic Unit for the Number of Car
Ownership
Estimating Basic Unit for the Number of Car
Ownership
Setting up Explanatory
Variable
RMSE Theilʼs Inequality
Coefficient Chi-Squared Test Cluster Analysis
Application of Average
Fig. 1. Process of Forecasting the Basis Unit for the Number of Car Ownership
For this, this study is intended to establish a forecasting model to estimate the basic unit of car ownership per household by grouping various features using a category analysis method and through Look-up Table as a part of the category method to assume the number of cars that apartment houses have around the subway area in accordance with the implementation of high-density mixed use development around the subway area.
2. Contemplation of Previous Studies
In general, in the case that one household intends to own a car, various factors such as economic condition or social condition etc. of the household come to affect it. However, in the case that the features can be regionally identified or there is a special situation such as national rental houses in which low-income class inhabits, other factors could affect it and the effect of each factor could differently show up. Besides, since the ownership of a car directly has influence on the demand of parking, previous studies related with estimation of the number of possession is to be studied through the existing studies related to the demand of parking.
Once the related previous studies are looked into, Urban Housing Laboratory (1996) used to suggest the criteria for the supply of parking lot considering the location of apartment houses and regional features along with the suggestion of differential charging for parking fee in apartment houses and introduction of sales of parking lot separated. On the other hand, the example can be found at the studies that are related to the development of a forecasting model of the demand of parking through the survey of features of households (or houses). The Korea Transport Institute (2005) estimated the value of the year of 2015, 2020 by applying Gompertz Model that has the high limit of increase rate of households having cars and of the rate of households having cars by regions of income for the number of cars that households have by regions of income. As a result, it became a chance to improve poor parking environment of national rental houses as it suggested the value more than the existing standard of supplying parking lot. Ahn and Kim (2005) estimated the standard of supply by adding parking rate per household at night with the purchase rate of a new car, and suggested the standard depending on the scale of a city such as the Metropolitan area, a big city, a middle city, and a small city etc. and pointed out problems of the supply standard at that time that was irrelevant with the scale of a city, and argued the necessity of discriminatory standard of supplying parking lot considering surrounding use districts, population density, and accessibility of public transportation etc.1)If the main factors that affect the demand of parking were observed through the existing studies, the features of individuals and households mainly form the main current. Therefore, even though they would be very useful factors to comprehend the
1) Article 27, Regulations on Standard of Housing Construction;
Ministry of Government Legislation (2010), Law of Parking Lot.
demand of cars for now, more or less difficulties occur in reflecting the construction plan in the future. For this reason, this study is intended to estimate the basic unit of car ownership per household through factors easy to be reflected on future construction plans etc.
3. Development Process and Data Construction for the Car ownership Forecasting Model
3.1 Development Process of Forecasting Model As stated earlier, for the forecasting model to estimate the basic unit of the number of car possession per household using a category analysis method, many factors that affect car ownership were looked into, and they were categorized, and the final set-up variables were fixed through significance test between each category. And finally a model was established with a forecasting model of the basic unit for the number of car possession per household by the combination of the fixed variables using Look-up Table.
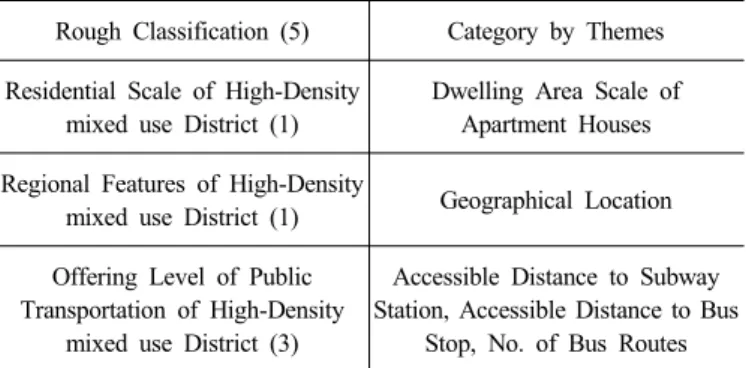
Table 1. Type of Category Affecting the Basic Unit for the Number of Car Ownership
Rough Classification (5) Category by Themes Residential Scale of High-Density
mixed use District (1)
Dwelling Area Scale of Apartment Houses Regional Features of High-Density
mixed use District (1) Geographical Location Offering Level of Public
Transportation of High-Density mixed use District (3)
Accessible Distance to Subway Station, Accessible Distance to Bus
Stop, No. of Bus Routes
3.2 Construction of Analyzed Data
In this study, a field study focusing on the apartment complex around the subway area which is the subject of high-density composition was conducted to estimate the basic unit of the number of car ownership.
The total enumeration survey was conducted with the subject of 16 administrative blocks, and by each block (building)2) of 30 complexes, which included the number of households by sizes, the number of car ownership, many kinds of regional features, conditions of public transportation, and the price of land. In the survey, one household was defined as one house, and cars registered at the management office was the subject for the number of car possession per household. In the case of apartment houses, when the number of car possession is more than 2 cars, there are some cases that people report the reduced number of cars than they actually have to the management office but the reported number of cars at the management office was defined as the number of cars that households have since they donʼt pay additional fee for the parking lot even though each household has more than 2 cars in the surveyed area.
Therefore, for the basic unit for the number of car possession per household was estimated, the basic unit was estimated with the total number of car possession against the total number of households by each type.
4. Setting up Categories of Factors Affecting the Number of Possession
4.1 Background and Necessity of Setting up Categories Various factors such as regional features of development district, scale of residence of apartment houses provided in the development district, and the offered service level of public transportation etc.
must be considered to estimate the demand of cars of apartment houses in the development district of high-density composition around the subway area that is to be planned in the future. However, in the case of individually considering these diverse factors by the project districts, it is judged that lots of efforts and costs will be consumed since the scale is very different.
Therefore, to make a necessary model for estimating the demand of cars in this study, the project districts with similarity by each characteristic were grouped by assuming that the rate of internal inflow of a project district with similar characteristics tends to have similar forms. For the plan, categories were set up by themes and similar properties within those categories were grouped, and the basic unit of car ownership per household in the each subway area was estimated by using multiple properties that each category has, connecting groups3) that were set up by each category.
2) The unit building in each apartment complex was as a block, and in the case that there are many types with different area in the same neighborhood, each of them was assumed as one block. Therefore, in this study, 243 block were comprised.
4.2 Standards for Setting up Categories by Themes The types of categories by themes to estimate the basic unit for the number of car possession in the high-density mixed use development district were largely classified as follows.
- Classification by the scale of residence in high-density mixed use development district
- Classification by regional features of high-density mixed use development district
- Classification by the offering level of public transportation in high-density mixed use development district
In terms of rough classification, the total 5 categories by themes were set up including one category by themes for the scale of residence in high-density mixed use development district, one category for regional features, and 3 categories for the offering level of public transportation.
In the classification of each group within categories by themes of the basic unit of car possession, the standard was established by the properties of data, by which the group of variables was divided into ordinal type and nominal type.
In the case of standards for classification by a nominal type,
‘Scale of Houses of Apartment Housesʼ of high-density mixed use development district and ‘Geographical Locationʼ that is a regional feature of high-density mixed use district are included.
In the case of standards for classification by an ordinal type, the standard was established on the basis of cluster analysis of data, and 3 categories of the offering level of public trans- portation of high-density mixed use district corresponds to the applied categories by themes.
3) The apartment complex around subway stations were surveyed such as Bulgwang station, Chungjeongro station, Hapjeong station, Hongik Univ. station, Gunja station, Seongsu station, Shinsangbong station, Yaksu station, Cheonggu station, Shindang station, Gangnam Office station, Gangdong station, Gyobo Tower station, Nonhyun station, Samreung Park station (a provisional name), Yangjae station, Daelim station, and Youngdeungpo Office station
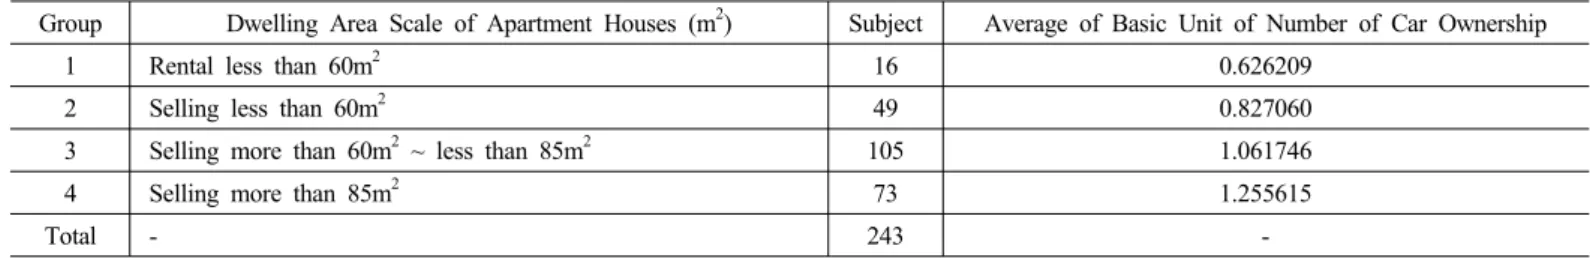
– 220 – Table 2. Distribution of Dwelling Area Scale of Apartment Houses
Group Dwelling Area Scale of Apartment Houses (m2) Subject Average of Basic Unit of Number of Car Ownership
1 Rental less than 60m2 16 0.626209
2 Selling less than 60m2 49 0.827060
3 Selling more than 60m2 ~ less than 85m2 105 1.061746
4 Selling more than 85m2 73 1.255615
Total - 243 -
Table 3. Distribution of Geographical Location
Group Classfied Region4) Subject Average of Basic Unit of Number of
Car Ownership
1 Northwest (4) Eunpyung, Seodaemun, Yongsan, Mapo, 39 0.965247
2 Northeast (8) Dobong, Nowon, Jungrang, Seongbuk, Ganbuk,
Gwangjin, Dongdaemun, Seongdong 12 1.239329
3 Southwest (7) Gangseo, Geumcheon, Yangcheon, Youngdeongpo,
Gwanak, Guro, Dongjak 52 1.050192
4 Central Region (4) Jongro, Jung, Seocho, Gangnam 90 1.105613
5 Southeast (2) Songpa, Gangdong 50 0.801724
Total - 243 -
Table 4. Distribution of Accessible Distance to Subway Station
Group Accessible Distance to
Subway Station (m) Subject Average of Basic Unit of Number of Car Ownership
1 Less than 300m 69 0.865888
2 300m to 500m 89 0.962264
3 500m to 700m 32 1.128565
4 700m to 1000m 53 1.227377
계 - 243 -
4.3 Setting up Categories by Forecasting Models and Themes
4.3.1 Dwelling Area Scale of Apartment Houses The Dwelling Area Scale of apartment houses in high-density mixed use district have influence on the standards of construction of parking lot. It varies whether it is rented or sold, and depending on the exclusively used area of apartment houses. In this study, the Dwelling Area Scale of apartment houses was classified into 4 groups by applying the rental and selling, and the standard of the exclusively used area of Nest Housing.
As a result, the rental house less than 60m2 showed the lowest basic unit of the number of car ownership as 0.626209, and the selling houses more than 85m2 showed the highest as 1.255615.
4.3.2 Geographical Location
In this study, Seoul area was the subject as the subway area that high-density mixed use development is made. Therefore, 25 autonomous districts were classified into 5 regions including the central region by the judgement that the basic unit of car possession would be different depending on geographical location.
As a result, if the average of basic unit of car possession by districts were observed, it was analyzed that the northeast district was the highest as 1.239329 cars, and the southeast district was the lowest as 0.801724 car.
4) The subway area of the complex to be surveyed are Bulgwang station, Chungjeongro station, Hapjeong station, Hongik Univ. station, Gunja
4.3.3 Accessible Distance to Subway Station
It can be considered that the range of option for car ownership of each household in high-density mixed use development district is widened depending on the offering level of public transportation that is an alternative method. Among them, in the case of the subway area, it can be said that the accessible distance to subway stations is very important. Therefore, the accessible distance to subway stations of high-density mixed use development district were established as 4 groups, and as a result, it was analyzed that the more the distance increased, the more the average of basic unit of the number of car possession increased.
If it was observed by groups, it was analyzed that if the accessible distance to a subway station is less than 300m, 0.865888
station, Seongsu station, Shinsangbong station, Yaksu station, Cheonggu station, Shindang station, Gangnam Office station, Gangdong station, Gyobo Tower station, Nonhyun station, Samreung Park station (a provisional name), Yangjae station, Daelim station, and Youngdeungpo Office station, and Table 3 shows the division of these complex by the administrative title.
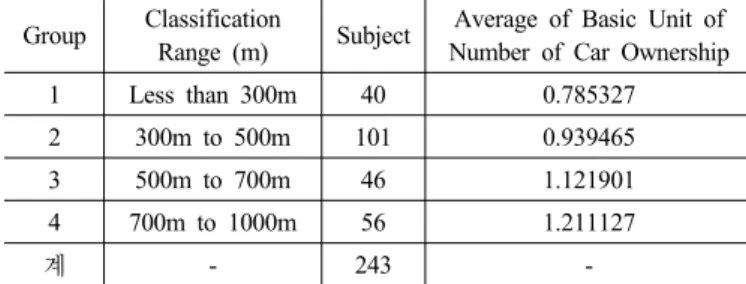
Table 5. Distribution of Accessible Distance to Bus Stop
Group Classification
Range (m) Subject Average of Basic Unit of Number of Car Ownership
1 Less than 300m 40 0.785327
2 300m to 500m 101 0.939465
3 500m to 700m 46 1.121901
4 700m to 1000m 56 1.211127
계 - 243 -
Table 6. Distribution of Bus Routes
Group Classificatin Range Subject Average of Basic Unit of Number of Car Ownership
1 Less than 10 routes 123 1.070649
2 11 to 20 routes 32 0.973300
3 More than 21 routes 88 0.941498
계 - 243 -
car, 0.962264 car for 300m through 500m, which showed that the number of car possession per household in the subway area with the accessible distance less than 500m was less than one car.
Besides, it was analyzed that as the accessible distance increased, the basic unit of the number of car ownership increased.
4.3.4 Accessible Distance to Bus Stop
In the subway area, likewise the accessible distance to a subway station, the accessible distance to a bus stop that can be a transfer method with the subway among public transportation also comes to affect car ownership. Therefore, this study established 4 groups for the accessible distance to a bus stop of high-density mixed use development district just as the category of ‘accessible distance to a subway stationʼ.
As a result, the average of basic unit of the number of car possession shows the aspect that as the accessible distance increases, it increases like the category of ‘accessible distance to a subway station’. Besides, it was analyzed that the basic unit of the number of car ownership was overall somewhat lower than the category of ‘accessible distance to a subway stationʼ.
If it were observed by groups, it was analyzed that if it were less than 300m, the average of basic unit of the number of car possession was 0.785327 car, 0.939465 car for 300m through 500m, which showed that the number of car possession per household in the region with the accessible distance less than 500m was less than one car on average. On the other hand, in the case of more than 500m, it was found that the number of car ownership per household was more than one car.
4.3.5 Number of Bus Routes
The number of bus routes that can be a transfer method for the subway was set up as a factor that can affect the car ownership in the subway area. However, itʼs reasonable to set up the scale of routes that can be replaced to the destination rather than the number of bus routes. But since the destination that is indivi- dually made is diverse, itʼs impossible to consider it in reality.
Therefore, the number of routes at a bus stop5) that is the closest to high-density mixed use development district was set up as a category. 3 groups were set up with a unit of 10 routes for the 5) The information of transfer of subway stations that are provided in a web site was used for the number of bus routes. (http://www.naver.com)
category of ‘the number of bus routesʼ. But the number of bus routes was calculated by defining both directions as a different route respectively.
As a result, it was analyzed that the case less than 10 routes had the highest basic unit of the number of car possession, and as the number of bus routes increases, the basic unit decreases, which indicates that as the number of bus routes increases, the replacement ratio of public transportation through a transfer between public transportation increases.
4.4 Significance Test of Categories
4.4.1 Necessity of Test
In this study, Rough classification as the scale of residence of the project district, regional features of the project district, and the offering level of public transportation in the project district that are explanatory factors was set up to estimate the basic unit of the number of car ownership and the reduction rate of owning cars. And it was intended to estimate the basic unit of the number of car possession by setting up the mixed use category on the basis of a category by themes of each rough classification.
Since homogeneous properties between each category as explanatory variables for reasonable estimation, which needs the test for it. Therefore, this study was to secure significance between each category through independence test between each category.
4.4.2 Test Method
Generally, it can be said that the method to set up a category based on cluster analysis has a characteristics of Exploratory Data Analysis (EDA), and the significance test of each area of a category as a confirmative phase is conducted with chi-squared test (-test) that has the hypothesis of homogeneity.
In terms of Chi-squared statistics, Pearson’s chi-squared statistics6) is the most general one, and the form of likelihood ratio chi-squared statistics7) that compensated this has become common. Besides, Mantel- Hanenszel method etc. that modified and supplemented chi-squared statistics and is suggested and utilized, and mutual pros and cons of these three statistics are presented.
6) ExpectedF r equ en cy
O bser vedF r equ en cy ExpectedF r equ en cy
7) O bser vedF r equ en cy × log ExpectedF r equ en cy
O bser vedF r equ en cy
– 222 – Table 7. Results of Independence Test Between Categories by Themes
Category Combination Statistics Coefficient
Chi-S L. R. M-H P. C. C. C. C. VX.
Scale of Houses/
Accessible Distance to Subway Station
26.9608 (0.0014)
28.9427 (0.0007)
0.7822
(0.3765) 0.3331 0.3160 0.1923
Scale of Houses/
Accessible Distance to Bus Stop
33.9930 (0.0001)
37.0949 (0.0001)
0.1230
(0.7258) 0.3740 0.3503 0.2159
Dwelling Area Scale /No. of Bus Routes
37.0727 (0.0001)
41.3492 (0.0001)
0.0629
(0.8020) 0.3906 0.3638 0.2762
Dwelling Area Scale /Geographical Location
82.3266 (0.0001)
85.1463 (0.0001)
9.7000
(0.0018) 0.5821 0.5030 0.3361
Accessible Distance to Subway Station/
Accessible Distance to Bus Stop
309.3041 (0.0001)
355.0742 (0.0001)
188.7764
(0.0001) 1.1282 0.7483 0.6514
Accessible Distance to Subway Station /No. of Bus Routes
61.6970 (0.0001)
69.8928 (0.0001)
14.9315
(0.0001) 0.5039 0.4500 0.3563
Accessible Distance to Subway Station /Geographical Location
167.7428 (0.0001)
198.6068 (0.0001)
6.7957
(0.0091) 0.8308 0.6391 0.4797
Accessible Distance to Bus Stop /No. of Bus Routes
99.5822 (0.0001)
122.4824 (0.0001)
51.2676
(0.0001) 0.6402 0.5391 0.4527
Accessible Distance to Bus Stop /Geographical Location
146.2495 (0.0001)
171.5593 (0.0001)
2.8856
(0.0894) 0.7758 0.6130 0.4479
No. of Bus Routes /Geographical Location
180.3256 (0.0001)
220.5966 (0.0001)
1.5439
(0.2140) 0.8614 0.6527 0.6091
Note) Chi-S : -statistic, L. R. : likelihood ratio -statistic, M-H : Mantel-Hanenszel -statistic, P. C. : Phi Coefficient C. C. : Contingency C. VX. : Coefficient Cramer’s V
Therefore, the number of each column and row etc. is applied to phi coefficient8), division coefficient9) and Cramer V10) R and C as a measurement of correlation among statistical theories for this.
As stated earlier, category groups by themes according to rough classification such as the residential scale of the project district, regional features of the project district, and the offering level of public transportation of the project district have complicated and various properties and behavior of the basic unit of the number of car possession between groups. Therefore, the criteria for independence test is α=0.1 (confidence level 90%) for significance level, and after judging whether there is similarity (independence) or not, it was decided to be applied as critical region that was effected for all of chi-squared, likelihood ratio, and Mantel-Hanenszel statistics.
4.4.3 Result of Significance Test of Categories by Themes If the result of independence test is looked into, it was analyzed that P-value, chi-s, likelihood ration, Mantel-Hansenszel (M-H) have all independence at α= 0.1 of significance level in terms of significance level of test statistic for independence between categories by themes overall11).
8) phi coefficient :
9) division coefficient :
10) Cramer V : m in
11) In the case of ‘Scale of Housing/Geographical Location’, 30% has
However, it was analyzed that only Mantel-Hansenszel (M-H) didn’t have independence at α= 0.1 of significance level in terms of significance level of test statistic for independence between categories by themes such as ‘scale of houses/accessible distance to a bus stop’, ‘scale of houses/No. of bus routes’, ‘No. of bus routes/geographical location’.
In conclusion, as stated earlier, since it was decided that only in the case that chi-squared (chi-s), likelihood ratio chi-squared (L.
R.), Mantel-Hansenszel (M-H) all don’t have independence at α=
0.1 of significance level, it would be rejected, all variables were to be used as explanatory variables for categories.
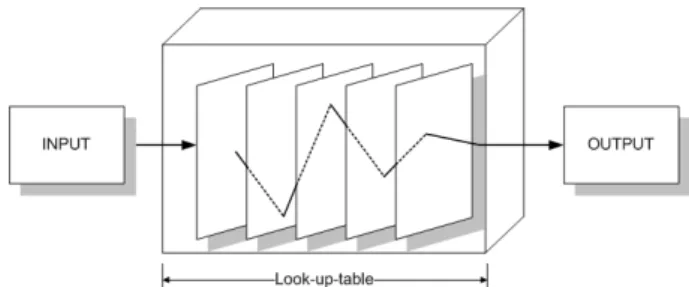
5. Development of Forecasting Model of the Basic Unit of the Number of Car Possession per Household 5.1 Introduction of Look-up Table
5.1.1 Appropriateness of Look-up Table Introduction It is necessary to define many kinds of factors able to explain the basic unit of the number of car ownership per household to estimate it.
expected frequencies less than 5, but if the number of data is sufficiently constructed in the future, it is judged that the problems of this would be solved.
Fig. 2 Basic Structure of Look-UP Table
In case of the existing forecasting models, the explanatory factors all have a measuring form or the work must be done to convert non-measuring factors into measuring ones. Therefore, a model is established in the state of considering errors that occur by putting lots of money and effort or measuring non-measuring factors to set up data proper for the model. Besides, even though the relationship with factors related with the number of car ownership or the demand of parking is not linear, the existing models develop a forecasting model through a multiple regression model using linear combination (in case of non-linear, linear combination through algebraic permutation), which frequently causes the reduction of reliability of a model. Therefore, the existing method to set up a model has somewhat difficulties for the estimated value to deal with the changes of conditions or data storage flexibly and actively in the future as well as reliability of a model.
In this study, a category that is represented as a explanatory factor for the basic unit of the number of car possession is made by combining measuring factors with non-measuring factors.
Therefore, unlike the existing method to set up a model, it is necessary to make a forecasting model able to satisfy both measuring factors and non-measuring factors. Moreover, it is required to construct a forecasting model of the basic unit of the number of car ownership and the reduction rate of owing cars that is able to cope with changes of data and conditions actively and easy to store data.
For this reason, as stated earlier, this study is to construct a forecasting model of the basic unit of the number of car possession per household using Look-up Table that is able to satisfy both measuring factors and non-measuring factors and easy to store data and to deal with changes of conditions actively.
5.1.2 Cases of Look-up Table Application
Generally, Look-up Table has been used with the aim to raise the speed of searching in computers and the fields related to data processing. However, it has been used for the classification of types considering the diversity and complexity of data in the fields related to the traffic.
Once the related literature are looked into, Korea Expressway Corporation (2000) established 6 categories by themes and classified them by using Look-up Table that combined them to
stereotype various features of each tollgate (business office) in the process of subdividing models of cars in the data of Expressway TCS. And the component ratio of subdivided car models according to the classified types was differentiated and established. Choi, Dae-Sik and a researcher (2009) estimated the internal flow-in ratio by types by using Look-up Table that stereotypes and combines various features of a project district by themes and to estimate the ratio that population moving in flows in from the inside of area of influence when developing the housing district. Besides, Kim, Tae-Gyun including two researchers (2010) suggested the guideline of the application types of system by project districts through categorizing functional features of each system and various features of a project district by each feature and through mixed use groups using Look-up Table for the introduction of system considering features of a project district in bringing in new traffic system at the large-scaled housing project district.
5.1.3 Understanding Look-up Table
Look-up Table is a method to estimate data that are wanted through database and to calculate the estimation by types by grouping each group mixed usely within categories by many kinds of various themes. Therefore, it’s easy to cope with actively the changes of data and of conditions in the case that data is continuously constructed. But, the reliability might rather fall due to the shortage of samples in the early stage of data construction.
Look-up Table is a method to estimate the wanted data through database, and this study was intended to estimate the basic unit of the number of car ownership necessary for the high-density mixed use development district in the future by constructing database with the basic unit of the number of car possession and the features of the project district focusing on the subject area of high-density mixed use subway area.
The estimation of the basic unit of the number of car ownership per household through Look-up Table comes to estimate the basic unit of the number of car possession per household for each case by combining categories by themes. Therefore, when estimating the basic unit of the number of car ownership per household in the high-density mixed use district to be constructed in the future, various features of the high-density mixed use district subway area for a subject are confirmed through the combination of categories, and the basic unit of the number of car ownership in the project district that is the subject of estimation is estimated through representative value12) of the basic unit of the number of car ownership per household of data by extracting data having the same features through database.
In this study, since a forecasting model of the basic unit of the number of car possession creates the combination of categories
12) There are many methods to estimate representative value but in this study, it was decided to use the arithmetical mean that is one of point estimation values.
– 224 –
Table 8. Example of Look-up-Table for Estimating the Basic Unit of the Number of Car Possession
No. Scale of
Houses
Accessible Distance to Subway
Accessible Distance to Bus
No. of Bus Routes
Geographical Location
Estimated Value of Basic Unit
1 1 1 1 1 1 0.84
2 1 1 1 1 2 0.89
3 1 1 1 1 3 0.86
4 1 1 1 1 4 0.87
5 1 1 1 1 5 0.81
6 1 1 1 2 1 0.82
⋮ ⋮ ⋮ ⋮ ⋮ ⋮ ⋮
960 4 4 4 3 5 1.07
through categories by 5 themes, if total number of cases that is judged as the pattern of the basic unit of the number of car ownership per household will be different is looked into, 960 cases (4×5×4×4×3) come to be estimated.
5.1.4 Compensation of Missing Value
It can be summarized into the following two methods that can be applied in case of using Look-up Table to estimate the basic unit of the number of car ownership per household when planning the project district.
First, it’s the case possible to estimate the features of the planned project district directly from the current database, and second, it’s the case that it’s in the combination of categories but there is no contents that correspond to the features in the current database.
In the first case, it’s easy to use since it would be fine if the corresponding contents from the combination of the current categories are applied. However, in the second case, it’s impossible to make a direct application since there are no similar contents in the current combination of categories.
In this case, the estimation value must be estimated through a new method. Therefore, in this study, the representative value13) by groups of each category was estimated, and it was decided to estimate the new final representative value by collecting these representative values by groups. It was decided to apply average for the new final representative value.
For example, if one group from the combination of categories were a missing value on the current data, there are 5 represent- ative values for groups of each category since 5 kinds of categories are provided in case of a forecasting model of the basic unit of the number of car possession. Therefore, if the represent- ative values by groups are 0.85, 0.95, 0.90, 0.97 and 0.83, the final representative value of the combination of categories is 0.90 that is the average of these values.
13) In terms of the representative value by groups, it was decided to use average of data pertaining to the group.
5.2 Model Evaluation Method
5.2.1 Introduction of Evaluation Method
It is essential to make conformity assessment that judges how much a model describes the measured value in order to secure the reliability of a model. The method that evaluates through the level of errors between the measured value and a model value is common in terms of a method for conformity assessment of a model.
In this study, it was intended to use RMSE (Root Mean Square Error) and Theil’s Inequality Coefficient14) for the evaluation method. RMSE (Root Mean Square Error) is a method for conformity assessment of a model through the level of distribu- tion in terms of errors between the measured value and a model value. Besides, Theil’s Inequality Coefficient stars on the basis of RMSE, and it’s possible to make a relative comparison since it provides a relative value, not an absolute value for the level of distribution of errors.
5.2.2 RMSE (Root Mean Square Error)
RMSE (Root Mean Square Error) is a method to distinguish the suitability of a model by the level of distribution of the average between the estimated value and the measured value.
It can be said that the less the value of RMSE is, the closer to the measured value it is, so it can be considered that the suitability of a model is high.
Where, : Estimated basic unit of the number of car possession of the high-density mixed use development district
: Actually measured basic unit of the number of car possession of the high-density mixed use development district
: Number of high-density mixed use development district
14) Theil, H. (1961), Economic Forecasts and Policy, 30~37
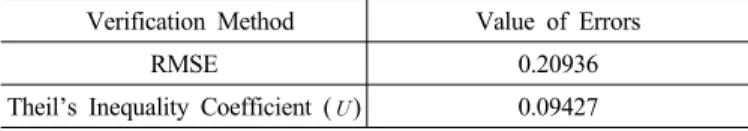
Table 9. Verification Result of Forecasting Model of the Basic Unit of the Number of Car Possession per Household
Verification Method Value of Errors RMSE 0.20936 Theil’s Inequality Coefficient () 0.09427
5.2.3 Theil’s inequality coefficient)
Theil’s Inequality Coefficient is defined by RMSE (Root Mean Square Error), and the value is expressed as U, and the features of U are as follows.
- U in Theil’s Inequality of Coefficient is related with RMSE.
- U value exists in ≦ ≦
- If U value is ‘0’, it’s the case that it is perfectly matched with the actually measured value, and if it’s ‘1’, it represents very different result from the actually measured value.
Therefore, as U value approaches to ‘0’, it can be said that the estimated value expresses the actually measured value well.
Theil’s Inequality Coefficient is defined as follows.
Where, : Estimated basic unit of the number of car possession of the high-density mixed use development district
: Actually measured basic unit of the number of car possession of the high-density mixed use development district
: Number of high-density mixed use development district
5.3 Verification Result of Model
The combination of categories was established on the basis of a field study of the area that is a subject of high-density mixed use subway area that was investigated in this study. As a result, total 55 cases of actual measurement came out for a forecasting model of the basic unit of the number of car ownership.
As a result, in the case of the forecasting model of the basic unit of the number of car possession, it was verified that the model has very high reliability as Theil’s Inequality Coefficient (U) was 0.09427, and RMSE was 0.20936.
6. Result
Seoul city makes an effort to minimize the traffic of cars according to the supply of apartment houses along with solution of housing shortage of low income people through high-density mixed use development of the subway area under the policy keynote of urban development focusing on public transportation (TOD). Therefore, more strict and powerful policy is necessary for suppression of the traffic in the case of high-density com- posite development district in the subway area and the supply of parking lot provided should also be limited in order to make
successful urban development focusing on public transportation.
Therefore, it is necessary to estimate the demand of cars with higher reliability to control the demand of parking in the high-density mixed use development district of the subway area that will be planned in the future.
Therefore, this study developed a forecasting model of the number of car ownership using Look-up-Table to deduce the estimation result that is easier to apply and has high reliability.
The estimation method using Look-up-Table has advantages that it is possible to be applied to both measuring and non-measuring, and easy to store data, and the estimated value flexibly responds to changes of condition. In addition, as data are accumulated more and more, the reliability of results of a forecasting model is getting higher, which can be said to be a big advantage. Therefore, as a result of establishing a forecasting model of the number of car possession of apartment houses using Look-up Table in the area that is the subject of high-density mixed use development district in the subway area, it was possible to construct a model with very high reliability.
Look-up-Table suggested through this study not only makes it possible to estimate the reliable demand of parking when planning parking lot of high-density mixed use district in the subway area, but also it is judged that it could be utilized for the construction of basic data in establishing the policy of parking. Therefore, if making arduous efforts in obtaining abundant data and in additional security of reliable factors, it is expected that it could be developed into an elaborate model with more reliable level.
References
1. The Korea Transport Institute (2005), Installation Standard of Parking Lot of National Rental Houses.
2. Kim, T. G., Jang, I. S., Lee, Y. H. (2010), “Analysis of Effect of Introduction of New Traffic System within Large-Scaled Housing Development District, Land & Housing Laboratory”, LHI Journal, 1(1): 113~124.
3. Ministry of Government Legislation(2010), Law of Parking Lot.
4. Ministry of Government Legislation(2010), Regulations on Standard of Housing etc.
5. Ahn, J. G., Kim, Y.(2005), “Standard of Supplying Parking of National Rental Houses”, Land Research , 47(0): 169~182.
6. Choi, D. S., Kim, T. G.(2009), “Study on Estimation of Internal Flow-in Ratio of Population Moving in of Housing Development Project District”, Seoul Urban Research, 10(1): 105~119.
– 226 – 7. Land & Housing Institute (2010), Development of Forecasting
Model of Demand of Parking of Reorganization Promoted District with High-Density mixed use Type in the Subway Area.
8. Korea Expressway Corporation (2000), Survey and Analysis for Construction of Forecasting Model of Amount of Traffic by Car Models from TCS Data.
9. Theil, H. (1961), Economic Forecasts and Policy, 30~37.