, 2006
( ) 3,029 (3,359,800 ),
682 (1,395,546 ),
247 (579,858 ), 113
(176,336 ) .
( )
J. Kor. Soc. Fish. Tech., 44(4), 273 281, 2008 DOI:10.3796/KSFT.2008.44.4.273
Size selectivity by alter the slope length and angle of coonstrip shrim (Pandalus hypsinotus Brandt) pot using in Hokkaido, Japan
Seong-Hun KIM*, Ju-Hee LEE1and Hyung-Seuk KIM1
Fisheries engineering Division, National Fisheries Research Development Institute, Busan 619-902, Korea
1Division of Marine Production System Management, Pukyong National University, Busan 608-737, Korea
In this study, the effect of slope length and angle at the entrance to fishing pots on the size of captured shrimp was examined to determine the optimal design of pots for use in Hokkaido, Japan. The purpose of the current study was to optimize the design of shrimp pots to allow greater control over the size of captured individuals for the purposes of shrimp resource management. Tank experiments were conducted to determine the optimal slope length and slope angle by analyzing the sizes of shrimp entering 10 model pots with combinations of five different slope lengths on slope angle of current shrimp pot, and five different angles on slope length of current shrimp pot. The results showed that, as the slope length of the pot increased, the size of individuals which entered the pot increased. In addition, as the slope angle was elevated in each of the five different slope angle treatments, the size of individuals entering was also increased.
Key words : Optimal design, Shrimp pot, Selectivity, Slope angle, Slope length
*Corresponding author: [email protected], Tel: 82-51-720-2584, Fax: 82-51-720-2586
, ( ) 97%
.
1 2
.
(Li, 2003).
Stasko, 1975; Koike et al., 1979, 1981; Yamane,
1995 ,
.
.
( )
( )
110cm, 36cm
13.8mm ,
4 (20mm 8mm, W
t) . Tetron
210d/18
, 34mm
34mm
(
) (Fig. 1).
2006 9 27 ,
2007 3 13
19 36mm , 1mm
13 234
. Fig. 2
.
(2m 2m 1m) ,
3.0 3.5 .
3 1 .
Fig.1. The current shrimp pot using in sawara area of Hokkaido, Japan.
240
160 85 plastic
Height 360
1100
Diameter Unit : mm
Slope length 440
Netting
Mesh size 34mm Slope angle55
2 3
, .
44cm, 55
.
55
24cm, 34cm, 44cm,
54cm 64cm 5
(Fig. 3(a)).
44cm ,
35 , 45 , 55 , 65 75 5 (Fig. 3( b)).
Fig.4
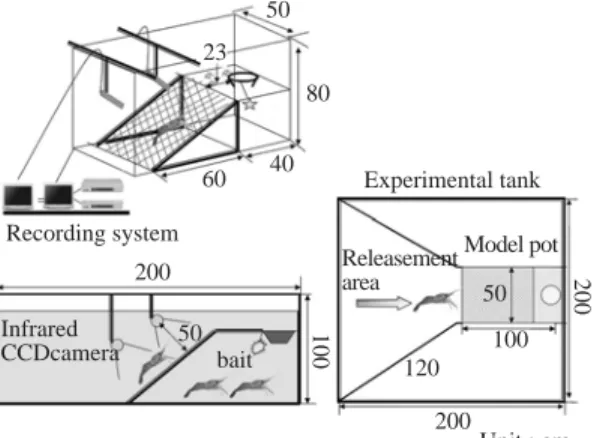
(2m 2m 1m) .
,
,
V .
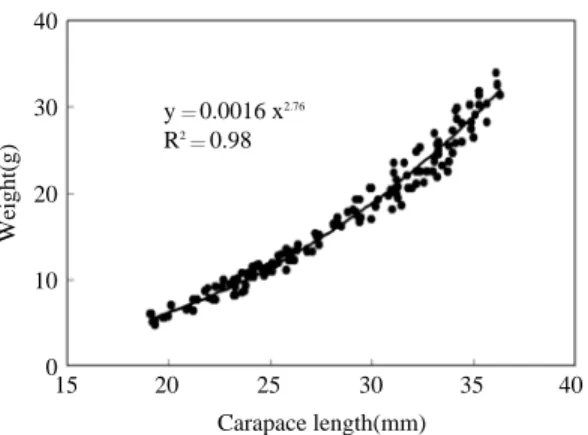
2 (TR 850WBP, Teistar) (CPD 17MS, Sony) Fig. 2. Relationship between carapace length and weight
of experimental individuals.
40
30
20
10
0
Weight(g)
Carapace length(mm) y 0.0016 x2.76
R2 0.98
15 20 25 30 35 40
Fig. 3. Schematic illustration of experimental pots used in selectivity experiments.
(a) the experimental pots with five different slope lengths.
(b) the experimental pots with five different slope angles.
,
(HV GR2, Aiwa) .
, 80 100m
.
.
1
. ,
,
24
. 24
, .
50g
, .
3 .
. Table 1
.
(1) ,
.
CE
φ ___________ (1)
CE CR
φ , CE , CR
. (2) Logistic
(Pope et al., 1975) .
exp(a bl)
S(l) _______________ , 0 S(l) 1 (2) 1 exp(a bl)
S(l)
. a b , l
.
(Maximum Likelihood) (Hiramatsu, 1992; Jeong et al., 2000;
Fujimori and Tokai, 2001).
N ,
n/N .
P,
1 P P
L(P) ,
L(P) NCnPn(1 P)N n (3)
. Fig. 4. Schematic illustration of experimental setup for
selectivity experiments in tank.
50
80
40
100 200
60
200 50
100 120
200Unit : cm 50
bait 23
Recording system
Releasement area
Model pot Experimental tank
Infrared CCDcamera
Table 1. The order to examine the shrimp on selectivity experiments
Item Slope length (cm) Slope angle( ) 34, 54, 24, 64, 44 55 Experiment(1) 34, 54, 24, 64, 44 55 34, 54, 24, 64, 44 55
44 35, 45, 55, 65, 75 Experiment(2) 44 75, 65, 55, 45, 35 44 55, 35, 65, 45, 75
1mm lk(k
1,2,3, , K) . K
. lk Plk
. k
lk P (3)
(4) .
exp(α βlk)
P(lk) _______________ , 0 P(lk) 1 (4) 1 exp(α βlk)
P(lk) k lk
, α β .
(3)
lk
Logistic α β
, (5) .
L(α, β) ∏k
k 1
NkCnk P(lk)nk[1 P(lk)]Nk nk (5) (5)
. 25%, 50%, 75% l25, l50, l75 (6) (8)
.
exp(α βl25) ln (3) α 0.25 _______________, l25 __________ (6)
1 exp(α βl25) β
exp(α βl50) α
0.50 _______________, l50 ___ (7) 1 exp(α βl50) β
exp(α βl75) ln (3) α 0.75 _______________, l25 _________ (8)
1 exp(α βl75) β
25mm
, 1
.
27mm (2.5 )
.
25mm(1 ) , 50%
l50
. (Selection Range, S.R)
.
(9) .
S.R l75 l25 2ln(3) / β (9)
55 ,
.
3 Table 2
. 24cm
, 64cm
25mm
. 25mm
, 30mm
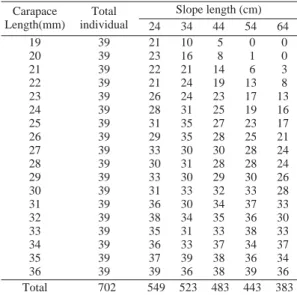
Table 2. Number of experimental individuals entered in the pots with slope angle 55 based on slope lengths
Carapace Length(mm)
Total individual 19
20 21 22 23 24 25 26 27 28 29 30 31 32 33 34 35 36
39 39 39 39 39 39 39 39 39 39 39 39 39 39 39 39 39 39
Slope length (cm)
24 34 44 54 64
21 23 22 21 26 28 31 29 33 30 33 31 36 38 35 36 37 39
10 16 21 24 24 31 35 35 30 31 30 33 30 34 31 33 39 36
5 8 14 19 23 25 27 28 30 28 29 32 34 35 33 37 38 38
0 1 6 13 17 19 23 25 28 28 30 33 37 36 38 34 36 39
0 0 3 8 13 16 17 21 24 24 26 28 33 30 33 37 34 36
Total 702 549 523 483 443 383
. ,
Fig.5 . Fig.5 ,
, 30mm
,
. 44cm
, l50 23.2mm ,
l50
25mm 56cm
(Fig.6(a)).
l50 ,
(Fig.6(b)).
44cm ,
. 3
Table 3 .
35 ,
, 25mm
Fig. 5. Comparison of the selectivity between each slope length.
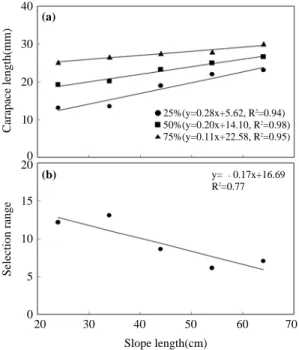
Fig. 6. 50% selection carapace length and selection range for experimental pot with five
different slope lengths.
(a) Relationship between slope length and carapace length, (b) Relationship between slope length and selection range.
1.0
0.8
0.6
0.4
0.2
0.00 10 20 30 40 50 60
Carapce length(mm)
24cm 34cm 44cm 54cm 64cm
Proportion of entered pot
40
30
20
10
200
15
10
5
020 30 40 50 60 70
Slope length(cm)
25%(y=0.28x+5.62, R2=0.94) 50%(y=0.20x+14.10, R2=0.98) 75%(y=0.11x+22.58, R2=0.95)
y= 0.17x+16.69 R2=0.77 (a)
(b)
Selection rangeCarapace length(mm)
Table 3. Number of experimental individuals entered in the pots with slope length 44cm based on slope angles
Carapace Length(mm)
Total individual 19
20 21 22 23 24 25 26 27 28 29 30 31 32 33 34 35 36
39 39 39 39 39 39 39 39 39 39 39 39 39 39 39 39 39 39
Slope length (cm)
35 45 55 65 75
16 15 23 19 24 27 31 29 31 33 32 34 35 37 36 34 37 38
12 18 16 19 23 25 27 25 26 30 27 29 33 32 35 38 38 37
8 15 12 18 19 23 24 28 26 29 27 32 31 34 32 35 37 39
7 10 14 17 18 18 20 25 22 28 27 26 28 29 33 34 34 35
4 6 6 9 13 16 19 23 21 22 25 28 29 31 36 35 37 38
Total 702 531 490 469 425 398
. 55
25mm .
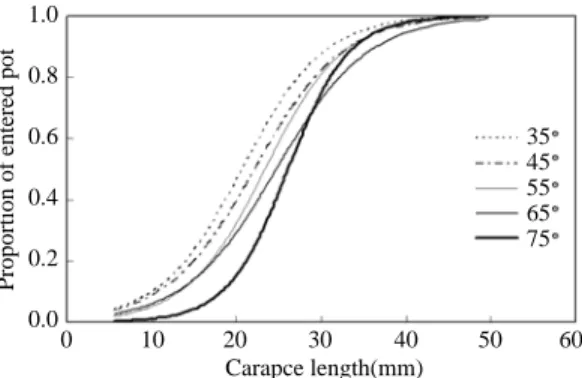
. 75
,
. 30mm
.
Fig.7 .
. , 25mm
67
. 55
, 23.4mm 1
(Fig.8(a)).
(Fig.8(b)).
. 1 ( 25mm )
,
50% (l50) 25mm
. ,
l50
25mm 56cm
.
12cm ,
. , l50 25mm
67 ,
12 .
. Fig. 8. 50% selection carapace length and selection range
for experimental pot with five different slope angles.
(a) Relationship between slope angle and carapace length, (b) Relationship between slope angle and selection range.
40
30
20
10
200
15
10
5
030 40 50 60 70 80
Slope angle( )
25%(y=0.16x+9.24, R2=0.94) 55%(y=0.13x+16.03, R2=0.99) 75%(y=0.11x+22.82, R2=0.87)
y= 0.05x+13.01 R2=0.26 (a)
(b)
Selection rangeCarapace length(mm)
Fig. 7. Comparison of the selectivity between each slope angle.
1.0
0.8
0.6
0.4
0.2
0.00 10 20 30 40 50 60
Carapce length(mm)
35 45 55 65 75
Proportion of entered pot
, ,
.
.
,
.
,
.
,
.
.
.
5
,
25mm 50%
,
, l50 25mm 56cm
12cm .
, l50
25mm 67
12 .
,
.
Fujimori, Y., and T. Tokai, 2001. Estimation of gillnet selectivity curve by maximum likelihood method.
Fisheries Sciences, 67, 644 654.
Hiramatsu, K., 1992. A statistical study of fish population dynamics using maximum likelihood method ? parameter estimation and model selection. Bull.
Natl. Inst. Far Seas Fish., 29, 57 114.
Jeong, E.C., C.D. Park, S.W. Park, and T. Tokai, 2000.
Size selectivity of trap for male red queen crab Chinoecetes japonicus with the extended SELECT model. Fisheries Sciences, 66, 494 501.
Koike, A., S. Takeuchi, M. Ogura, K. Kanda, S. Mitsugi and H. Ishidoya, 1979. Fundamental studies on the development of the deep sea fisheries resources by trap fishing I. The catch by the trap with difference constructions of trap. J. Tokyo Univ. Fish., 65, 173 188.
Koike, A., M. Ogura, S. Takeuchi, 1981. Catching efficiency of the double-framed pots for pink shrimp. Nippon Suisan Gakkaishi, 47, 457 461.
Li, Y., 2003. Studies on the optimum design of fish traps for catching arabesque greenling(pleurogrammus azonus) used in matsumae, Hokkaido. Ph.D. Thesis,
Hokkaido University, Japan. pp. 105.
Pope, J., A. Margetts, A. R., Hamley, J. M., Akyuz, E. F., 1975. Manual of methods for fish stock assessment.
Part . Selectivity of fishing gear. FAO Fisheries technical paper, Rev.1, pp. 46.
Stasko, A.B., 1975. Modified lobster traps for catching crabs and keeping lobster out. J. Fish. Res. Board.
Can., 32, 2515 2520.
Statistics and Information Department, Minister s Secretariat, the Ministry of Agriculture, Forestry and
Fisheries of Japan. 2006. Production Statistics Annual Report of Fisheries & Aquaculture. Association of Agriculture and Forestry Statistics, Tokyo, pp. 119.
Yamane, T., 1995 Effect of different funnel designs on the catching ability of small pots for prawns Macrobrachium nipponense. Fisheries Sciences, 61, 187 191.
2008 7 22
2008 9 8 1
2008 10 1