Ⅰ. Introduction
Linear accelerators(Linacs) are the most common treatment machines in radiation therapy. Radiation oncology centers are equipped with more than one
Linac, depending on the number of patients treated.
Depending on the situation, equal model Linacs from the same vendor are used in many centers. To facilitate the treatment workflow in unexpected situations such as sudden breakdown of any Linac or the increase in
<원저>
Evaluation of Beam-Matching Accuracy for 8 MV Photon Beam between the Same Model Linear Accelerator
Yon-Lae Kim
1)・Jin-Beom Chung
2)・Seong-Hee Kang
2)1)
Department of Radiologic Technology, Choonhae College of Health Science
2)
Department of Radiation Oncology, Seoul National Univ. Bundang Hospital
동일 기종 선형가속기간 8 MV 광자선에 대한 빔 매칭 정확도 평가
김연래
1)・정진범
2)・강성희
2)1)춘해보건대학교 방사선과・2)분당서울대학교병원 방사선종양학과
Abstract
This study aimed to assess of beam-matching accuracy for an 8 MV beam between the same model linear ac- celerators(Linac) commissioned over two years. Two models were got the customer acceptance procedure(CAP) criteria.
For commissioning data for beam-matched linacs, the percentage depth doses(PDDs), beam profiles, output factors, mul- ti-leaf collimator(MLC) leaf transmission factors, and the dosimetric leaf gap(DLG) were compared. In addition, the accu- racy of beam matching was verified at phantom and patient levels. At phantom level, the point doses specified in TG-53 and TG-119 were compared to evaluate the accuracy of beam modelling. At patient level, the dose volume histo- gram(DVH) parameters and the delivery accuracy are evaluated on volumetric modulated arc therapy(VMAT) plan for 40 patients that included 20 lung and 20 brain cases. Ionization depth curve and dose profiles obtained in CAP showed a good level for beam matching between both Linacs. The variations in commissioning beam data, such as PDDs, beam profiles, output factors, TF, and DLG were all less than 1%. For the treatment plans of brain tumor and lung cancer, the average and maximum differences in evaluated DVH parameters for the planning target volume(PTV) and the organs at risk(OARs) were within 0.30% and 1.30%. Furthermore, all gamma passing rates for both beam-matched Linacs were high- er than 98% for the 2%/2 ㎜ criteria and 99% for the 2%/3 ㎜ criteria. The overall variations in the beam data, as well as tests at phantom and patient levels remains all within the tolerance (1% difference) of clinical acceptability between beam-matched Linacs. Thus, we found an excellent dosimetric agreement to 8 MV beam characteristics for the same mod- el Linacs.
Key Words :
Percentage depth dose, Dose profile, Commissioning, Dose volume histogram, Delivery accuracy
중심 단어 :
심부선량백분율, 선량분포, 사용준비, 선량체적히스토그람, 전달 정확성
This research was supported by Choonhae College of Health Sciences and the National Research Foundation of Korea(NRF) grant funded by the Korea Government(Ministry of Science, ICT & Future Planning) (No. 2018R1D1A1B07049159, 2019017069)
Corresponding author: Seong-Hee Kang, Department of Radiation Oncology, Seoul National Univ. Bundang Hospital, 82, Gumi-ro 173beon-gil, Bundang-gu, Seongnam-si, Gyeonggi-do, 13620, Republic of Korea / Tel: +82-31-787-2918 / E-mail: kangsh012@gmail.com Received 30 March 2020; Revised 14 April 2020; Accepted 20 April 2020
Copyright ⓒ2020 by The Korean Journal of Radiological Science and Technology
patient load, two Vital Beam Linacs (Varian Medical Systems, Palo Alto, USA) are used in our center. These Linacs were sequentially installed and commissioned over two years. “Beam-matching” between these Linacs is performed to improve the treatment flexibility and efficiency during the customer acceptance procedure (CAP). Generally, beam-matching is a concept that includes tuning the beams of another unit with a reference Linac. Thus, beam-matching between Linacs can be represented by one set of beam parameters in treatment planning system(TPS)[1].
Many publication articles for beam matching were reported for various Linacs as well as the same model Linac[1-5]. These studies reported that the depth of the maximum dose along the central axis could be adjusted within 1.5 mm and that the difference in percentage depth dose(PDD) at 10 cm depth could be reduced to within 0.5% through Varian's fine-beam matching of the photon beam. However, most previous studies compared beam characteristics and evaluated beam matching accuracy for a 6 MV beam. To my knowledge, no studies have yet evaluated beam matching for an 8 MV beam of the same model Linacs.
Therefore, we aimed to evaluate the accuracy of beam matching in the same model of linear accelerator for 8 MV beam which is not mentioned much in the previous paper.
Ⅱ. Materials and methods
1. Beam matching producer
Two VitalBeam(VB) Linacs equipped with the Varian millennium 120 multi-leaf collimator(MLC) system were used in this study. Per vendor’s acceptance criteria, the second Linac(VB2) installed last year was beam-matched with the first Linac(VB1). To match treatment beams between both these Linacs, the beam matching criteria are based on depth ionization curves as well as in-line and cross-line profiles measured in the vendor-defined prescribed geometry. Scanning setup for measuring photon depth of ionization and
field profiles includes several requirements; 1) water surface must be at 100 ㎝ target skin distance(TSD), 2) the probe (0.13 cc volume) effective center must be accurately positioned. For photon depth of ionization, the depth of maximum intensity(Id
max) and the beam intensity at 10 ㎝ depth(Id
10) along the central axis for a 10 × 10 ㎠ field were measured in a water phantom using by Semi-Flex ionization chamber (IBA Dosimetry, Germany). For field flatness and symmetry, the radial and transverse profile field intensity, relative to central axis were measured at a depth of 10 ㎝ for 10
× 10 and 40 × 40 ㎠ fields and normalized to 100% in the 80% of the field width. The flatness was used the following equation
m ax
m in
m ax
m in× ,
where D
maxand D
minare maximum and minimum doses. Even if the measurements were within the vendor-defined criteria adjustments were made to improve the match between each accelerator and the first accelerator, chosen as a reference during the customer acceptance procedure(CAP).
2. Comparison of commissioning beam data For 8 MV beam, commissioning beam data such as percentage depth doses(PDDs), beam profiles, output factors, MLC leaf transmission factors, and dosimetric leaf gap(DLG), were measured with both Linacs. The PDDs and dose profiles were normalized prior to their further comparison. PDDs were normalized to their maximum, and dose profiles were normalized to the central axis value. The depth of maximum dose(d
max), 10 ㎝ and 20 ㎝ depths for PDDs for were compared for different field sizes ranging from 5 × 5 ㎠ to 30 ×30
㎠. The flatness and the symmetry of beam profiles
measured at d
maxand 10 ㎝ depths were compared for
five fields such as field size of 3 × 3, 5 × 5, 10 × 10,
20 × 20 and 30 × 30 ㎠. The output factor, transmission
factor(TF), and DLG were also compared. The output
factor was measured at a 10 ㎝ depth and a 100 ㎝
source-to-axis distance(SAD) for different field sizes
ranging from 3 × 3 ㎠ to 30 × 30 ㎠. The relative output factor, normalized to the value measured for a 10 × 10 ㎠ field was calculated. Per procedure offered by vendor[5], TF and DLG were measured at a blue water phantom.
3. Test of beam modelling in treatment planning system
To evaluate of beam modelling in TPS, measured commissioning beam data of both Linacs were fed into the Eclipse TPS. As recommended in the American Association of Physicists in Medicine Task Group 53 (AAPM TG-53)[6], the point dose variations between both Linacs were compared at different regions of interest (ROI) such as inner, outer, buildup, and penumbra regions, as shown in Fig. 1. For this, three different open field sizes of 3 × 3, 5 × 5, 10 × 10, and 25 × 25 ㎠ were placed in virtual water phantom and calculated with a fixed dose of 100 MU. In addition, modulated radiation therapy commissioning tests were performed and evaluated, as specified in TG-119[7, 8].
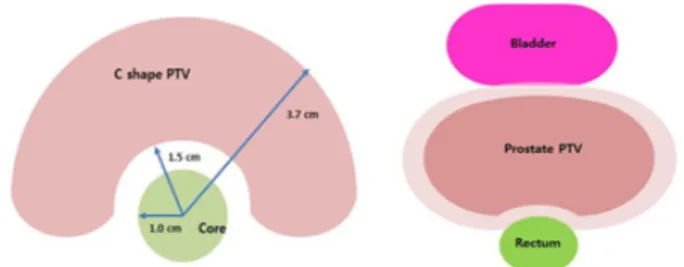
Doses of isocenter and 2.5 ㎝ posterior for PTV were compared on VMAT plan for mork prostate and C shape test case, as shown in Fig. 2. The variation of the specified points between both Linacs was analyzed.
4. Clinical VMAT planning and dose measurements This study was approved by the institutional review board (IRB approval number; B-2001-591-101). Forty patients, including 20 lung cancers and 20 brain tumors, who had been treated with the VB1 Linac at our institution were selected to evaluate treatment planning and beam delivery. All VMAT plans were generated with Eclipse TPS (version 13.7.16, Varian Medical System, Palo Alto, CA, USA) using a 8 MV beam. The optimization process was performed with a photon optimizer algorithm. All doses were calculated by using the Acuros XB(AXB) with heterogeneity correction and a dose calculation gird size of 2.5 ㎜. To compare dosimetric parameters for plans between beam-matched Linacs, we recalculated the parameters by changing only the Linac without re-optimization for the previous treatment plan. Based on the location of lung cancer and brain tumor, we accomplished the VMAT plans with 8 MV beam by using two partial arcs. The prescribed dose to the PTV was 66 Gy in 30 fractions for lung cancer and 60 Gy in 30 fractions for brain tumor. The dose was prescribed to 100% isodose and generally, the prescription dose encompassed ≥ 95% of the PTV, largely depending on the location and the proximity to critical organs. The OARs, such as lungs (ipsilateral and contralateral), spinal cord, esophagus and heart, were included.
In order to evaluate the difference in dosimetric parameters for the PTV and the OARs between two beam-matched Linacs, we calculated cumulative dose-volume histograms(DVHs) for each plan. For PTV, D
95%and D
5%, which represent the dose to 95% and 5%
of the volume, were analyzed. Furthermore, conformity index(CI), conformity number(CN), and homogeneity index(HI) were evaluated. For each OAR, the dosimeteric Fig. 1. Different four regions for 2 ㎝ away from the field edge
(outer) and 0.5 ㎝ outside each beam (penumbra) at 5 ㎝ depth (inner) and 1 ㎝ depth (build-up) on the central axis, as recommended in the TG-53
Fig. 2. Mock C-shape and prostate PTV, as specified in the TG-119
parameters included the maximum dose(D
max), the mean dose(D
mean), and a set of D
x%which is the maximum dose received by an x% volume of the organ. In the brain case, the Dmax for eyes, lenses optic chiasm, optic nerve, and brain stem and D
maxand D
meanfor both hippocampus were evaluated. The dosimetric parameters in the lung case were included D
mean, D
20%, and D
10%for the contralateral and the ipsilateral lung, and D
maxfor the spinal cord.
All VMAT plans performed patient-specific dosimetric quality assurance(DQA) by using the Electronic Portal Image Device(EPID, Varian PortalVision aS1200), which has the advantages of being integrated into most Linacs with sub-millimeter spatial resolution, linearity in the dose and the dose rate, and excellent dose measurement accuracy[9]. The planar doses using EPID were compared with those calculated using the TPS through absolute dose gamma evaluations using criterions of dose-difference(DD) and in distance-to- agreement(DTA) of 2%/3 ㎜ and 2%/2 ㎜. The passing rate of global-index was calculated for analyzing the delivery accuracy between both Linacs. For evaluation of the beam-matching for both Linacs, the portal dose image prediction(PDIP) plans generated by VB1 Linac are delivered on VB2 Linac through machine override without re-calculation, and the patient-specific QA results acquired by both Linacs were compared.
Ⅲ. Results
1. Accuracy of beam-matched data
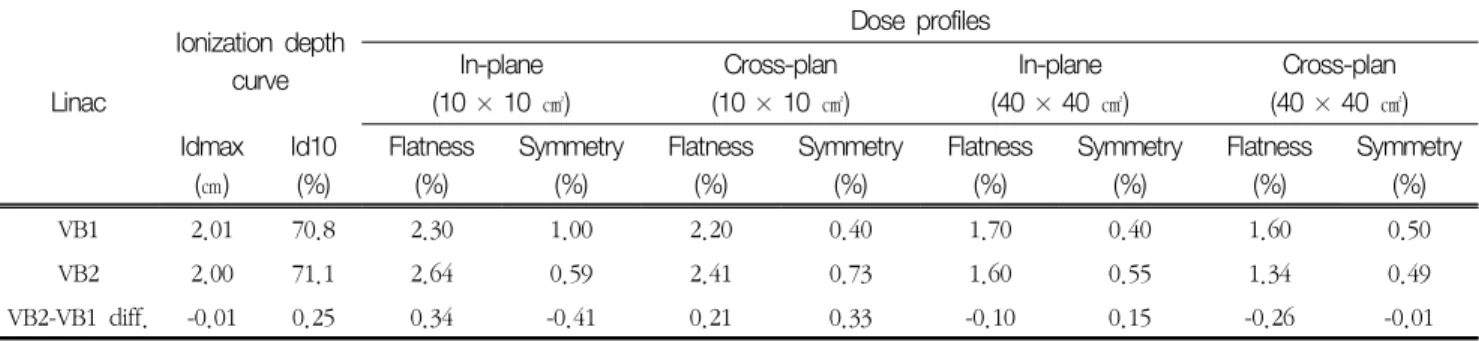
At CAP, the ionization curve and profiles of
in-plane and cross-plane measured with both VB Linacs were showed in Table 1. Difference of Id
maxand Id
10for ionization depth curve were -0.01 mm and 0.25%. All differences of flatness and symmetry for dose profiles were all within 0.5% for 10 × 10 ㎠ and 40 × 40 ㎠ fields. The maximum difference for dose profiles was -0.41% in symmetry of in-plane for a 10
× 10 ㎠ field size.
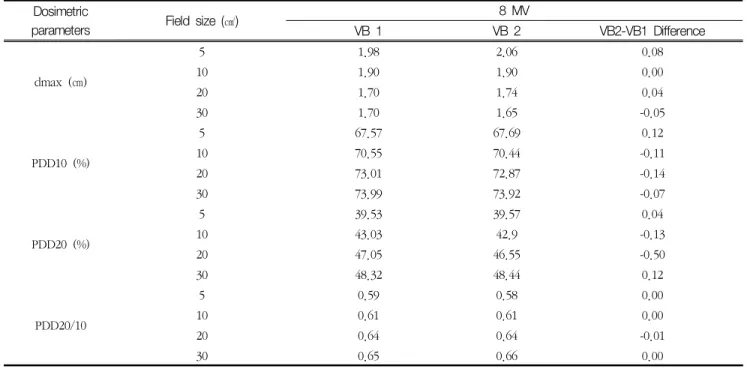
2. Difference of commissioning beam data The variations in commissioning beam data, such as PDDs, beam profiles, output factors, TF, and DLG are summarized in Tables 2-5. Differences of dosimetric parameters in PDDs for four field sizes were all within 1 ㎜ in d
maxand within 0.2%, except-0.5% in the 20 × 20 ㎠ field of PDD
20(percentage depth dose at 20 ㎝ depth). In addition, no differences in the PDD
20/10(the ratio of the percentage depth dose at 20 and 10 ㎝), which indicates the beam quality, were observed for both beam-matched Linacs. For flatness and symmetry of dose profiles at d
maxand 10 ㎝ depth for four field sizes, all differences between beam-matched units were less than -1.0%. T he maximum differences in flatness and symmetry were -0.61% at d
maxand -0.33% at 10 ㎝ depth for the 30 × 30 ㎠ field.
For output factors, percentage differences for all field sizes were all within 0.5%. The maximum difference was observed, as -0.46% for the 20 × 20 ㎠ field. Difference in the MLC transmission and the DLG was 0.06 ㎜ and 0.06%, respectively.
Table 1. Comparison of the ionization depth curves and dose profiles measured by both Linacs during CAP
Linac
Ionization depth curve
Dose profiles In-plane
(10 × 10 ㎠)
Cross-plan (10 × 10 ㎠)
In-plane (40 × 40 ㎠)
Cross-plan (40 × 40 ㎠) Idmax
(㎝)
Id10 (%)
Flatness (%)
Symmetry (%)
Flatness (%)
Symmetry (%)
Flatness (%)
Symmetry (%)
Flatness (%)
Symmetry (%)
VB1 2.01 70.8 2.30 1.00 2.20 0.40 1.70 0.40 1.60 0.50
VB2 2.00 71.1 2.64 0.59 2.41 0.73 1.60 0.55 1.34 0.49
VB2-VB1 diff. -0.01 0.25 0.34 -0.41 0.21 0.33 -0.10 0.15 -0.26 -0.01
CAP : customer acceptance procedure, VB : VitalBeam
Table 2. Comparison of the dosimetric parameters between beam-matched Linacs for four field sizes of 8 MV beam.
Dosimetric
parameters Field size (㎠) 8 MV
VB 1 VB 2 VB2-VB1 Difference
dmax (㎝)
5 1.98 2.06 0.08
10 1.90 1.90 0.00
20 1.70 1.74 0.04
30 1.70 1.65 -0.05
PDD10 (%)
5 67.57 67.69 0.12
10 70.55 70.44 -0.11
20 73.01 72.87 -0.14
30 73.99 73.92 -0.07
PDD20 (%)
5 39.53 39.57 0.04
10 43.03 42.9 -0.13
20 47.05 46.55 -0.50
30 48.32 48.44 0.12
PDD20/10
5 0.59 0.58 0.00
10 0.61 0.61 0.00
20 0.64 0.64 -0.01
30 0.65 0.66 0.00
dmax : the depth of maximum dose, PDD10, PDD20: the percentage depth doses at 10 and 20 ㎝, PDD20/10: the ratio of the percentage depth doses at 20 and 10 ㎝
Table 3. Differences in flatness and symmetry of dose profiles at d
maxand 10 ㎝ depth for four field sizes of 8 MV beams.
Dosimetric parameters
Field size (㎠)
8 MV VB2-VB1 Difference
VB 1 VB 2
Flatness(%) Symmetry(%) Flatness (%) Symmetry (%) Flatness (%) Symmetry (%)
3 3.66 0.15 3.60 0.18 -0.06 0.03
dmaz
10 0.79 0.18 0.91 0.34 0.12 0.16
20 1.35 0.41 1.01 0.24 -0.34 -0.17
30 2.72 0.45 2.11 0.56 -0.61 0.11
3 4.47 0.29 4.27 0.22 -0.20 -0.07
10 2.15 0.24 2.38 0.30 0.23 0.06
10 ㎝
20 1.44 0.17 1.71 0.22 0.27 0.05
30 1.16 0.58 1.39 0.28 0.23 -0.3
20 1.94 0.42 2.34 0.50 0.40 0.08
30 2.13 0.60 2.28 0.27 0.15 -0.33
dmax : the depth of ma ximum dose, VB : Vita lBea m
Table 4. Comparison in output factors between two beam-matched Linacs for different field sizes and two beam energies.
Field size (㎠) 8 MV VB2-VB1 Difference
(% Difference)
VB 1 VB 2
3 0.853 0.854 0.001 (0.12%)
6 0.935 0.935 0.000 (0.00%)
10 1.000 1.000 0.000 (0.00%)
15 1.052 1.048 -0.004 (-0.38%)
20 1.088 1.083 -0.005 (-0.46%)
30 1.136 1.131 -0.005 (-0.44%)
VB : VitalBeam
3. Accuracy of beam modelling in treatment planning system
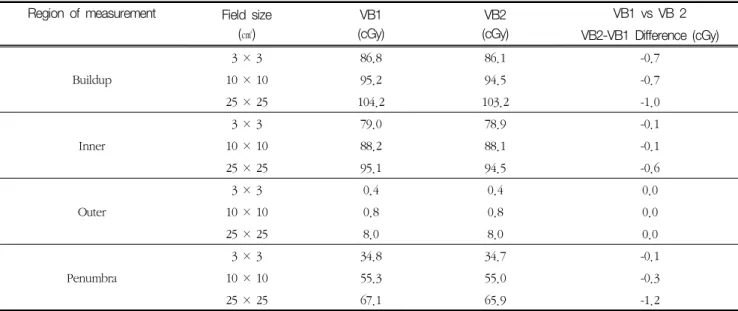
Differences of the specified point doses between both Linacs at phantom levels for TG-53 and TG-119 test shown in Tables 6-7. In TG-53 recommended test, all differences at four regions of interesting(ROIs) for three field sizes were less than 1.0 cGy, expect -1.0 and -1.2 cGy for buildup and penumbra region of a 25 × 25 ㎠ field. In addition, the differences and percentage differences at isocenter and 2.5 ㎝ posterior of PTV for prostate and C shape test were all within 1.2 cGy and 1.00%.
4. Dosimetric parameters and passing rates on VMAT plans
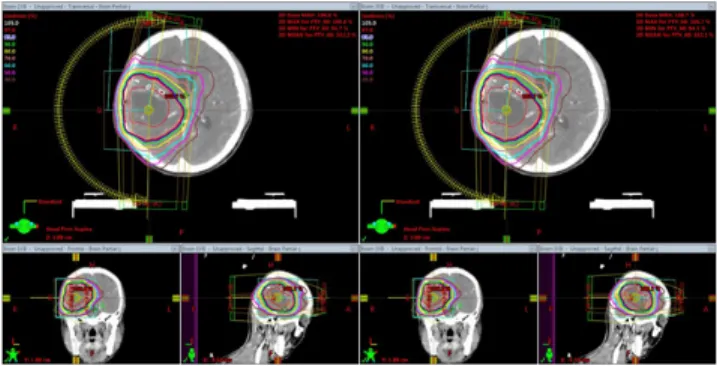
For the treatment plans of brain tumor and lung cancer for each patient using the same fluence and MU, summary data on the differences in evaluated DVH parameters for the PTV and the OARs between two beam-matched Linacs were recorded and are shown in Tables 8-9. Fig. 3 and 4 show the comparison of dose distribution and DVH in the brain VMAT plan using 8 MV beam on beam-matched Linacs for any patient.
For 20 lung VMAT plans, average differences of the Table 5. Differences in the dosimetric leaf gap and transmission factor of a multi-leaf collimator between two beam-matched Linacs.
Parameters 8 MV
VB 1 VB 2 VB2-VB1 Difference
DLG (㎜) 0.159 0.1646 0.0056
TF (%) 1.66 1.6 -0.06
DLC: dosimetric leaf gap, TF: transmission factor, VB : VitalBeam
Table 6. TG53 point dose and difference at four different regions for both VB Linacs.
Region of measurement Field size (㎠)
VB1 (cGy)
VB2 (cGy)
VB1 vs VB 2 VB2-VB1 Difference (cGy)
Buildup
3 × 3 86.8 86.1 -0.7
10 × 10 95.2 94.5 -0.7
25 × 25 104.2 103.2 -1.0
Inner
3 × 3 79.0 78.9 -0.1
10 × 10 88.2 88.1 -0.1
25 × 25 95.1 94.5 -0.6
Outer
3 × 3 0.4 0.4 0.0
10 × 10 0.8 0.8 0.0
25 × 25 8.0 8.0 0.0
Penumbra
3 × 3 34.8 34.7 -0.1
10 × 10 55.3 55.0 -0.3
25 × 25 67.1 65.9 -1.2
VB : VitalBeam
Table 7. Difference of TG119 point doses at different regions on volumetric modulated arc therapy technique for both VB Linacs.
Test case Technique Location VB1
(cGy)
VB2 (cGy)
VB2-VB1 Difference (cGy) (% Difference)
Prostate VMAT Isocenter 201.5 200.8 -0.7 (-0.19%)
2.5 ㎝ posterior 147.1 146.0 -1.1 (-0.66%)
C shape VMAT Isocenter 200.2 199.8 -0.4 (-0.20%)
2.5 ㎝ posterior 126.7 125.6 -0.6 (-0.86%)
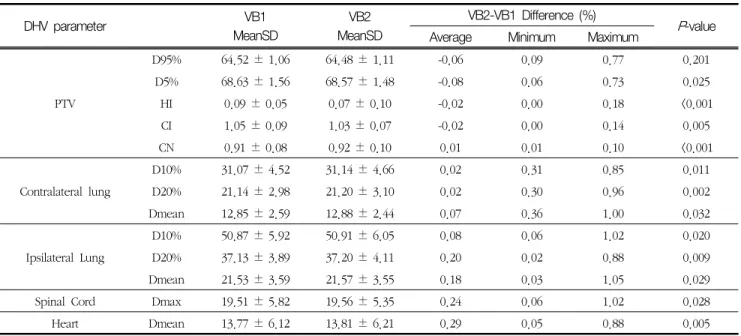
evaluated DVH parameters for PTV and OARs was all within 0.3% between beam-matched Linacs. The average differences in HI, CI, and CN which present the plan quality were all within 0.02%. The maximum differences were observed in Dmean of ipsilateral
lung, as –0.05%. The D95% and the D5% of the PTV were not statistically significant (P=0.201 and 0.090), respectively, but the other parameters for the OARs showed statistically significant low difference (P<0.05)
For 20 brain VMAT plans, no notable differences Table 8. Comparison of dosimetric parameters between VB1 (reference) and VB2 for 20 lung plans
DHV parameter VB1
MeanSD
VB2 MeanSD
VB2-VB1 Difference (%)
P-value
Average Minimum Maximum
PTV
D95% 64.52 ± 1.06 64.48 ± 1.11 -0.06 0.09 0.77 0.201
D5% 68.63 ± 1.56 68.57 ± 1.48 -0.08 0.06 0.73 0.025
HI 0.09 ± 0.05 0.07 ± 0.10 -0.02 0.00 0.18 <0.001
CI 1.05 ± 0.09 1.03 ± 0.07 -0.02 0.00 0.14 0.005
CN 0.91 ± 0.08 0.92 ± 0.10 0.01 0.01 0.10 <0.001
Contralateral lung
D10% 31.07 ± 4.52 31.14 ± 4.66 0.02 0.31 0.85 0.011
D20% 21.14 ± 2.98 21.20 ± 3.10 0.02 0.30 0.96 0.002
Dmean 12.85 ± 2.59 12.88 ± 2.44 0.07 0.36 1.00 0.032
Ipsilateral Lung
D10% 50.87 ± 5.92 50.91 ± 6.05 0.08 0.06 1.02 0.020
D20% 37.13 ± 3.89 37.20 ± 4.11 0.20 0.02 0.88 0.009
Dmean 21.53 ± 3.59 21.57 ± 3.55 0.18 0.03 1.05 0.029
Spinal Cord Dmax 19.51 ± 5.82 19.56 ± 5.35 0.24 0.06 1.02 0.028
Heart Dmean 13.77 ± 6.12 13.81 ± 6.21 0.29 0.05 0.88 0.005
VB : Vita lBea m, DVH : dose volume histogra m, PTV : pla nning ta rget volume
Table 9. Comparison of dosimetric parameters between VB1 (reference) and VB2 for 20 brain plans
DHV parameter VB1
Mean SD
VB2 Mean SD
VB2-VB1 Difference (%)
P-value
Average Minimum Maximum
PTV
D95% 60.55 ± 0.15 60.60 ± 0.22 0.08 0.00 0.31 0.139
D5% 62.31 ± 0.85 62.26 ± 0.95 -0.08 0.00 0.74 0.030
HI 0.11 ± 0.02 0.11 ± 0.03 -0.09 0.00 -1.02 <0.001
CI 1.09 ± 0.09 1.09 ± 0.07 -0.01 0.00 0.11 0.022
CN 0.93 ± 0.08 0.93 ± 0.10 -0.11 0.00 -0.33 0.043
LT Eye Dmax 24.48 ± 5.49 24.4 ± 3.55 -0.19 0.08 1.30 0.129
Dmean 19.18 ± 1.02 19.28 ± 1.05 0.21 0.01 0.62 0.011
RT Eye Dmax 27.46 ± 4.88 27.43 ± 4.92 -0.10 0.06 1.08 0.136
Dmean 10.75 ± 0.95 10.72 ± 1.04 -0.25 0.12 0.57 0.015
LT optic nerve Dmax 34.13 ± 1.53 34.11 ± 1.51 -0.09 0.09 0.62 0.022
RT optic nerve Dmax 34.62 ± 1.98 34.59 ± 1.95 -0.07 0.05 0.59 0.042
Optic chiasm Dmax 42.18 ± 2.02 42.13 ± 2.07 -0.12 0.10 0.89 0.015
Brainstem Dmax 42.18 ± 0.54 43.48 ± 0.59 -0.11 0.11 0.99 0.002
LT hippocampus Dmax 38.82 ± 0.39 38.79 ± 0.44 -0.06 0.02 0.64 0.025
Dmean 27.34 ± 0.54 27.29 ± 0.63 -0.05 0.05 1.13 0.018
RT hippocampus Dmax 32.02 ± 0.44 32.00 ± 0.59 -0.08 0.05 0.79 0.012
Dmean 22.08 ± 0.53 22.07 ± 0.63 -0.18 0.07 1.24 0.009
VB : Vita lBea m, DVH : dose volume histogram, PTV : planning ta rget volume
were observed in the dosimetric comparison and the DVH variation between beam-matched Linacs for any particular patient. All differences in the evaluated parameters for the PTV and all structures were within 1.0%, except Dmean for the right and left hippocampus (1.24% and 1.13%). The average difference was within 0.02% for the D95% of the PTV, and the D
maxfor left and right eye were not statistically significant (P=0.139, 0.129, and 0.136, respectively). On the other hand, the other parameters for PTV and all OAR were statistically significant as the P-values were all less
than 0.05.
For all lung and brain VMAT plans, the gamma passing rates of each plan delivered on beam-matched Linacs were acquired through comparing the dose calculated by using the TPS. Table 10 summarizes the average and the maximum differences in passing rates between the calculated and the measured planar doses for lung and brain VMAT plans through absolute dose gamma evaluations by using criterion of the 2%/2 mm and the 2%/3 mm. For the two beam-matched Linacs, all average passing rates of the EPID measurements were higher than 98% and 99% for the 2%/2 mm and the 2%/3 mm criteria. Average differences in the passing rates from two Linacs were all within 0.20%
for both treatment sites. The maximum difference was 1.82% in lung VMAT plan using the 2%/2 mm criterion.
The passing rates for both criteria had P-values more than 0.05 and were not statistically significant differences for both treatment sites, as shown in Table 10.
Ⅳ. Discussion
We have been tuned the 8 MV beam of the other Linac(VB2) with those of reference Linac(VB1) during CAP. Beam matching for ionization depth curve and dose profiles showed a good level as shown in Table 1. In commissioning beam data, the evaluated dosimetric beam data of beam-matched Linacs showed very similar dosimetric characteristics within 0.6% difference as shown in Tables 2-6. This illustrates that these beam matched Linacs can be represented by one set of beam parameters for 8 MV beam. Although a 6 MV beam, not Fig. 3. Comparison of the dose distributions for the axial,
sagittal, and coronal directions for brian VMAT plans using beam-matched Linacs.
Fig. 4. Comparison of the dose volume histograms(DVHs) in brain volumetric modulated arc therapy(VMAT) plans of any patient for beam-matched Linacs.
Table 10. Average and maximum difference in the passing rates between the calculated and the measured planar doses on each 20 volumetric modulated arc therapy plan for lung cancer and brain tumor.
Treatment sites Gamma criterion Gamma passing rate VB1 vs VB2 (Difference+SD)
Max
Difference P-value
VB1 VB2
Lung 2%/2 ㎜ 99.05% 99.21% 0.150.83% 1.82% 0.147
2%/3 ㎜ 99.55% 99.53% -0.020.39% 1.31% 0.066
Brain 2%/2 ㎜ 98.15% 98.35% 0.200.96% 1.75% 0.122
2%/3 ㎜ 99.25% 99.23% -0.020.55% 1.01% 0.083
VB : VitalBeam, DVH