옥수수의 파종시기 및 질소수준별 광화학적 반응 해석
박소현* ・ 유성영* ・ 이민주** ・ 박종용** ・ 송기태*** ・ 김태완**† ・ 이병무***†
*한경대학교 식물생태화학연구소, **한경대학교 식물생명환경과학과, ***동국대학교 바이오시스템대학 생명과학과
Photochemical Response Analysis on Different Seeding Date and Nitrogen (N) level for Maize ( Zea mays L.)
So-Hyun Park*, Sung-Yung Yoo*, Min-Ju Lee**, Jong-Yong Park**, Ki-tae Song***, Tae Wan Kim**†, and Byung-Moo Lee***†
*Institute of Ecological Phytochemistry, Hankyong National University, Ansung, 456-749, Korea
**Department of Plant Life and Environmental Science, Hankyong National University, Ansung, 456-749, Korea
***Department of Life Science, Dongguk University-Seoul, Seoul 100-715, Korea
1
†Corresponding author: (Phone) +82-10-8770-9145 (E-mail) [email protected] (Phone) +82-31-570-5080 (E-mail) [email protected]
<Received 5 November, 2014; Revised 5 January, 2015; Accepted 11 February, 2015>
한작지(Korean J. Crop Sci.), 60(1): 1~7(2015) DOI : http://dx.doi.org/10.7740/kjcs.2014.60.1.001
ABSTRACT The photochemical characteristics were analyzed in the context of sowing time and different levels of fertilized nitrogen during the maize (Zea mays L.) growth. When maize was early sawn, the fluorescence parameters related with electron- transport, in photosystem II (PSII) and PSI, were effectively enhanced with the higher level of fertilized nitrogen. Highest values were observed in maize leaves grown in double N- fertilized plot. The photochemical parameters were declined in the progress of growth stage. In early growth stage, the fluorescence parameters were highest, and then reduced to about half of the parameters related with electron transport on PSII and PSI at middle and late growth stages. In 1/2 N plot, the photochemical energy dissipation was measured to 13% in term of active reaction center per absorbed photon resulting in decrease in performance index and driving force of electron. This decrease induced to lower the photochemical effectiveness. In 2 N plots, the electron transport flux from QA to QB per cross section and the number of active PSII RCs per cross section were considerably enhanced. It was clearly indicated that the connectivity between photosynthetic PSII and PSI, i.e. electron transport, was far effective.
Keywords : Chlorophyll fluorescence, Maize, Nitrogen fertilization, Photochemical parameter
옥수수는 벼, 밀과 함께 세계 3대 식량작물의 하나로 광합
성 능력이 높은 C4 작물이며, 토양에 대한 적응성이 높아 널 리 이용되고 있다. 옥수수는 흡비력이 강하고 시비에 의한 효과가 커서 시비량과 시비방법에 따라 수량에 많은 차이가 있으므로 이를 해결하기 위하여 표준 시비량을 정하여 놓고 있다. 질소는 옥수수 곡물 수량 증대에 직접적으로 관여해 전세계적으로 옥수수 재배시 연간 1,000만톤의 질소(N)가 토양에 공급되고 있으며(FAO, 2004), 양분이 부족한 토양 에 질소를 투입하여 수량증대 효과를 보고 있다(Kariya et al., 1982). 그러나 옥수수의 시비에 있어 최적 시비량은 작 물의 생육에 미치는 영향을 진단하는 것을 통하여 직접 결 정하는 것이 바람직하다. 지금까지 작물의 영양상태를 확인 하는 방법은 주로 식물체 잎의 색을 이용하여 간접적으로 질소 영양 상태를 파악하는 표준차트 방법(Matsuzaki et al., 1982)과 Chlorophyll meter (Kariya et al., 1982; Katsumi, 1985; Peng et al., 1993) 측정법 및 잎의 Chlorophyll 함량 을 조사하는 방법 등이 보편적으로 이용되었다. Chlorophyll meter는 식물 잎의 엽록소 함량과 질소함량을 평가하는데 간편한 방법으로 비파괴적이고 휴대가 용이하며 사용이 쉽 고 빠르게 측정할 수 있는 특성으로 포장에서 생육하는 식 물의 영양진단을 위해 유용하게 사용되고 있다(Peng et al., 1995). Chlorophyll meter측정값은 식물의 태양광반사율과 밀접한 상관을 보이고 잎의 단위면적당 엽록소함량을 평가 하는데 적당한 방법이라고 하며, chlorophyll 값이 40을 넘 어 설 때 질소시용은 수량증대에 아무런 효과가 없다고 보 ISSN 2287-8432(Online)
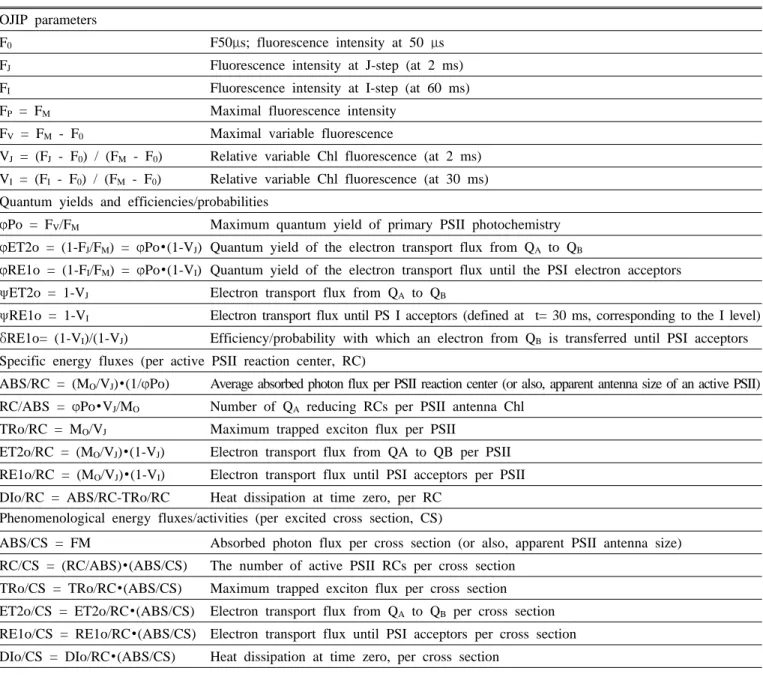
Table 1. Equations and definitions of OJIP parameters (Stirbet & Govindjee, 2011).
OJIP parameters
F0 F50μs; fluorescence intensity at 50 μs
FJ Fluorescence intensity at J-step (at 2 ms)
FI Fluorescence intensity at I-step (at 60 ms)
FP = FM Maximal fluorescence intensity
FV = FM - F0 Maximal variable fluorescence
VJ = (FJ - F0) / (FM - F0) Relative variable Chl fluorescence (at 2 ms) VI = (FI - F0) / (FM - F0) Relative variable Chl fluorescence (at 30 ms) Quantum yields and efficiencies/probabilities
φPo = FV/FM Maximum quantum yield of primary PSII photochemistry φET2o = (1-FJ/FM) = φPo∙(1-VJ) Quantum yield of the electron transport flux from QA to QB
φRE1o = (1-FI/FM) = φPo∙(1-VI) Quantum yield of the electron transport flux until the PSI electron acceptors ψET2o = 1-VJ Electron transport flux from QA to QB
ψRE1o = 1-VI Electron transport flux until PS I acceptors (defined at t= 30 ms, corresponding to the I level) δRE1o= (1-VI)/(1-VJ) Efficiency/probability with which an electron from QB is transferred until PSI acceptors Specific energy fluxes (per active PSII reaction center, RC)
ABS/RC = (MO/VJ)∙(1/φPo) Average absorbed photon flux per PSII reaction center (or also, apparent antenna size of an active PSII) RC/ABS = φPo∙VJ/MO Number of QA reducing RCs per PSII antenna Chl
TRo/RC = MO/VJ Maximum trapped exciton flux per PSII
ET2o/RC = (MO/VJ)∙(1-VJ) Electron transport flux from QA to QB per PSII RE1o/RC = (MO/VJ)∙(1-VI) Electron transport flux until PSI acceptors per PSII DIo/RC = ABS/RC-TRo/RC Heat dissipation at time zero, per RC
Phenomenological energy fluxes/activities (per excited cross section, CS)
ABS/CS = FM Absorbed photon flux per cross section (or also, apparent PSII antenna size) RC/CS = (RC/ABS)∙(ABS/CS) The number of active PSII RCs per cross section
TRo/CS = TRo/RC∙(ABS/CS) Maximum trapped exciton flux per cross section ET2o/CS = ET2o/RC∙(ABS/CS) Electron transport flux from QA to QB per cross section RE1o/CS = RE1o/RC∙(ABS/CS) Electron transport flux until PSI acceptors per cross section DIo/CS = DIo/RC∙(ABS/CS) Heat dissipation at time zero, per cross section
고하였다(Fred et al., 1991). 또한, 식물체내 엽록소 함량은 엽면적과 잎의 노화일수와 밀접한 상관을 보이며, 출사기의 엽록소 함량은 파종기가 늦을수록 낮다고 보고되었다(Son et al., 2006a; Son et al., 2006b). 최근 비파괴적 분석법 중 하나인 엽록소 형광반응을 측정하여 광화학적 해석을 통한 작물의 광생리 지표 연구가 활발히 진행 중이며 여러 가지 변수들을 측정하는 기술로서 이용 가능성이 높게 평가되고 있다(Oukarroum et al., 2007; Caclatayud et al., 2006; Yoo et al., 2012, 2014). 엽록소 형광현상은 빛에 노출된 엽록소 가 15분이상의 암기간을 거치게 되면 다시 원상태의 형광현 상이 나타날 수 있는 상태로 복귀하는 것으로 알려져 왔다
(Starsser, 1985; Srivastava et al., 1995).
한편, 암상태를 거친 식물의 광합성 과정은 대부분의 광 합성계 II 반응중심(Photosystem II reaction center, PSII RC)의 전자수용체가 대부분 산화상태로 존재하게 되며, 이 런 상태에서 엽록소 형광은 최소값(Fo)을 나타내게 된다. 엽 록소 형광반응의 O-J-I-P전이과정은 2 ms이내의 엽록소 형 광현상으로 아주 빠른 반응과 열의존적인 전이를 수치로 계 량화하여 각각의 phase를 정량화 한 것이다(Paqageorgiou and Govindjee, 2004). 이때, O 상태에서 J 상태로의 전자 여기는 광화학 전이(photochemical phase)로 알려진 2 ms 이내의 대단히 빠른 반응이고, 빛의 세기에 비례하여 여기
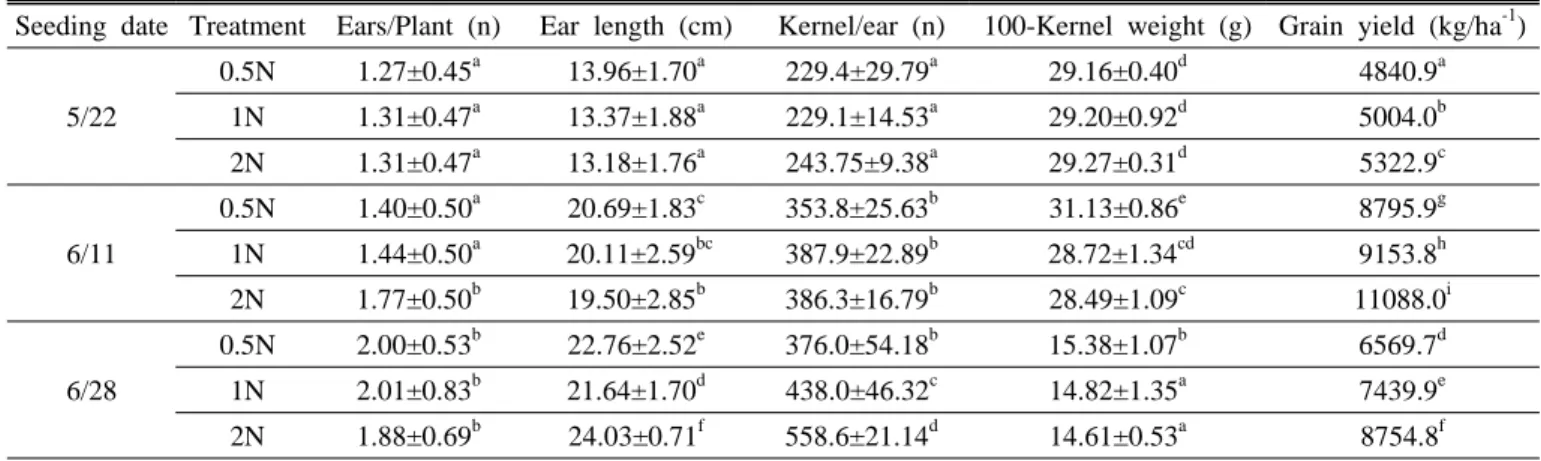
Table 2. Effects of seeding date and N-level on growth characteristics in maize.
Seeding date Treatment Ears/Plant (n) Ear length (cm) Kernel/ear (n) 100-Kernel weight (g) Grain yield (kg/ha-1)
5/22
0.5N 1.27±0.45a 13.96±1.70a 229.4±29.79a 29.16±0.40d 4840.9a
1N 1.31±0.47a 13.37±1.88a 229.1±14.53a 29.20±0.92d 5004.0b
2N 1.31±0.47a 13.18±1.76a 243.75±9.38a 29.27±0.31d 5322.9c
6/11
0.5N 1.40±0.50a 20.69±1.83c 353.8±25.63b 31.13±0.86e 8795.9g
1N 1.44±0.50a 20.11±2.59bc 387.9±22.89b 28.72±1.34cd 9153.8h
2N 1.77±0.50b 19.50±2.85b 386.3±16.79b 28.49±1.09c 11088.0i
6/28
0.5N 2.00±0.53b 22.76±2.52e 376.0±54.18b 15.38±1.07b 6569.7d
1N 2.01±0.83b 21.64±1.70d 438.0±46.32c 14.82±1.35a 7439.9e
2N 1.88±0.69b 24.03±0.71f 558.6±21.14d 14.61±0.53a 8754.8f
Mean values with the same superscript letters in the same line, do not differ statistically (Duncan test, p ≤ 0.05) 하는 전자가 증가하는 것으로 알려져 있다. 반면에 J→I전
이와 I→P전이는 열 의존적 전이(thermal phase)로 상대적으 로 상당히 느린 반응으로 알려져 있다(Morin, 1964; Delosme, 1967). 이때 OJIP 전이과정은 PSⅡ 광화학적 양자 수득률 의 포텐셜과 전자전달 능력을 좌우하며, 각 전이단계 (O-J-I-P)의 엽록소 형광량에 근거하여 광화학 기구간 전자 전달 효율 및 식물의 건전성 예측이 가능하여 많은 연구가 시도되고 있다.
본 연구는 엽록소형광분석(OJIP) 기술을 이용해 옥수수 파종시기 및 질소수준에 의한 옥수수의 광화학적 반응 분석 을 통해 생리적 특성 해석 및 옥수수 건전생장 관련 연구를 수행하였다.
재료 및 방법
공시재료 및 재배방법
본 연구는 경기도 고양시에 위치한 동국대학교 부속농장 에서 2013년 5월부터 10월까지 파종시기 및 질소수준별 옥 수수(광평옥) 재배시험을 실시하였다. 광평옥의 파종시기별 및 질소 수준별 광생리적 특성을 알아보기 위해 5 월 22일, 6월 11일, 6월 28일에 각각 파종하였고, 농촌진흥청 표준시 비량(N-P-K : 17.4-3.0-6.9 kg/10a)에 따라 질소 표준량(17.4 kg/10a), 반량(8.7 kg/10a), 배량(38.4 kg/10a)으로 처리하여 재배하였다
광화학반응(OJIP) 분석
엽록소 형광반응 측정 시기는 파종일로부터 각각 40일 이후 20일 간격으로 3회 측정하였다. 엽록소 형광반응 측정 은 Fluorpen FP-100 (PSI, Czech)을 이용하여 Leaf clip을
이용해 옥수수 상위 세번째 잎에 30분 암처리 후 OJIP를 측 정하였다. 측정된 데이터는 Stirbet and Govindjee (2011)의 방법에 의해 JIP-Test를 하였다(Table 1).
통계분석
실험결과는 SAS (Statistic Analysis System, 9.02 Version) Program을 이용하여 분석하였다. 통계 package를 사용하여 평균을 구한 다음 분산분석(ANOVA) 및 Duncan의 다중검 정(Duncan’s multiple range test)으로 유의성을 분석하였다.
결과 및 고찰
파종 시기 및 질소수준별 옥수수 생육 비교
Coelho and Dale (1988)은 옥수수의 생장과 발달을 예측 하기 위한 수단으로서 파종에서 출사까지 기간을 아는 것은 매우 중요하며, 이는 파종기에 따른 출사기가 상대숙기를 결정하기 때문이라고 보고되었다. 본 연구의 옥수수 파종시 기별 10a당 곡물생산량은 6월11일 파종시 가장 높았으며, 5 월22일 파종한 경우 낮은 곡물생산량을 보였다. 그리고 질 소시비에 의한 수량 또한 6월 11일 파종의 경우 질소 배량 처리에서 표준량 보다 21% 증수효과가 있었다. 또한 Son et al. (2010)은 4월 15일, 5월 11일, 6월 5일 각각 파종하여 수확한 조생종, 중생종은 파종시기가 늦어질수록 초장 및 착수고가 낮아지고 경의 굵기가 가늘어지는 경향을 보였다 고 보고되었다. 그러나 본 연구의 광평옥은 6월 중순이 파 종적기인 중만생종으로서 5월 22일 파종시 적은 강수량으 로 인한 한발 피해와 6월 28일 파종한 옥수수의 출수기(8월 하순~9월 하순)의 높은 강수량(218mm) 등 불리한 기상 조 건으로 인해 수량이 감소한 것으로 생각되었다.
Seeding date G1 G2 G3
5.22
6.11
6.28
Fig. 1. Typical Chl a polyphasic fluorescence rise O-J-I-P for different growth stages in maize The transient is plotted on a logarithmic time scale from 50 ㎲ to 1 s. The signals are : the fluorescence intensity Fo(at 50 ㎲); the fluorescence intensity FJ(at 2 ms) and FI(at 30 ms); the maximal fluorescence intensity, Fp=FM (Blue line : N, Red line 0.5N, Green line : 2N). 40 days after seeding(G1), 60 days after seeding(G2), 80 days after seeding(G3).
옥수수의 엽록소 형광반응(OJIP) 비교
파종시기 및 질소 수준별 옥수수의 엽록소 형광반응을 생 육 시기별로 비교하였다(Fig. 1). 질소 표준시비(N), 반량 (0.5N) 및 배량(2N) 처리구에서 파종 후 40일(G1)의 O-J 전 이단계가 크게 증가했으며, 표준량 및 반량구는 파종 후 80 일(G3)의 형광량이 감소했으나, 배량구에서는 큰 차이가 없 는 것으로 나타났다. 5월 22일 파종시 질소 배량 처리구는 파종 후 40일(G1)에서 80일(G3)까지 엽록소 형광량이 유지 되었으나, 표준량 및 반량구는 파종 후 80일의 엽록소 형광 량이 감소하는 것으로 나타났다. 특히 파종 후 60일(G2) 반 량구 옥수수는 형광유도 과정 중 초기 광화학 반응인 O-J 전이단계(2ms 이내)에서 증가하였으며, 산소발생복합체 또 는 광계 II 에너지 연계성과 관련한 광합성 기구의 활성이 감소하여 나타난 것으로 판단되었다. 6월 28일 파종 시 생 육 초·중기 질소 수준별 엽록소 형광량은 비슷한 양상을 보 였으며, 생육후기 배량구에서는 O-J-I-P 전이가 비교적 잘 이루어졌으나, 질소표준시비 및 반량 처리구에서 O-J, J-I 전이단계의 엽록소 형광반응 변화가 극히 적었다. 또한 생
육중기 이후 모든 처리구에서 엽록소 형광량이 50% 가량 감소하여 전자전달을 위한 광화학 반응이 크게 감소했음을 알 수 있었다. 특히 생육중기 J-I 전이가 잘 이루어지지 않 는 것으로 나타났으며, 이는 J-I 전이과정 중 대부분의 에너 지가 열로 소산되었을 것으로 판단되었다. Sinclair and Horie (1989)는 벼와 콩, 옥수수에서 잎 질소함량과 CO2 동화율 은 고도의 상관을 보였으므로 이런 관계는 작물에서 광이용 효율을 평가 하는데 사용된다고 보고하였으며, 잎에 공급하 는 질소의 비율은 작물의 건물축적량을 최대화하는 최적의 엽신 질소함량으로 정해진다고 하여 질소 영양진단의 중요 성을 밝힌바 있으며, 본 연구의 O-J-I-P 전이는 광이용 효율 을 판단할 수 있는 근거로 제시할 수 있다.
옥수수의 광화학적 생리지표
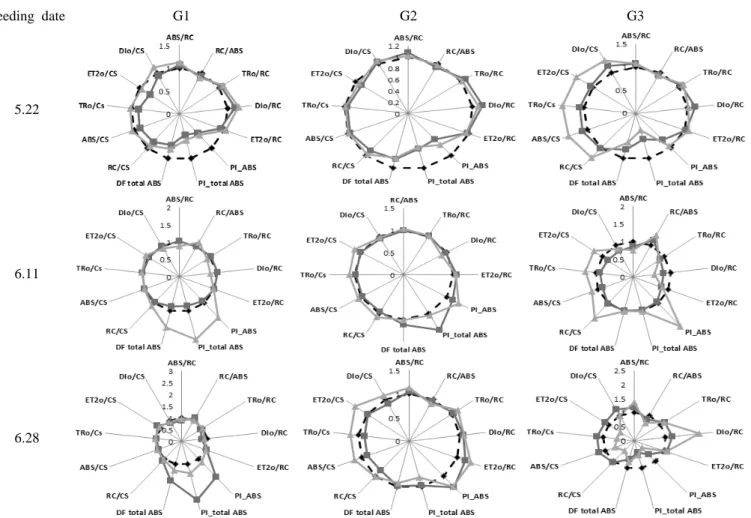
옥수수 잎의 파종시기별PSII RC 및 단면당 광이용 효율 을 분석한 결과(Fig. 2) 5월 22일 파종 시 질소 반량구에서 전 생육기간 동안 활성화된 반응중심 즉, QA의 환원된 수 (RC/ABS, RC/CS)가 질소 표준량 보다 더 낮게 나타났다.
Seeding date G1 G2 G3
5.22
6.11
6.28
Fig. 2. The comparison of photon yield and electron transport efficiency for different growth stages in maize (Blue line : N, Red line 0.5N, Green line : 2N); 40 days after seeding(G1), 60 days after seeding(G2), 80 days after seeding(G3).
또한, 질소 표준량 처리구는 파종 후 60일(G2)의 광이용 효 율이 가장 높았으며, 배량구는 전 생육기의 광이용 효율 변 화가 크지 않는 것으로 확인되었다. 6월 11일 파종한 질소 반량구에서 파종 후 40일(G1)의 광이용 효율이 가장 낮았 으며, 광계 I (PS I)의 전자전달시 에너지 전환 효율(PI, DF) 가 7~14% 감소하는 것으로 나타났다. 6월28일 파종한 옥 수수는 생육 중기 및 생육 후기로 진행될수록 광화학 반응 과정 중 에너지 소실(DIo/RC, DIo/CS)이 크게 증가해 광이 용 효율이 감소하는 것으로 나타났다. 특히, 질소 반량구에 서 광계 II 반응중심(PS II RC)당 광이용 효율 및 단면(CS) 당 QA의 환원된 수는 표준량 대비 평균 92% 수준인 것으로 나타났으며, 활성화된 반응중심(RC/ABS)의 감소로 인한 에너지 소실로 이어져 결국 전자전달 시 에너지 전환효율 (PI, DF 등)이 감소한 것으로 판단되었다. 이와 같이 옥수수 의 질소부족은 영양생장과 생식생장을 지연시키며, 광합성 을 저해시켜 이삭이 달리지 않게 하거나 이삭 상부에 달린
립(粒)이 등숙되지 않게 하고 입수와 입중을 감소시켜 수량 감소를 초래하며 단백질 함량을 저하시킨다고 보고되어있다 (Sergio and Fernando, 1995a; Sergio and Fernando, 1995b).
본 연구의 질소 배량구에서 파종 후60일 이후 전자전달 에 너지 플럭스(ET2o/CS) 및 단면당 활성화된 RC (RC/CS) 등 광이용 효율이 표준량 보다 크게 증가하여 광합성기구 사이 의 전자전달이 잘 이루어지는 것으로 확인되었다. 특히, 질 소 배량 처리시 Performance index (PI) 즉 광계 II (PS II)에 의해 흡수된 광자와 광계 내부의 전자수용체의 환원 및 광 계 I (PS I)의 최종 전자수용체가 환원 때까지의 에너지 전 환을 의미(Stirbet and Govindjee, 2011)하는 성능지수가 증 가함을 확인하였다. 일반적으로 옥수수의 질소흡수는 출사 기에도 빠르게 진행되어 성숙기까지 계속되고, 질소 시비량 의 증가에 따라 지상부의 질소 흡수량이나 질소함량, 질소 이용효율이 직선적으로 증가하는 경향을 보인다고(Kang et al., 1986)보고 되었다. 옥수수의 생육 단계별 광계 I (PS I)
의 최종 전자수용체가 환원 때까지의 에너지 전환(PI) 효율 은 파종 후 60일(G2)에 평균17.1로 가장 높았고, 80일(G3) 후 및 40일(G1) 후 순이었다. 따라서 광평옥은 6월 중순에 파종하면 기상재해(한발 등)을 피하고, 생식생장기(G2, G3) 의 높은 광이용 효율을 통한 수량 증대에 효과적일 것으로 사료되었다.
적 요
본 연구는 파종시기와 질소시비 수준에 대한 옥수수의 광 화학적 반응을 분석하여 광생리적 특성을 해석하였다.
1. 5월 22일 파종시 질소 함량이 증가함에 따라 생육후기 까지 엽록소 형광량 또한 증가하여 질소 배량처리에서 광이용효율이 더 높은 것으로 확인되었다.
2. 생육초기의 형광량이 가장 높았으며, 이후 모든 처리 구에서 엽록소 형광량이 50% 가량 감소하여 전자전달 을 위한 광화학 반응이 크게 감소했음을 알 수 있었다.
3. 질소 반량구에서 활성화된 RC (RC/ABS)가 감소하며 13% 이상의 에너지가 손실되었으며, 결국 전자전달시 에너지 전환효율(PI, DF 등)이 감소해 광이용효율이 낮았다.
4. 배량 처리구는 생육후기로 갈수록 전자전달 효율(ET2o/CS) 및 단면당 활성화된 RC(RC/CS) 등 광이용 효율이 대 조구 대비 크게 증가하여 광합성기구 사이의 전자전달 이 잘 이루어지는 것으로 확인되었다.
사 사
본 논문은 농촌진흥청 연구사업(과제번호: PJ009243)”옥 수수 안정생산을 위한 한발 피해 해석 및 경감기술개발연 구”의 지원에 의해 이루어진 것임.
인용문헌(REFERENCES)
Calatayud, A., D. Roca., and P. F. Martinez. 2006. Spatial- temporal variations in rose leaves under water stress conditions studied by chlorophyll fluorescence imaging. Plant Physiology and Biochemistry. 44(10) : 564-573.
Coelho, D. T. and R. F. Dale. 1988. An energy crop growth variable and temperature function for paradicting corn growth to silking. Agron. J. 72 : 503-510.
Delosme, R. 1967. Etude de l’induction de fluorescence des alguesverteset des chloroplastes au debut d’une illumination
intense. Biochim. Biophys. Acta. 143 : 108-128.
FAO. 2004. The state of world fisheries and aquaculture (SOFIA) 2004. Food and Agriculture Organization, Rome, Italy.
Fred, T. and F. Michael. 1991. Chlorophyll meter to predict nitrogen top dress requirement for semidwarf rice. Agron. J. 83 : 926-928.
Kang, J. H., H. J. Lee., and B. H. Park. 1986. Effects of Nitrogen level and plant population on agronomic characteristics and yield I silage corn. Journal of the Korean Society of Grassland and Forage Science. 6(1) : 44-48.
Kariya, K., M. Akio., M. Hiroyasu., and T. Kosei. 1982. Distribution of chlorophyll content in leaf blade of rice Plant. Japan. Jour.
Crop Sci. 51(1) : 134-135.
Kariz, A. L. and B. A. Larkins. 2009. Molecular genetic approaches to maize improvement biotechnology in agriculture and forestry (eds.). 63.
Katsumi, I. 1985. Spectral ratio of reflectance for estimating ch- lorophyll content of leaf. Japan Jour. Crop Sci. 54(3) : 661-265.
Matsuzaki, A., K. Kunio., M. Hiroyasu., and T. Kosei. 1982. Studies on the growth control and the nutritional diagnosis in rice plants.
III. Growth diagnosis at the stage of spikelet initiation for nitrogen top dressing. Japan. Jour. Crop Sci. 51(3) : 325-331.
Morin, P. 1964. Etudes des cinetiques de fluorescence de la chlorophylle in vivo, dans les premiers instants qui suivent le debut de l’illumination. J. Chim. Phys. 61 : 674-680.
Oukarroum, A., S. E. Madidi., G. Schansker., and R. J. Strasser.
2007. Probing the responses of barley cultivars (Hordeum vulgare L.) by chlorophyll a fluorescence OLKJIP under drought stress and re-watering. Envi & Exp. Bot. 60 : 438-446.
Papageorgiou, G. C. and Govindjee. 2004. Chlorophyll a fluore- scence a signature of photosynthesis. (Eds.) Advances in photo- synthesis and respiration, Springer, Dordrecht, The Netherlands.
19 : 818
Peng, S., V. Felipe., C. Rebeacca., and G. Kenneth. 1993. Adjustment for specific leaf weight improves chlorophyll meter’s estimate of rice leaf nitrogen concentration. Agron. J. 85 : 987-990.
Peng, S., G. Kenneth., and J. Martin. 1995. Relationship between leaf photosynthesis and nitrogen content of field-grown rice in tropics. Crop Sci. 35 : 1627-1630.
Sergio, A. U. and H. A. Fernando. 1995a. Nitrogen deficiency in Maize : I. Effects on crops growth, development, dry matter partitioning, and kernel set. Crop Sci. 35 : 1376-1383.
Sergio, A. U. and H. A. Fernando. 1995b. Nitrogen deficiency in Maize :II. Carbon-nitrogen interaction effects on kernel number and grain yield. Crop Sci. 35 : 1384-1389.
Sinclair, T. R. and T. Horie. 1989. Leaf nitrogen, photosynthesis, and crop radiation use effieiency : A review. Crop Sci. 29 : 90-98.
Son, B. Y., H. G. Moon., T. W. Jung., S. J. Kim., B. R. Sung., C.
S. Huh., and S. H. Ryu. 2006a. A new corn hybrid cultivar,
“Gangdaok” for silage. Korean Journal of Breeding Science.
38 : 149-150.
Son, B. Y., H. G. Moon., T. W. Jung., S. J. Kim., and J. D. Kim.
2006b. Comparison of agronomic characteristics, yield and feed value of different corn hybrids for silage. Korean Journal of Crop Science. 51 : 233-238.
Son, B. Y., J. T. Kim., J. S. Lee., S. B. Beck., W. H. Kim., and J.
D. Kim. 2010. Comparison of growth characteristics and yield of silage corn hybrids by different planting dates at paddy and upland field. Journal of The Korean Society of Grassland and Forage Science. 30(3) : 237-246.
Srivastava, A., H. Greppin., and R. J. Strasser. 1995. Acclimation of land plants to diurnal changes in temperature and light. in:
P. Mathis (Ed.), Photosynthesis: From Light to Biosphere, Kluwer Academic Publishers. The Netherlands. 4 : 909-912.
Strasser, R. J. 1985. Dissipative Strukturen als thermodynamischer
Regelkreis des Photosyntheseapparates. Ber. Deutsche Bot.
Ges. Bd. 98 : 53-72.
Stribet, A. and Govindjee. 2011. On the relation between the Kautsky effect (chlorophyll a fluorescence induction) and Photo- system II: Basics and applications of the OJIP fluorescence transient. J. Photochem. Phobiol. B. 104 : 236-257.
Yoo, S. Y., K. C. Eom., S. H. Park., and T. W. Kim. 2012.
Possibility of drought stress indexing by chlorophyll fluorescence imaging technique in red pepper (Capsicum annuum L.). J.
Kor. Soil. Sci. Fert. 45(2) : 676-682.
Yoo, S. Y., S. Ferrah., and T. W. Kim. 2014 Chlorophyll fluo- rescence imaging analysis for fresh quality assessment of apple and kiwi fruits preserved under different storage conditions.
Int. J. Adv. Inform. Sci. and Tech. 29(29) : 60-68.