Preparation and Characterization of Porous Silicon and Carbon Composite as an Anode Material for Lithium Rechargeable Batteries
Junsoo Park and Jae-won Lee a, *
LG Chem. Ltd., Daejeon 305-380, Korea
a
Department of Energy Engineering, Dankook University, Cheonan-si 330-714, Korea (Received December 10, 2014; Revised January 30, 2015; Accepted February 10, 2015)
···
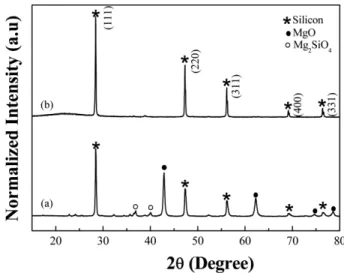
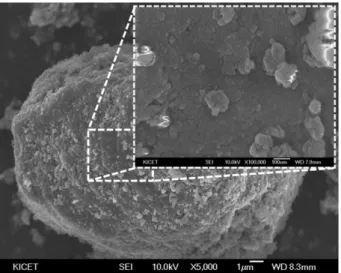
Abstract The composite of porous silicon (Si) and amorphous carbon (C) is prepared by pyrolysis of a nano-porous Si + pitch mixture. The nano-porous Si is prepared by mechanical milling of magnesium powder with silicon monoxide (SiO) followed by removal of MgO with hydrochloric acid (etching process). The Brunauer-Emmett-Teller (BET) sur- face area of porous Si (64.52 m
2g
−1) is much higher than that before etching Si/MgO (4.28 m
2g
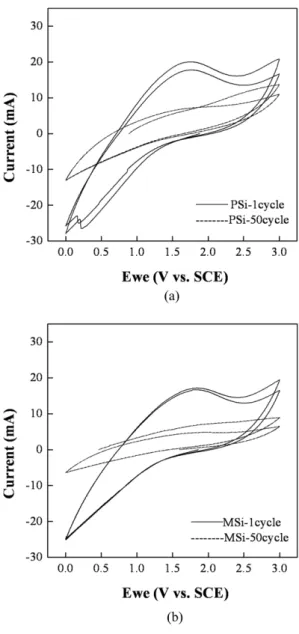
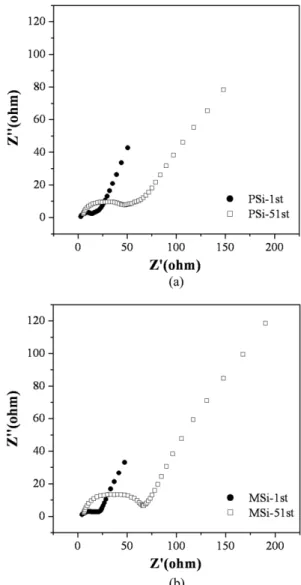
−1) which indicates pores are formed in Si after the etching process. Cycling stability is examined for the nano-porous Si + C composite and the result is compared with the composite of nonporous Si + C. The capacity retention of the former composite is 59.6%
after 50 charge/discharge cycles while the latter shows only 28.0%. The pores of Si formed after the etching process is believed to accommodate large volumetric change of Si during charging and discharging process.
Keywords: Porous, Silicon, Anode, Lithium ion battery, Composite
···
1. Introduction
The limited capacity of graphite which is the most widely used anode material for lithium ion batteries has provoked numerous studied seeking alternative materi- als. Much attention has been given to Si-based anode materials because silicon has the high specific capacity of 4200 mAh g
−1. However, silicon undergoes a change in volume during charging and discharging, and this results in mechanical instability and poor cycle life performance [1,2]. The mechanical stresses induced by the large volu- metric change should be buffered in order to obtain bet- ter cyclability with silicon-based anodes. Various carbonaceous materials such as graphite [3-7], carbon nanofiber [8-11]
and amorphous carbon [12-15] have been suggested as an electrochemically active component which constitutes a composite with Si for buffering the volumetric change.
Several metallic compounds with high mechanical strength and electronic conductivity have been also proposed to suppress Si volume expansion [16-20].
Porous Si is also considered as one of the candidates to improve the cycling stability. Zhihao et al. reported
microporous silicon replicas with an interconnected net- work of silicon nanocrystals and 3-dimensional frustule mor- phology by simple magnesium reduction method [21]. Chen et al. synthesized Si/MgO composites with reasonable cycling stability by magnesium reduction method [22]. Recently, Ying et al. investigated the electrochemical performances of nano-porous Si prepared by an aluminum redox reaction [23]. The nano-porous Si/graphite/C composite exhibited a reversible capacity of about 700 mAhg
−1with no capacity loss up to 120
thcycle.
In this work, we investigated the electrochemical per- formances of the porous Si + C composite prepared by mechanical milling of SiO with magnesium powder fol- lowed by pyrolysis of pitch. Another composite contain- ing nonporous Si was prepared by same procedure and the properties were compared with those of the porous Si + C composite.
2. Material and Methods
2.1. Synthesis of materials
Si/MgO composite powder was synthesized by mechani-
*Corresponding Author: Jae-won Lee, TEL: +82-41-550-3682, FAX: ,+82-41-559-7914 E-mail: [email protected]
<PM리뷰>