ISSN 2288-1069 (Online)
http://dx.doi.org/10.12925/jkocs.2015.32.1.127
Effects of Thermal Treatment on Antioxidant Activity in Yam ( Dioscorea batatas DECNE . )
Han-Soo Kim
a⋅ Yishan Duan
a⋅ Jae-Young Ryu
bSang-Woo Kim
c⋅ Seong-Ho Jang
d✝a
Department of Food Science and Technology, Pusan National University, Miryang 627-706, Korea
b
Department of Urban Enviromental Engineering, Kyungnam University, Changwon 631-701, Korea
4)
East Sea
cFisheries Research Institute, NFRDI, Gangneung, 210-861, Korea
d
Department of Bioenviromental Energy, Pusan National University, Miryang 627-706, Korea (Received February 5, 2015; Revised February 13, 2015; Accepted March 25, 2015)
Abstract : The aim of this study was to investigate the antioxidant activity of thermal treatment yam ( Dioscorea batatas DECNE
.) in Korea. Thermal treatment yam was extracted by different solvents including 70% methanol, 70% ethanol and chloroform–methanol mixture (CM, 2:1, v/v).
Then color property, total phenol content and antioxidant activity were analyzed. Yam possessed high L* value and H
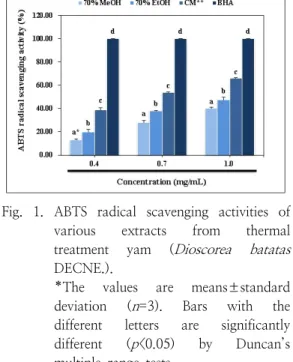
°value, which were 54.92±2.18 and 73.20±0.77, respectively. Thermal treatment yam exhibited great antioxidant activity evaluated by ABTS [2,2′
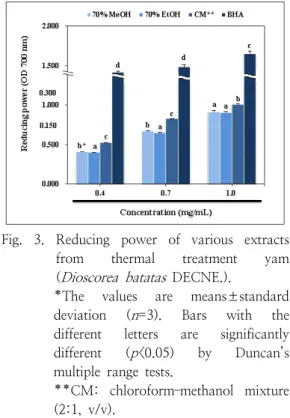
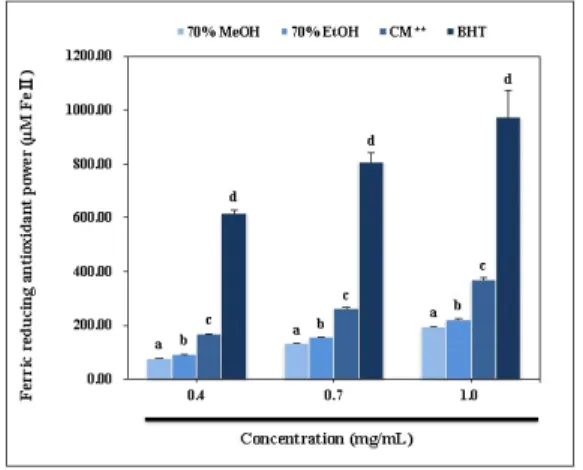
-azino-bis(3-ethylbenzothiazoline-6-sulfonic acid) diammonium salt] radical scavenging activity, DPPH (2,2-diphenyl-1-picrylhydrazyl) radical scavenging activity, reducing power, and ferric reducing antioxidant power. Total phenol contents of various extracts from thermal treatment yam increased in the following order: 70% methanol extract (63.53±0.33 mg CAE/g), 70% ethanol extract (69.47±1.00 mg CAE/g) and CM extract (97.49±0.66 mg CAE/g), respectively. The same trend was also could be found in antioxidant activity assays except for reducing power assay.
These results implied that these extracts from thermal treatment yam might be useful to take a good part in prevention of human diseases and aging.
Keywords : yam (Dioscorea batatas DECNE.), thermal treatment, color values, total phenol, antioxidant activities
1. Introduction
Yam ( Dioscorea batatas DECNE.) is the perennial trailing herb and belongs to the Dioscoreaceae family [14]. Yam is mainly composed of starch (75.6–84.3%) with small
✝