Received: 6 May, 2015 Revised: 29 May, 2015 Accepted: 29 May, 2015 Corresponding author: Wan Hee Lee
Department of Physical Therapy, College of Health and Welfare, Sahmyook University, 815 Hwarang-ro, Nowon-gu, Seoul 139-742, Republic of Korea Tel: 82-2-3399-1633 Fax: 82-2-3399-1639 E-mail: [email protected]
This is an Open-Access article distributed under the terms of the Creative Commons Attribution Non-Commercial License (http://creativecommons.org/licens es/by-nc/4.0) which permits unrestricted non-commercial use, distribution, and reproduction in any medium, provided the original work is properly cited.
Copyright © 2015 Korean Academy of Physical Therapy Rehabilitation Science
http://dx.doi.org/10.14474/ptrs.2015.4.1.38 Phys Ther Rehabil Sci
pISSN 2287-7576 2015, 4 (1), 38-43
eISSN 2287-7584 www.jptrs.org
Ultrasound imaging for age-related differences of lower extremity muscle architecture
Min Kyu Kim, Young Jun Ko, Hwang Jae Lee, Hyun Geun Ha, Wan Hee Lee
Department of Physical Therapy, The Graduate School, Sahmyook University, Seoul, Republic of Korea
Objective: To investigate and compare the size of the rectus femoris (RF), tibialis anterior (TA), and medial gastrocnemius (GMM) using ultrasound (US) imaging in young, elderly, and very elderly groups.
Design: Cross sectional study.
Methods: This study consisted of 25 young (age 20 years), 24 elderly (age 65-74 years), and 25 very elderly (age 75-90 years) people with no physical dysfunctions. The cross sectional area (CSAs) of the RF and muscle thickness of the TA and GMM were measured at rest and during contraction using an US system.
Results: The CSA of the RF and thickness of the TA and GMM were significantly smaller in the elderly and very elderly groups than in the young group (p<0.05). There was a significant difference of the CSA of the RF at rest and during contraction between elderly and very elderly group (p<0.05). In the comparison of the TA and GMM thickness between elderly and very elderly groups, there were no significant differences except for the TA thickness during contraction. There was a significant difference in the per- centage change in RF CSA among the three groups (p<0.05).
Conclusions: Our results revealed loss of muscle mass in the RF, TA, and GMM in elderly and very elderly people (≥65 years old). In particular, the greatest age-related decline in muscle mass was observed for the RF. Furthermore, the CSA of the RF de- clined with aging in the very elderly groups (≥75 years old).
Key Words: Aging, Muscular atrophy, Quadriceps muscle, Ultrasonography
Introduction
In a rapidly aging society, the concomitant increase in age-related diseases represents a significant personal and fi- nancial burden. Moreover, with the development of medical technology, the lifespan of humans has prolonged, and the very elderly population has grown in recent decades.
Age-related loss of skeletal muscle mass among the eld- erly and very elderly results in an increased risk of several diseases and mortality as well as reduced physical function- ing and the eventual loss of functional independence [1,2].
In particular, the strength of the lower extremity muscles is associated with mobility in daily living [3] and cognitive function [4] in the elderly population. Furthermore, lower
extremity muscle weakness is one of the most important risk factors for falls [5]. As a result, these problems may lead to decreased quality of life in the elderly population [6].
Distinctively, the extensor effect in the knee and the flexor effect of the rectus femoris (RF) in the hip play an important role in mobilization [7-9]. In addition, tibialis anterior (TA) and gastrocnemius weakness may result in gait-related im- balances, falls, and an increased hip fracture risk [10]. To prevent falls and predict the physical function and mobility of elderly and very elderly subjects, an accurate measure- ment of the lower extremity muscles is needed.
Age-related loss of skeletal muscle mass has been studied
extensively by evaluating muscle volume or cross-sectional
area (CSA) [11]. Reductions in muscle fiber number and
Figure 1. Representative ultrasound images. (A) The outline of cross sectional area (CSA) of rectus femoris was measured by manual track- ing, (B) the thickness of tibialis anterior was defined as the distance between the superficial and deep aponeuroses, (C) medial gastro- cnemius thickness was defined as the distance between the superficial and deep aponeuroses.
size can indicate decreases in muscle CSA and thickness [12]. Thus, these variables have been used to quantify the force production capabilities of a muscle and assess age-re- lated declines of skeletal muscle mass. To measure leg skel- etal muscle architecture, ultrasound (US) imaging has been employed frequently because it is a relatively simple and ac- curate method. In addition, US imaging is a non-invasive, accessible, safe, and low-cost tool for muscle size measure- ments [13]. Accordingly, several studies have utilized US imaging to measure muscle thickness in elderly populations [14-16], but there have been few studies including very eld- erly individuals.
This study sought to investigate and compare the size of the RF, TA, and medial gastrocnemius (GMM) via US imag- ing among young, elderly, and very elderly populations.
Methods Subjects
A total of 74 participants were recruited for this cross-sec- tional study, including 25 young (age, 20 years), 24 elderly (age, 65-74 years), and 25 very elderly subjects (age, 75-90 years). The young participants were health university stu- dent volunteers who were physically normal. The elderly and very elderly participants were able to ambulate in- dependently or with an assistive device, they lived in the same district, they did not have an unstable physical con- dition, and they possessed sufficient cognition to follow simple instructions and understand the content and purpose
of the study. Participants with physical dysfunctions that could influence outcomes, such as neurological impairment, severe musculoskeletal impairment, or severe cognitive im- pairment, were excluded. The participants were informed about the study procedure and purpose before testing, and written consent was obtained before participating. The study’s protocol was approved by the institutional review board of the Sahmyook University in Seoul.
Anthropometric measurements
Weight and standing height were measured using an elec- tronic height and weight scale. Body mass index (BMI) was defined as body mass (kg)/height
2(m
2). The following an- thropometric measures were obtained from the dominant side of all participants: thigh length, tibia length, and thigh circumference. In the supine position, the length of the thigh was measured as the distance between the greater trochanter of the femur and the articular cleft between the femur and ti- bia condyles [17]. The length of the tibia was measured as the distance from the inner border of the medial condyle to the farthest point of the medial malleolus [18]. The measure- ment was performed with participants sitting with their knees in a semi-flexed position. The circumference of the thigh was measured at 50% of the thigh length above the su- perior border of the patella [17].
Measurements of muscle architecture
The CSA of the RF and the thickness of the TA and GMM
were measured using a US system (MYSONO U5; Samsung
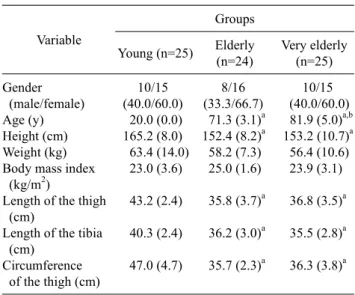
Table 1. Comparison of the general characteristics and anthro- pometric measures of the three groups (N=74)
Variable
Groups
Young (n=25) Elderly (n=24)
Very elderly (n=25)
Gender 10/15 8/16 10/15
(male/female) (40.0/60.0) (33.3/66.7) (40.0/60.0) Age (y) 20.0 (0.0) 71.3 (3.1)a 81.9 (5.0)a,b Height (cm) 165.2 (8.0) 152.4 (8.2)a 153.2 (10.7)a Weight (kg) 63.4 (14.0) 58.2 (7.3) 56.4 (10.6) Body mass index 23.0 (3.6) 25.0 (1.6) 23.9 (3.1) (kg/m2)
Length of the thigh 43.2 (2.4) 35.8 (3.7)a 36.8 (3.5)a (cm)
Length of the tibia 40.3 (2.4) 36.2 (3.0)a 35.5 (2.8)a (cm)
Circumference 47.0 (4.7) 35.7 (2.3)a 36.3 (3.8)a of the thigh (cm)
Values are presented as n (%) or mean (SD).
aSignificantly different compared to the young group (p<0.05).
bSignificantly different compared to the elderly group (p<0.05).
Medicine, Seoul, Korea) with a 7.5-MHz linear transducer.
The US measurements were performed by one examiner with 5 years of experience in musculoskeletal US. Each im- age was taken three times by US at rest and during muscle contraction and the average values were calculated. The im- ages were measured blindly by a single investigator. The representative US images are shown in Figure 1. The test-re- test repeatability of muscle thickness measurements of the lower limbs was established in a previous study [19]. The in- tra-class correlation coefficients for the test-retest reliability of the muscle thickness measurements were 0.72-0.97 for the CSA of the RF and of 0.88 for validity of the US meas- urement for the CSA of the RF compared with CT [20,21].
Rectus femoris
The RF of the dominant leg was measured at rest and dur- ing contraction. Participants assumed a chair-sitting posi- tion on a plinth with their legs relaxed, and they stayed at rest in this position for approximately 10 min. A mark was made on the anterior thigh at 50% of the thigh length, as suggested by de Bruin et al. [22] and Blazevich et al. [23]. For image acquisition of the anatomical CSA of the RF, the US probe was transversally positioned on the skin with minimal com- pression. Three images were taken in the resting position.
For the contracted position, a 5-kg sand bag was applied on one ankle of each participant, and they were then asked to lift the weighted leg while the image was frozen.
Tibialis anterior
Participants assumed a long sitting position on a plinth with the hip in 90
oflexion, the knee extended, and the ankle resting at 0
owith the foot against the wall. The participants wore shorts to leave the lower limbs exposed. Images were taken at a point that was 30% of the distance from the head of the fibula to the tip of the lateral malleolus. This point was then marked on each participant’s leg [24]. Three images were taken at rest. For contraction via ankle dorsiflexion, participants were asked to flex their ankles to 0
oagainst the examiner’s hand.
Medial gastrocnemius
To assess the thickness of the GMM, each subject laid prone on a table with his or her feet hanging off the edge of the table and his or her knees fully extended, and three im- ages of the GMM were obtained with the ankle joint in a rest- ing neutral position (90
o). For the contracted position, the participant’s foot was pushed against the wall maximally,
and then images were taken [25].
Data analysis
The dependent measures were the percentage change val- ue of RF CSA and the muscle thickness of TA and GMM.
The values of RF CSA and thickness of TA and GMM dur- ing contraction were normalized based on the resting values.
The percentage was calculated to assess relative changes of muscle thickness of these 3 muscles.
% change=(contracting−resting)/resting×100 PASW Statistics ver. 18.0 (IBM Co., Armonk, NY, USA) was used for all analyses. Descriptive statistics was used to describe the patient characteristics. Comparisons of the three groups’ general characteristics, namely the percentage change value of RF CSA and thickness of the TA and GMM, were made using one-way ANOVA to test differences among the groups. Scheffe post hoc test was used to assess the significance of differences among the three groups.
Significance was recognized at p<0.05.
Results
Table 1 presents the mean and standard deviation values
of the general characteristics and anthropometric measures
for the three groups. No differences in gender, weight, and
BMI were observed among the groups. However, there were
significant differences in the length of the thigh, the length
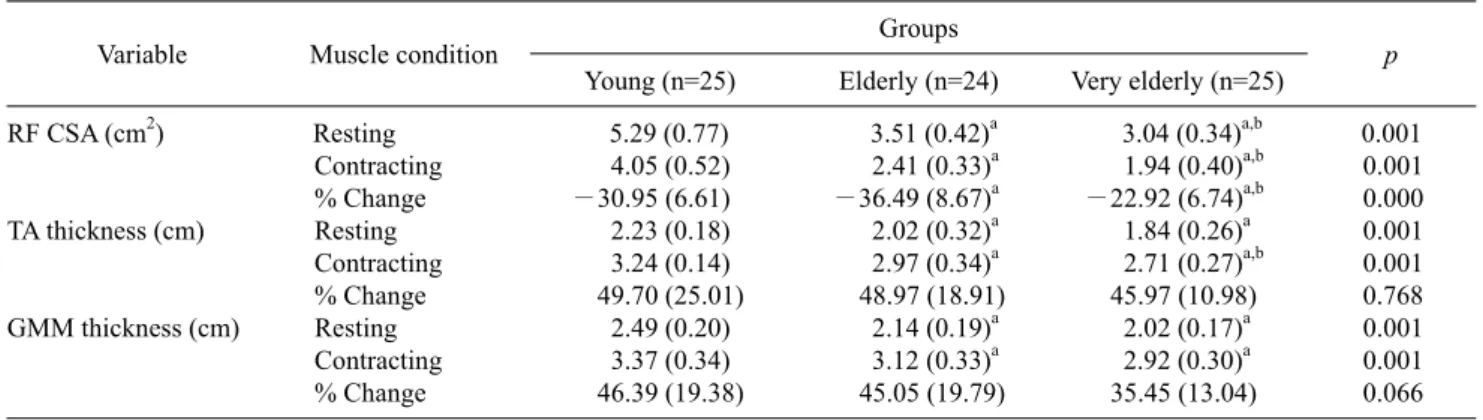
Table 2. Comparison of architecture variables for the RF, TA, and GMM at rest and during contraction among the three groups (N=74)
Variable Muscle condition Groups
Young (n=25) Elderly (n=24) Very elderly (n=25) p
RF CSA (cm2) Resting 5.29 (0.77) 3.51 (0.42)a 3.04 (0.34)a,b 0.001 Contracting 4.05 (0.52) 2.41 (0.33)a 1.94 (0.40)a,b 0.001
% Change −30.95 (6.61) −36.49 (8.67)a −22.92 (6.74)a,b 0.000
TA thickness (cm) Resting 2.23 (0.18) 2.02 (0.32)a 1.84 (0.26)a 0.001 Contracting 3.24 (0.14) 2.97 (0.34)a 2.71 (0.27)a,b 0.001
% Change 49.70 (25.01) 48.97 (18.91) 45.97 (10.98) 0.768 GMM thickness (cm) Resting 2.49 (0.20) 2.14 (0.19)a 2.02 (0.17)a 0.001 Contracting 3.37 (0.34) 3.12 (0.33)a 2.92 (0.30)a 0.001
% Change 46.39 (19.38) 45.05 (19.79) 35.45 (13.04) 0.066 Values are presented as mean (SD).
RF: rectus femoris, TA: tibialis anterior, GMM: medial gastrocnemius, CSA: cross-sectional area.
aSignificantly different compared to the young group. bSignificantly different compared to the elderly group.
of the tibia, and the circumference of the thigh among the young group, the elderly group and very elderly group.
Meanwhile, no differences were noted in gender, height, weight, BMI, the length of the thigh, the length of the tibia, and the circumference of the thigh between elderly and very elderly groups.
There were significant differences among the three groups concerning the CSA of the RF. In the comparison of thickness of the TA and GMM, there were significant differ- ences in elderly and very elderly groups than in young group. However, in the comparison of the TA and GMM thickness between elderly and very elderly groups, no sig- nificant differences were observed except the TA thickness during contraction. There was a significant difference in the percentage change in CSA of the RF among three groups.
However, no significant difference was found in US meas- urement of TA and GMM thickness among three groups (Table 2).
Discussion
It is important to investigate age-related changes in mus- cle architecture, especially in elderly and very elderly in- dividuals to facilitate the development of geriatric re- habilitation programs. Many previous studies revealed that muscle mass, especially that of the antigravity muscles of the lower extremities, decrease rapidly with aging [26,27].
Janssen et al. [28] demonstrated that age-related skeletal muscle loss is greater in the lower limbs than in the upper ex- tremities and that it is primarily associated with decreased use of the lower extremities in activities such as walking.
Therefore, we investigated the lower extremity muscles of the elderly and very elderly populations.
In our results, the CSA of the RF and thickness of the TA and GMM were significantly smaller in the elderly and very elderly groups than in the young group. Strasser et al. [29]
demonstrated that the thicknesses of all muscles of the mus- culus quadriceps were significantly lesser in older subjects than in younger individuals. Ikezoe et al. [15] also described that the thickness of the quadriceps femoris was approx- imately 30%-40% lower in elderly women than in younger women. These findings were similar to our findings of re- duced RF thickness in individuals 65-74 years old compared to that in the young group (33.7% at rest and 40.5% during contraction). Additionally, compared to the findings in the young group, we found that the thickness of the TA was 9.5% lower at rest and 8.4% lower during contraction, whereas that of the GMM was 14.1% lower at rest and 7.5%
lower during contraction. In a previous study, similar to our result, the thickness of the GMM was also significantly low- er in older subjects [30].
In the comparison between the elderly (65-74 years old)
and very elderly groups (≥75 years old), the CSA of the RF
(86.6% at rest and 80.4% during contraction versus the eld-
erly group) and thickness of the TA (91.2% during con-
traction versus the elderly group) were significantly smaller
in the very elderly group. With no significant differences in
general characteristics and anthropometric measures noted
between the elderly and very elderly groups excluding age,
we observed declines in RF CSA at rest and during con-
traction and muscle thickness of TA during contraction in
the very elderly population. Similar to our results, Janssen et
al. [28] described significant muscle loss of the lower ex-
tremities in subjects aged 70 years and older. Another inter- esting result, in this study, was that the percentage change values of RF CSA were significantly different in the three groups. The percentage change values of the thickness of TA and GMM, however, were no significant different in the three groups. In the way that the percentage change value in- dicates muscle behaviour and muscle performance, these findings of this study provide us with the additional in- formation regarding these muscles [31]. It may be more clin- ically useful to percentage value than muscle thickness only.
Probably, this result is indicative of decreases in the type II fibers of the RF, which contains large quantities of these fi- bers, with progressive aging in individuals 65 years old and older. Reductions in the number and size of muscle fibers lead to a decline in overall muscle CSA [32]. Especially, RF CSA may be declining as getting older in elderly people. In the previous research of Abe et al. [14], the age-related loss of skeletal muscle mass was site-specific. Similarly to our results, they demonstrated that both triceps surae and TA muscle loss was only weakly correlated with age, whereas only the quadriceps muscle size was strongly correlated with age. Some study showed that age-related decline in quad- riceps muscle strength might be due to a reduced neural drive and changes in skeletal muscle properties [33].
Many previous studies suggested that exercise can be a non-pharmacological approach against loss of muscle mass in elderly population. In particular, resistance training re- sults in improved skeletal muscle size, composition, and performance in aging adults, as well as improvements in physical function [34-37]. Unfortunately, there have been few studies regarding the effects of exercise on skeletal mus- cle size and performance in elderly and very elderly sub- jects. Further studies investigating changes in muscle archi- tecture that can be determined by rehabilitative US imaging as well as the effects of exercise-based interventions are needed.
This study has some limitations. First, we could not ana- lyze our data based on gender because of a small number of subjects. Second, we have only enrolled the healthy subjects but we did not investigate how functionally healthy the sub- ject in elderly or very elderly group were.
Our results revealed loss of muscle mass in the RF, TA, and GMM in elderly and very elderly people (≥65 years old). In particular, the greatest age-related decline in muscle mass was observed for the RF. Furthermore, the CSA of the RF declined with aging in the very elderly groups (≥75
years old).
Conflict of Interest
The authors declared no potential conflicts of interest with respect to the authorship and/or publication of this article.
References
1. Rantanen T. Muscle strength, disability and mortality. Scand J Med Sci Sports 2003;13:3-8.
2. Sowers MR, Crutchfield M, Richards K, Wilkin MK, Furniss A, Jannausch M, et al. Sarcopenia is related to physical functioning and leg strength in middle-aged women. J Gerontol A Biol Sci Med Sci 2005;60:486-90.
3. Hortobágyi T, Mizelle C, Beam S, DeVita P. Old adults perform activities of daily living near their maximal capabilities. J Gerontol A Biol Sci Med Sci 2003;58:M453-60.
4. Nakamoto H, Yoshitake Y, Takai Y, Kanehisa H, Kitamura T, Kawanishi M, et al. Knee extensor strength is associated with Mini-Mental State Examination scores in elderly men. Eur J Appl Physiol 2012;112:1945-53.
5. Senda M. Musculoskeletal rehabilitation and bone. Locomotion system disorder with aging and rehabilitation. Clin Calcium 2010;20:560-5.
6. Apor P, Babai L. Physical activity diminishes aging-related de- cline of physical and cognitive performance. Orv Hetil 2014;155:817-21.
7. Freilich RJ, Kirsner RL, Byrne E. Isometric strength and thick- ness relationships in human quadriceps muscle. Neuromuscul Disord 1995;5:415-22.
8. Jung JH, Ko SE, Lee SW. Immediate effects of single-leg stance exercise on dynamic balance, weight bearing and gait cycle in stroke patients. Phys Ther Rehabil Sci 2014;3:49-54.
9. Asakawa Y, Jung JH, Koh SE. Neuromuscular electrical stim- ulation improves strength, pain and weight distribution on pa- tients with knee instability post surgery. Phys Ther Rehabil Sci 2014;3:112-8.
10. Okada M. An electromyographic estimation of the relative mus- cular load in different human postures. J Hum Ergol (Tokyo) 1973;1:75-93.
11. Doherty TJ. Invited review: aging and sarcopenia. J Appl Physiol (1985) 2003;95:1717-27.
12. Lexell J. Human aging, muscle mass, and fiber type composition.
J Gerontol A Biol Sci Med Sci 1995;50:11-6.
13. Whittaker JL. Ultrasound imaging of the lateral abdominal wall muscles in individuals with lumbopelvic pain and signs of con- current hypocapnia. Man Ther 2008;13:404-10.
14. Abe T, Kawakami Y, Bemben MG, Fukunaga T. Comparison of age-related, site-specific muscle loss between young and old ac- tive and inactive Japanese women. J Geriatr Phys Ther 2011;
34:168-73.
15. Ikezoe T, Asakawa Y, Fukumoto Y, Tsukagoshi R, Ichihashi N.
Associations of muscle stiffness and thickness with muscle
strength and muscle power in elderly women. Geriatr Gerontol Int 2012;12:86-92.
16. Takai Y, Ohta M, Akagi R, Kato E, Wakahara T, Kawakami Y, et al. Validity of ultrasound muscle thickness measurements for predicting leg skeletal muscle mass in healthy Japanese mid- dle-aged and older individuals. J Physiol Anthropol 2013;32:12.
17. e Lima KM, da Matta TT, de Oliveira LF. Reliability of the rectus femoris muscle cross-sectional area measurements by ultrasono- graphy. Clin Physiol Funct Imaging 2012;32:221-6.
18. Agnihotri AK, Kachhwaha S, Jowaheer V, Singh AP. Estimating stature from percutaneous length of tibia and ulna in Indo-Mauri- tian population. Forensic Sci Int 2009;187:109.e1-3.
19. English C, Fisher L, Thoirs K. Reliability of real-time ultrasound for measuring skeletal muscle size in human limbs in vivo: a sys- tematic review. Clin Rehabil 2012;26:934-44.
20. Seymour JM, Ward K, Sidhu PS, Puthucheary Z, Steier J, Jolley CJ, et al. Ultrasound measurement of rectus femoris cross-sec- tional area and the relationship with quadriceps strength in COPD. Thorax 2009;64:418-23.
21. Thomaes T, Thomis M, Onkelinx S, Coudyzer W, Cornelissen V, Vanhees L. Reliability and validity of the ultrasound technique to measure the rectus femoris muscle diameter in older CAD- patients. BMC Med Imaging 2012;12:7.
22. de Bruin PF, Ueki J, Watson A, Pride NB. Size and strength of the respiratory and quadriceps muscles in patients with chronic asthma. Eur Respir J 1997;10:59-64.
23. Blazevich AJ, Gill ND, Zhou S. Intra- and intermuscular varia- tion in human quadriceps femoris architecture assessed in vivo. J Anat 2006;209:289-310.
24. McCreesh K, Egan S. Ultrasound measurement of the size of the anterior tibial muscle group: the effect of exercise and leg dominance. Sports Med Arthrosc Rehabil Ther Technol 2011;3:
18.
25. Cho KH, Lee HJ, Lee WH. Reliability of rehabilitative ultra- sound imaging for the medial gastrocnemius muscle in post- stroke patients. Clin Physiol Funct Imaging 2014;34:26-31.
26. Lee WS, Cheung WH, Qin L, Tang N, Leung KS. Age-associated decrease of type IIA/B human skeletal muscle fibers. Clin
Orthop Relat Res 2006;450:231-7.
27. Faulkner JA, Larkin LM, Claflin DR, Brooks SV. Age-related changes in the structure and function of skeletal muscles. Clin Exp Pharmacol Physiol 2007;34:1091-6.
28. Janssen I, Heymsfield SB, Wang ZM, Ross R. Skeletal muscle mass and distribution in 468 men and women aged 18-88 yr. J Appl Physiol (1985) 2000;89:81-8.
29. Strasser EM, Draskovits T, Praschak M, Quittan M, Graf A.
Association between ultrasound measurements of muscle thick- ness, pennation angle, echogenicity and skeletal muscle strength in the elderly. Age (Dordr) 2013;35:2377-88.
30. Fujiwara K, Asai H, Toyama H, Kunita K, Yaguchi C, Kiyota N, et al. Changes in muscle thickness of gastrocnemius and soleus associated with age and sex. Aging Clin Exp Res 2010;22:24-30.
31. Teyhen DS, Williamson JN, Carlson NH, Suttles ST, O'Laughlin SJ, Whittaker JL, et al. Ultrasound characteristics of the deep ab- dominal muscles during the active straight leg raise test. Arch Phys Med Rehabil 2009;90:761-7.
32. Sions JM, Tyrell CM, Knarr BA, Jancosko A, Binder-Macleod SA. Age- and stroke-related skeletal muscle changes: a review for the geriatric clinician. J Geriatr Phys Ther 2012;35:155-61.
33. Mau-Moeller A, Behrens M, Lindner T, Bader R, Bruhn S.
Age-related changes in neuromuscular function of the quad- riceps muscle in physically active adults. J Electromyogr Kine- siol 2013;23:640-8.
34. Tang JE, Hartman JW, Phillips SM. Increased muscle oxidative potential following resistance training induced fibre hypertrophy in young men. Appl Physiol Nutr Metab 2006;31:495-501.
35. Greiwe JS, Cheng B, Rubin DC, Yarasheski KE, Semenkovich CF. Resistance exercise decreases skeletal muscle tumor necrosis factor alpha in frail elderly humans. FASEB J 2001;15:475-82.
36. Petersen AM, Pedersen BK. The anti-inflammatory effect of ex- ercise. J Appl Physiol (1985) 2005;98:1154-62.
37. Ko YJ, Ha HG, Jeong J, Lee WH. Variations in lateral abdominal muscle thickness during abdominal drawing-in maneuver in three positions in a young healthy population. Phys Ther Rehabil Sci 2014;3:101-6.