• 검색 결과가 없습니다.

Marker Assisted Selection-Applications and Evaluation for Commercial Poultry Breeding

N/A
N/A
Protected

Academic year: 2021

Share "Marker Assisted Selection-Applications and Evaluation for Commercial Poultry Breeding"

Copied!
12
0
0

로드 중.... (전체 텍스트 보기)

전체 글

(1)

Marker Assisted Selection-Applications and Evaluation for Commercial Poultry Breeding

Simrinder Singh Sodhi

1,a

, Dong Kee Jeong

1,a

, Neelesh Sharma

1

, Jun Heon Lee

4

, Jeong Hyun Kim

1

, Sung Hoon Kim

2

, Sung Woo Kim

3

and Sung Jong Oh

1,*

1

Department of Animal Biotechnology, Faculty of Biotechnology, Jeju National University, Jeju 690-756 South Korea.

2

Department of Animal Life and Environment Science, Hankyong National University, Ansung 456-749 South Korea

3

Animal Genetic Resources Station, National Institute of Animal Science, Suwon 441-706, South Korea

4

Department of Animal Science and Biotechnology, Chungnam National University, Daejeon 305-764, South Korea

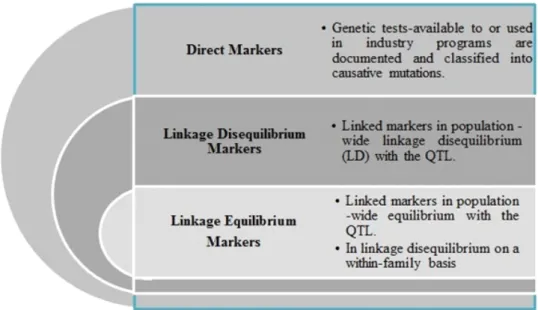
Abstract Poultry industry is abounding day by day as it engrosses less cost of investment per bird as compared to large animals. Poultry have the most copious genomic tool box amongst domestic animals for the detection of quantitative trait loci (QTL) and marker assisted selection (MAS). Use of multiple markers and least square techniques for mapping of QTL affec- ting quality and production traits in poultry is in vogue. Examples of genetic tests that are available to or used in industry programs are documented and classified into causative mutations (direct markers), linked markers in population-wide linkage disequilibrium (LD) with the QTL (LD markers), and linked markers in population wide equilibrium with the QTL (LE markers).

Development of genome-wide SNP assays, role of 42 K, 60 K (Illumina) and 600 K (Affymetrix

®

Axim

®

) SNP chip with next generation sequencing for identification of single nucleotide polymorphism (SNP) has been documented. Hybridization based, PCR based, DNA chip and sequencing based are the major segments of DNA markers which help in conducting of MAS in poultry. Economic index-marker assisted selection (EI-MAS) provides platform for simultaneous selection for production traits while giving due weightage to their marginal economic values by calculating predicted breeding value, using information on DNA markers which are normally associated with relevant QTL. Understanding of linkage equilibrium, linkage dis-equilibrium, relation between the markers and gene of interest are quite important for success of MAS. This kind of selection is the most useful tool in enhancing disease resistance by identifying candidate genes to improve the immune response. The application of marker assisted selection in selection procedures would help in improvement of economic traits in poultry.

(Key words : chicken genomics, chicken breeding, molecular markers, marker assisted selection, traits)

a

These authors contributed equally to this work.

To whom correspondence should be addressed : [email protected]

INTRODUCTION

Poultry production has been the fastest growing livestock industry over the last decades (FAO, 2013) especially in middle and low income countries (Taha, 2003). In 2011, world poul- try production of meat crossed the bar of 100 million metric tons for the first time in history, out of which 36.5 million metric tons and 4 million metric ton production was recorded in Asia and Africa respectively. During the last decade, egg production in the whole world touched the mark of 68893 thousand tonnes (FAO, 2013; Fig. 1). Since 2000, 43% and 25% increase has been recorded in poultry meat and egg production, respectively in the whole world (Best, 2011). Out of the accumulative production of poultry sector, 85% meat and 96% egg production is contributed by chicken only (Bilgili,

2001; Arthur and Albers, 2003; Taha, 2003). Moreover, during the last decade from 2000∼2010, 2.9% growth in poultry population has been observed as compared to 0.8% growth in cattle heads (FAO, 2013). At the same time 3.6% increase in the poultry meat products has been observed as compare to 1.0% increase in cattle meat (FAO, 2013; Table 1). Less cost of investment per bird and increased consumer demand makes poultry breeding an important segment of research. The com- prehensive genomic tool box of poultry provides opportunities for the application of different types of selection procedures.

Assembly of an individual animal’s entire genome sequence

or specific region of interest is important for genetic compa-

rison (Bai et al., 2012). In the livestock breeding programs

for quantitative traits most of the genetic progress has been

made through phenotypic selection or on the basis of esti-

(2)

Fig. 1. Total egg production (1,000 tones represented on Y-axis) of the different continents. Source : FAO Statistical Yearbook 2012, Food and Agriculture Organization of United Nations, Rome.

*

Caucasus : Region at the border of Europe and Asia situated between Black and the Caspian seas,

**

CIS Europe : Commonwealth of Independent States Europe,

***

EU : Europe,

****

EFTA : European Free Trade Association.

Table 1. Per cent per annum growth in the livestock population and meat products in the world during 2000 ∼2010

Cattle Pig Sheep Poultry

Population 0.8 0.7 0.2 2.9

Meat product 1.0 2.0 0.9 3.6

Source : FAO Statistical Yearbook 2012, Food and Agriculture Organization of United Nations, Rome.

mated breeding value; obtained from the phenotype of an individual. This kind of selection is mainly without the knowledge of the number of genes affecting the trait or the effects of each gene. To overcome the flaws of this pattern of selection, molecular genetics provides tools to improve the selection procedures. Advances in molecular genetics for genotyping helps in the incorporation of molecular data in the programs of genetic improvement (Dekkers, 2005). Many traits are under the influence of several genetic loci contributing to the variation in the traits and are known as quantitative trait loci (QTL). Advances in molecular genetics have led to the identification of multiple genes or genetic markers associated with genes that affect traits of interest (Bahmanimehr, 2012), including genes for single-gene traits and QTL or genomic regions that affect quantitative traits. Genetic markers for QTL those are linked to the gene under study can be used in the selection of animals for selecting breeding programs (Williams, 2005). Similarly, it has been observed that in genome-wide marker assisted selection, an optimal genomic

evaluation has been a multi trait and involves all traits and records on which selection is based (Chen et al., 2011).

Detonation of information on genomics and functional genomics has discovered new possibilities for the creation of molecular markers (Bakhtiarizadeh et al., 2012). In general, although molecular genetic information has been used in industrial programs for several decades and is growing, the extent of use has not lived up to initial expectations. Most of the applications till date have been integrated in existing programs on temporary basis. Objectives of current paper are to review strategies for the use of genes or markers and application of recent molecular selection techniques assisted by markers for the production of high potential and economic poultry strains along with their future possibilities in poultry industry. The current attitude towards MAS is one of the cautious optimism.

CHICKEN GENOME

(3)

Poultry is the species which has the most comprehensive genomic tool box amongst domestic animals (Kerje, 2003).

Three separate populations of poultry have been used to develop linkage maps (Bumstead and Palyga, 1992; Critten- den et al., 1993; Groenen et al., 1998). It was confirmed that linkage maps of poultry were later on merged to provide a unison map with 1889 markers (Groenen et al., 2000). The genome sequence efforts were accompanied by partial se- quencing of three distinct poultry breeds (a broiler, a layer and a Chinese Silky) to identify single nucleotide polymorphisms (SNPs) between and among these breeds (Groenen et al., 2000) and the Red Jungle Fowl sequence was used as refe- rence (De Koning and Hocking, 2007). A review of Burt (2005) has been described in details on chicken genome. A unique characteristic of avian genomes is the large variability in chromosome size. In addition to a pair of sex chromosomes, chickens have 38 pairs of autosomes: 5 macro-, 5 intermediate and 28 microchromosomes.

Hillier et al. (2004) assembled a draft of the chicken ge- nome using a whole-genome sequencing strategy, including fosmid, BAC, and plasmid paired-end reads (WASHU). Such approach produced a high-quality assembly, in part because of the relatively small size of the chicken genome, one third that of a typical mammal. On comparisons with known func- tional sequences suggested that 75% of coding regions and 30∼40% of regulatory elements are conserved. Only 2.5% of the chicken sequence could be aligned with that of the human (44% coding, 25% intronic, and 31% intergenic) and, given that 5% of the mammalian genome is under selection, almost all of this is likely to be of functional significance. This fraction of genome provides scope for the efficient applica- tion of strategies for selection.

MOLECULAR MARKERS (MMs)

Fixed landmarks in the genome of an individual, present at specific locations and identifiable sequences of DNA are known as “molecular markers”. Copy number variation in intron 1 of SOX5 causing pea comb phenotype in chicken is a fine example of molecular markers (Wright et al., 2009).

MMs are passed from one generation to the next generation by following Mendel’s Laws of Inheritance (Johan and Andrea,

2007) but are not to be considered as normal genes. In comparison to the markers based on visible traits and proteins produced by genes, MMs bank upon DNA assays (Ruane and Sonnino, 2007). DNA markers are used to characterize the genetic makeup and estimate the performance of an animal (Beuzen et al., 2000). On comparison with accustomed back- crossing system, it is observed that the use of DNA markers is beneficial in faster recovery of the recurrent genome and is more efficient in selecting genomes that have recombination events close to the target gene (Ribaut and Hoisington, 1998).

For the appraisal of the genetic basis of the perceived pheno- typic variability, genetic polymorphisms eventualizing at DNA level are used as markers (Gholizadeh et al., 2008). DNA based markers changed the whole concept of gene mapping and it had huge impact in the field of animal genetics. These markers help to exploit diversity present in DNA sequence.

DNA markers can be used to access sequenced DNA fragments and assays for genetic polymorphisms which are clubbed into the category of fingerprinting markers (Dodgson et al., 1997).

Classification of Molecular Markers

Depending upon their type and according to their utility in different aspects of molecular genetics, markers have been classified in different ways by researchers. Markers have been classified as Direct Markers, Linkage Disequilibrium Markers (LD) and Linkage Equilibrium Markers (Dekkers, 2005) (Fig.

2). Molecular markers have also been categorized on the basis of (a) technical requirements (i.e. whether MMs can be auto- mated or require the use of radioactivity), (b) involvement of time, money and labour needed in the use of MMs, (c) on the basis of their accountability in the genome (e.g. the number of genetic markers that can be detected throughout the ge- nome) and (d) the amount of genetic variation found in each marker in a given population (Ruane and Sonnino, 2007).

MMs have also been classified for their ability to appraise polymorphism in DNA (Teneva, 2009). These are differen- tiated in to the following three groups:-

1) Hybridization-based DNA Markers

Hybridization-based DNA markers like Restriction Fragment

Length Polymorphism (RFLP). Detection of RFLPs involves

(4)

Fig. 2. Classification of markers on the basis of relationship between the markers and the genes of interest.

the fragmentation of genomic DNA by restriction enzymes that recognize specific DNA sequences/motifs (generally fre- quent cutters 4∼10 bp in length).

2) PCR-based DNA Markers

In vitro amplify specific DNA sequences with the help of intentionally chosen oligonucleotide sequences (primers) and a DNA polymerase enzyme which are stable to heat. The best examples of this class are, random amplified length poly- morphic DNAs (RAPDs), simple sequence repeats (SSRs) or microsatellites, amplified length polymorphism (AFLPs). Al- though currently RAPDs is no longer used in poultry industry, but it had been applied to detect similarities between the strains selected for egg and meat production (Ali et al., 2003). These days restriction fragment length polymorphisms (RFLPs) are solely PCR based.

3) DNA Chip and Sequencing-based DNA Markers

e.g. Single nucleotide polymorphism (SNPs) - A SNP array is a type of DNA microarray which is used to detect polymorphisms within a population. SNP is a variation at a single site in DNA, is the most frequent type of variation in the genome. Development of genome-wide SNP assays is hand-carried by the SNP map, ranging from 5,000 ∼20,000 SNPs per assay (De Koning et al., 2004). Since 2008, SNP

chips are in use and 60K SNP chip (Illumina Inc., San- Diego, CA) are proprietary in this field. More success rate of the SNPs on the Illumina chicken 60K beadchip emphasized the power of next generation sequencing for the identification of SNP (Groenen et al., 2011). Due to its non-availability for academic use, 42 K SNP chip (Illumina Inc., SanDiego, CA) was developed (Fulton, 2012). To test genome-wide MAS in commercial chickens an Illumina islet array has been selected.

To fill in the vacuum of a lack of commercially available genotyping array for chicken, recently a high density Affy- metrix Axiom array has been developed under an umbrella of BBSRC/DEFRA LINK grant project with collaboration of various institutes/companies (Kranis et al., 2013).

Authors have expected widespread usage of 600 K SNP

both in research and commercial application such as in geno-

mic selection, genome-wide association studies, selection sig-

nature analyses, fine mapping of QTLs and detection of copy

number variants. The loci and candidate genes for body com-

position and meat quality traits in Beijing-You chickens have

been identified through genome wide association (Liu et al.,

2013). Another type of DNA variant, copy number variation

(CNV) is emerging as a significant contributor to phenotypic

variation in many species. CNVs potentially affect the gene

expression (Baily et al., 2008). A recent study of Crooijmans

et al. (2013) have been identified 3,154 CNVs, grouped into

1,556 CNV regions (CNVRs) with the average size of 46.3 kb.

(5)

MARKER ASSISTED SELECTION (MAS)

High density DNA marker maps constructed by the mole- cular marker systems for the species are economically crucial in the area of agriculture. Mapped MMs provide a framework required for its consequential use in the application of MAS.

Genetic diversification in breeding population is utilized with the help of mapping and can be used to adjust the whole range of desirable traits (Beuzen et al., 2000).

There are different types of traits for which MAS has created avenues for enhancing response to selection. Poultry genome was the first to be mapped in 1992 among the live- stock species followed by cattle, pigs and sheep (Dekkers, 2004). Chicken genomic toolbox is the most extensive for detection of quantitative trait loci (QTL) and MAS. An idea about the linkage equilibrium and disequilibrium is considered before the role of relationship between the markers and the genes of interest is discussed for the success of MAS. Linkage equilibrium (LE) exists when genotype present at one locus is in equanimity with the genotype at a second locus and alternatively, when genotypes at the two loci are not in equa- nimity with one another, then there is linkage disequilibrium (LD) or the random association of alleles at different loci is known as linkage disequilibrium (Slatkin, 2008).

MMs are preferred in the order as Direct Markers >

Linkage Disequilibrium > Linkage Equilibrium for their effective implementation in MAS. On the basis of the ease of application and potential for extra genetic gain the same order of ability is followed for these markers as far as their use is concerned (Dekkers, 2004). High-density genotyping of SNPs enables detection of QTL by LD mapping (Andreescu et al., 2007). Description of LD between markers and QTL can consequentially be used for MAS. The success of LD mapping and MAS depends on the extent of LD and the use of associations those require LD between loci to be consistent across populations (Andreescu et al., 2007). For classification of genetic markers and their promising use in MAS for chi- cken, the genome sequence and high density SNP maps are available these days (Abasht et al., 2009). It has been ascer- tained that markers maintaining high LD with linked QTL are very close to each other across the two generations and will be effective for MAS (Abasht et al., 2009).

Recently in plant and animal breeding, the concept of QTL affecting the variance of quantitative traits (vQTL) has gained importance because of the increasing importance of unifor- mity (Wolc et al., 2012). The first of published studies on vQTL was on recombinant inbred lines of maize for econo- mically important traits (Ordas et al., 2008), whereas in animals, researchers failed to detect significant vQTL while working on back fat thickness in pigs (Yang et al., 2011).

Later, few studies have reported vQTL for egg weight, which could be due to the large data sets that are needed because of low power to detect vQTL (Visscher and Posthuma, 2010).

1. Route to Adoption of MAS in Chicken Bree- ding Programmes

Numbers of egg laid in layers and body weight at 6 weeks of age in broilers are the quantitative traits of economic importance which are controlled by many genes along with environmental factors (Sewalem et al., 2002; Liu et al., 2011).

These traits are necessary for the genetic improvement prog- rammes in poultry. In the traditional genetic improvement programmes with the selection on the basis of phenotype, there is lacuna regarding the knowledge of the kind of gene being selected. Transitional shift in the selection procedures based on genotype, also do not have much authenticity due to lack of appropriate markers. Concept of DNA based markers is in vogue to identify markers spread all over in the genetic material of the species of interest. Genes and genetic markers can be used to potentiate the genetic improvement of breeding stock through marker-assisted selection (Dekkers and Hospital, 2002).

The first use of a complete RFLP linkage map to resolve quantitative traits into discrete Mendelian factors, in an inter- specific back-cross of tomato (species of interest) revolution- ized the field of academic research (Paterson et al., 1988).

Same modus operandi is targeted towards the quantitative

inheritance of physiological, morphological and behavioural

traits based on separate genetic approaches in any higher

plant or animal. In plant and animal populations, molecular

genetic analysis of traits has destined for better understanding

of quantitative trait genetics. It has been reported that in the

base population, during selection when marker and QTL are

in linkage equilibrium then polygenic variance approaches

(6)

equilibrium, QTL variance decreases continuously over time and the transmission of marker alleles is traceable in an out- bred poultry breeding nucleus (Vander and van Arendonk, 1996).

MAS uses DNA markers for the selection of animals which give superior genetic merit for phenotypic traits which are normally too expensive or too difficult to measure prac- tically. QTL affecting quality and production traits in layers are being mapped via multiple markers and least square techniques (Tuiskula et al., 2002). Quality of egg shell has always been a very important trait. QTL for egg shell strength and white thinning of egg shell have been found on the chromosomes “Z” and “2” respectively (Tuiskula et al., 2002). Advances in the characterization and identification of genes, coding for eggshell matrix proteins has made it possible to consider these genes as candidate genes for the impro- vement of quality of eggshell by MAS (Bain, 2004). Still in the developing countries, due to lesser investments in the field of molecular markers, MAS is not being used to its full potential.

Concept of EI-MAS has provided platform for simulta- neous selection for production traits while giving due weigh- tage to their marginal economic values. EI-MAS uses infor- mation on DNA markers which are associated with relevant QTL to calculate predicted breeding value (Lahav et al., 2006).

It has been observed that EI-MAS is advantageous for the traits which have low heritability. Study on the chicken has confirmed that the response to EI-MAS is more when the map distance between the marker and the quantitative trait gene is small and vice- versa. Also the selection of the traits in the poultry breeding programs using cluster analysis is quite helpful in establishment of a selection index, by com- bining all economical traits in one equation to increase the efficiency of selection process (Rosario et al., 2008).

2. Applications and evaluation of marker assisted selection in poultry

It is necessary to have knowledge about the extent of relationship between marker and the trait under consideration for the implementation of the MAS. The extent of relationship between molecular marker and the trait under consideration can be judged by the studies based on the quantitative trait

loci, gene of interest and the studies for the underlying genetic mechanisms.

Through fine mapping analysis, the responsible gene muta- tion had only been described for some disease resistance QTL (Liu et al., 2001a; Liu et al., 2001b; Liu et al., 2003).

For Marek’s disease (costing about $1 billion per annum to poultry industry (Vallejo et al., 1997; Yonash et al., 1999), two inbred lines “63” (MD resistant) and “72” (MD susceptible) were mated to identify the QTL affecting MD susceptibility.

It was reported for the first time on the mapping of non- major histocompatibility complex QTL affecting MD suscep- tibility (Vallejo et al., 1997). Use of MAS to boost the genetic resistance to MD, is an alluring alternative to augment control with vaccines (Liu et al., 2001a). Equal attention is given to the production traits and improvement of egg quality, in layers. Feed efficiency and meat quality are the traits of consideration by the breeders for improvement in broilers with the help of marker, as these are not easy to measure in an accustomed manner.

MAS is useful in enhancing disease resistance by identi-

fying candidate genes to improve the immune response (Malek

and Lamont, 2003). To investigate the genetic control of

response to Salmonella enteritidis (SE) in chicken, several

candidate genes e.g. inducible nitric oxide synthase (INOS),

tumour necrosis factor related apoptosis inducing ligand

(TRAIL), transforming growth factor-β2 (TGF-β2), transfor-

ming growth factor-β3 (TGF-β3) and immunoglobulin G light

chain (IgL), had been selected. These candidate genes were

selected on the basis of their role in the host’s response to

intracellular bacteria (Malek and Lamont, 2003). A QTL com-

prising of 198 microsatellite markers which covers two-third

of the chicken genome has provided platform for high-resolu-

tion mapping and positional cloning of the resistant genes

(Heifetz et al., 2007). Single strand conformational polymor-

phism (SSCP) analysis and DNA sequencing have been used

to detect SNPs of FATP1 gene in chicken and to extricate the

suggested association between FATP1- SNPs and chicken car-

cass traits (Wang et al., 2010). FATP1 gene polymorphisms

are associated with chicken carcass traits or are linked with

the major gene. The SNPs in this gene can be utilized as

poten- tial markers for MAS during chicken breeding

programme. A fast improvement in QTL studies has been

(7)

observed in chicken, which led to the enhancement of a QTL database especially for chicken (NAGRP, http://www.animalge- nome.org/QTLdb/chicken.html). Planning for selection proce- dures, based on QTL is becoming more feasible for the rest of the poultry species by deploying dense genetic linkage maps (Saszanov et al., 2010). It is difficult to quantify the effect of MAS under the conditions laid down for experiment especially when response is not large or MAS is part of multi trait breeding goal. Response to MAS can be evaluated at:

changes in gene frequencies for the locus of the marker under study and targeted; secondly to estimate the effect of targeted loci on the traits in the population under target and thirdly for improvement of the selected individuals in overall genetic level for trait of interest (Dekkers, 2004).

3. Scope for Markers Assisted Selection in Poultry

Chickens are considered eminent for signifying new approa- ches where QTL studies are complemented by gene expression studies (Liu et al., 2001a). It has been reported that QTL has become fully distributed within “genetical genomics” (De Koning et al., 2003, 2007; De Koning and Haley, 2005).

Now, the major question in front of breeders, before they accept MAS is whether the breeders are ready to adjourn their breeding programmes with MAS?

It has been observed that, MAS could increase the inten- sity of selection in poultry breeding programme for the traits which are (1) measured later in life, (2) costly to measure, (3) traits having low heritability (reproductive traits i.e. fertility and hatchability (Savegnago et al., 2011), (4) traits for which measurement of phenotype is difficult, expensive or is not possible on selected candidates (5) traits for which selection is within full-sib families for sex-limited traits (Muir, 2003;

Dekkers, 2004).

Major drawback of MAS is its usance in traits like repro- ductive traits and its considerations related to its efficacy (Muir, 2003). Identification of multiple genes or genetic mar- kers which are associated with the genes, affecting the traits under consideration in livestock species has become possible due to advancement in molecular genetics (Dekkers, 2004).

Subsequently, the location of QTL for body weight (BW) and abdominal fat traits on chicken chromosome 1 has been

confirmed and redefined (Liu et al., 2008). By the use of the linkage analyses, the confidence interval for body weight and abdominal fat percentage has narrow down sharply. It had been confirmed that effective decrease in the confidence interval of QTL could be due to the use of more markers and individuals (Liu et al., 2008).

Use of SNP in selection has been proven to be an added effect. Aid of next generation sequence (NGS) in the classi- fication and induction of SNPs has increased the rate of success for SNPs in chicken (Groenen et al., 2011). Genetic mapping based on SNP helps in conducting population studies and linkage disequilibrium analysis (Emara and Kim, 2003). It has been observed that SNPs can be fully descriptive in chicken populations that are derived from inbred line crosses (Lindblad et al., 2000). Inbred lines diverging widely in their phenotypic traits can be compared by SNPs. Tag SNP helps to find chromosome regions that have different haplotype distribution in two groups of individuals i.e. with response and without response. It has been observed that tagging SNPs is efficient for genome-wide selection (Halldorsson et al., 2004). Tag SNPs can be asserted across chromosomal regions with high and low level linkage disequilibrium. Tagging of SNPs can contribute in a two to three time savings compared to selecting random SNPs (Halldorsson et al., 2004). Many SNPs show correlated genotypes or linkage disequilibrium (LD), which proposes that only a subset of all SNPs which are known as tag SNPs, can be genotyped for disease asso- ciation studies (Howie et al., 2006). Evaluation of economic returns after implementation of MAS from increased profit at the production levels is proportional to the genetic gain (Hayes and Goddard, 2003). It has also been observed that the most of the commercial breeding programs derive profit from increased market share of breeding stock (Dekkers, 2004).

Since, known gene mutations provide a comfortable path

for implementation along with underlying biology, breeders

prefer to work with these kinds of mutations. Keeping in

mind the goals, these molecular techniques can be implemented

successfully by following well defined, crisp and integrated

strategy. With this view point in mind, the application of MAS

in selection procedures would help in improvement. There is

dire need of the time that poultry breeder should now decide

(8)

that at which molecular stage they want to exploit information and especially for which trait?

4. Scope for MAS in Poultry in Developing Countries

In the developing countries, appropriate facilities and resources are available in poultry breeding industry. Poultry industry is expanding day by day as it involves less cost of investment per bird as compared to large animals. Poultry farming today is a big occupation that is spread over into various accomplishments including hatcheries, pullet farms (for meat production) and farms for egg production (Hamra, 2010). High rate of proliferation and short generation interval in poultry make them more acceptable (Lwelamira et al., 2008). Except few intensive breeding units, developing coun- tries often have low input systems. There is lack of phenotypic and pedigree information in these systems which makes it more difficult to understand the accent of selection assisted by markers. Moreover, these conditions pose more difficulties and expenses in confirming the linkage by using linked mar- kers. Because of lesser investment in the field of molecular markers, the full potential of MAS is not being capitalized in developing countries. A practical complication analysed for MAS is the loss of relationship between distinct marker allele and favourable trait, when marker is not in proximity of the region to be selected (Fulton, 2012).

In developing countries, where resources are very limited and there is lack of record keeping, it becomes very difficult to apply new techniques like MAS. It is also necessary that poultry breeders should be ready to change their breeding strategies and willing to adopt new molecular techniques.

Once, breeders develop inclination towards these techniques and have proper record keeping, it would become very easy to adopt MAS in developing countries. While comparing marker assisted introgression and selection within breeds, genotypic information is used in a much better way by marker assisted introgression as compared to the later selection procedure in developing countries (Visscher et al., 1996; Visscher and Haley, 1999). It holds potential for improvement in developing coun- tries and should thus be targeted. Since there is more number of small poultry holdings in developing countries which help the farmers to sustain their livelihood, therefore much empha-

sis is given on the development of dual - purpose birds which can be kept for both egg and meat.

CONCLUSION

Uptake of MAS will depend strongly on whether the industry wishes to supplement its current selection programme with a known gene variant, or if it is prepared to restructure breeding programmes around Marker Assisted Selection. To implement MAS successfully, one must tackle the following issues like problems of identifying the traits for selection and their economic significance, the lack of current knowledge of the genes or markers associated with these traits, and their association with other economic selection criteria. The current

“toolbox” provides the means to answer some of these ques- tions but there are obvious concerns about human and capital resources. There is a need for Governments and organizations to inform the public about the benefits of MAS and its po- tential role in the management of genetic resources. While building national development and global strategies, it is very crucial to address the questions of public awareness, education and information. Although, grouped with some limitations or barriers, MAS must be the very evident successful tool for current breeding programmes in achieving many desirable commercial goals.

ACKNOWLEDGEMENTS

This supported by the 2013 scientific promotion program funded by Jeju National University.

REFERENCES

Abasht B, Sandford E, Arango J, Settar P, Fulton JE, Neil POS, Abebe H, David H, Fernando RL, Dekkers JCM, Lamont SJ 2009 Extent and consistency of linkage dise- quilibrium and identification of DNA markers for produc- tion and egg quality traits in commercial layer chicken populations. BMC Genomics 10 (Suppl 2):S2.

Ali BA, Ahmed MMM, Aly OM 2003 Relationship between

genetic similarity and some productive traits in local chi-

cken strains. African J Biotech 2:46-47.

(9)

Andreescu C, Avendano S, Brown SR, Hassen A, Lamont SJ, Dekkers JCM 2007 Linkage disequilibrium in related breeding lines of chickens. Genetics 177:2161-2169.

Arthur JA, Albers GAA 2003 Industrial perspective on pro- blems and issues associated with poultry breeding. Poultry Genetics, Breeding and Biotechnology, edited by W M Muir & S E Aggrey (CABI Publishing, Wallingford, U.

K.):1-12.

Bahmanimehr A 2012 Selection for economic traits in chickens breeding program according to genetic parameters and correlation between traits. World Appl Sci J 20:1332-1335.

Bai Y, Sartor M, Cavalcoli 2012 Current status and future perspectives for sequencing livestock genomes. J Anim Sci Biotech 3:8.

Bailey JA, Kidd JM, Eichhler EE 2008 Human copy number polymorphic genes. Cytogenet Genome Res 123:234-243.

Bain MM 2004 Recent advances in the assessment of egg- shell quality and their future application. World Poult Sci J 61(2):268-277.

Bakhtiarizadeh MR, Arefnejad B, Ebrahimie E, Ebrahimi M 2012 Application of functional genomic information to develop efficient EST-SSRs for the chicken (Gallus gallus) Genet Mol Res 11(2):1558-1574.

Best P 2011 Status of global poultry meat, egg production sectors. Available from http://www.WATTAgNet.com, updated Nov. 24. 2011 (Accessed on Apr. 03. 2012).

Beuzen ND, Stear MJ, Chang KC 2000 Molecular markers and their use in animal breeding. Vet J 160:42-52.

Bilgili SF 2001 Poultry products and processing in the interna- tional market place. Proc Internat Anim Agric & Food Sci Conf Indianapolis, IN USA (available from www.fass.org/

fass01/pdfs/Bilgili.pdf) (Accessed on Apr. 03. 2012).

Bumstead N, Palyga J 1992 A preliminary linkage map of the chicken genome. Genomics 13:690-697.

Burt DW 2005 Chicken genome: Current status and future opportunities. Genome Res 15:1692-1698.

Chen CY, Misztal I, Aguilar I, Tsuruta S, Meuwissen THE, Aggrey SE, Wing T, Muir WM 2011 Genome-wide mar- ker-assisted selection combining all pedigree phenotypic information with genotypic data in one step: An example using broiler chickens. J Anim Sci 89:23-28.

Crittenden LB, Provencher L, Sanatangello L, Levin I, Abpla-

nalp H, Briles RW, Briles WE, Dodgson JB 1993 Charac- terization of a red jungle fowl by White Leghorn back- cross reference population for molecular mapping of the chicken genome. Poult Sci 72:334-348.

Crooijmans RP, Fife MS, Fitzgerald TW, Strickland S, Cheng HH, Kaiser P, Redon R, Groenen MA 2013 Large scale variation in DNA copy number in chicken breeds. Biomed Central (BMC) Genomics 14:398.

De Koning DJ, Carlborg O, Haley CS 2007 The genetics dissection of immune response using gene-expression studies and genome mapping. Vet Immunol Immunopathol 105:343-352.

De Koning DJ, Haley CS 2005 Genetical genomics in hu- mans and model organisms. Trends Genet 21:377-381.

De Koning DJ, Haley CS, Windsor D, Hocking PM, Griffin H, Morris A, Vincent J, Burt DW 2004 Segregation of QTL for production traits in commercial meat-type chickens.

Genet Res 83:211-220.

De Koning DJ, Hocking PM 2007 Marker-assisted selection in Poultry. In: Marker Assisted Selection-Current Status and Future Perspectives in Crops, Livestock, Forestry and Fish, Food and Agriculture Organization of the United Nations, Rome, Italy 185-198.

De Koning DJ, Windsor D, Hocking PM, Burt DW, Law A, Haley CS, Morris A, Vincent J, Griffin H 2003 Quanti- tative trait locus detection in commercial broiler lines using candidate regions. J Anim Sci 81:1158-1165.

Dekkers JCM 2004 Commercial application of marker and gene-assisted selection in livestock: strategies and lessons.

J Ani Sci 82:E313-E328. Available from http://jas.fass.org/

cgi/ reprint/82/13_suppl/E313 (Accessed on Apr. 05. 2012).

Dekkers JCM 2005 Implementation of marker assisted selec- tion into breeding programs. 4

th

European Poultry Genetics Symposium held on 6 ∼8 Oct. Croatia:1-9.

Dekkers JCM, Hospital F 2002 The use of molecular genetics in the improvement of agricultural populations. Macmillan Magazines Ltd 3:22-32. Available from: www.nature.com/

reviews/genetics (Accessed on Apr. 05. 2012).

Dodgson JB, Cheng HH, Okimoto R 1997 DNA marker tech- nology: a revolution in animal genetics, Poultry Sci 76:1108- 1114.

Emara MG, Kim H 2003 Genetic markers and their app-

(10)

lication in poultry breeding. Poultry Sci 82:952-957.

FAO 2013 FAO Statistical Yearbook 2012, Food and Agricul- ture Organization of United Nations, Rome.

Fulton J E 2012 Genomic selection for poultry breeding.

Anim Frontiers 2(1):30-36.

Gholizadeh M, Mianji GR, Zadeh HS 2008 Potential use of molecular markers in the genetic improvement of lives- tock. Asian J Anim Vet Adv 3(3):120-128.

Groenen MA, Cheng HH, Bumstead N, Benkel BF, Briles WE, Burke T, Burt DW, Crittenden LB, Dodgson J, Hillel J, Lamont S, deLeon AP, Soller M, Takahashi H, Vignal A 2000 A consensus linkage map of the chicken genome.

Genome Res 10:137-147.

Groenen MA, Crooijmans RP, Veenendaal A, Cheng HH, Siwek M, Vander Poel JJ 1998 A comprehensive micro- satellite linkage map of the chicken genome. Genomics 49:265-274.

Groenen MA, Megens HJ, Zare Y, Warren WC, Hillier LDW, Crooijmans RPMA, Vereijken A, Okimoto R, Muir WM, Cheng HH 2011 The development and characterization of a 60K SNP chip for chicken. Genomics 12:274.

Halldorsson BV, Bafna V, Lippert R, Schwartz R, De La Vega FM, Clark GA, Istrail S 2004 Optimal haplotype block-free selection of tagging SNPs for genome-wide association studies. Genome Res 14:1633-1640.

Hamra CF 2010 An assessment of the potential profitability of poultry farms: a broiler farm feasibility case study. M Sc Thesis, University of Tennessee, Martin, 2010.

Hayes B, Goddard ME 2003 Evaluation of marker assisted selection in pig enterprises. Livest Prod Sci 81:197-211.

Heifetz EM, Fulton JEN, Sullivan PO, Arthur JA, Wang J, Dekkers JCM, Soller M 2007 Mapping quantitative trait loci affecting susceptibility to Marek’s disease virus in a backcross population of layer chickens. Genetics 177:2417- 2431.

Hillier LW, Miller W, Birney E, Warren W, Hardison RC, Ponting CP, Bork P, Burt DW, Groenen MA, Delany ME, et al. 2004 Sequence and comparative analysis of the chicken genome provide unique perspectives on vertebrate evolution. Nature 432:695-716.

Howie BN, Carlson CS, Rieder MJ, Nickerson DA 2006 Efficient selection of tagging single-nucleotide polymor-

phisms in multiple populations. Hum Genet 120:58-68.

Johan R, Andrea S 2007 Marker assisted selection as a tool for genetic improvement of crops, livestock, forestry and fish in developing countries: an overview of issues. In:

marker assisted selection-current status & future perspec- tives in crops, livestock, forestry & fish. Food and Agri- culture organization of the United Nations, Rome, pp 4-13.

Kerje S 2003 Mapping genes affecting phenotypic traits in chicken. Ph D Thesis, Uppsala University, Uppsala.

Kranis A, Gheyas AA, Boschiero C, Turner F, Yu L, Smith S, Talbot R, Pirani A, Brew F, Kaiser P, Hocking PM, Fife M, Salmon N, Fulton J, Strom TM, Haberer G, Weigend S, Preisinger R, Gholami M, Qanbari S, Simianer H, Watson KA, Woolliams JA, Burt DW 2013 Development of a high density 600K SNP genotyping array for chicken.

BMC Genomics 14:59.

Lahav T, Atzmon G, Blum S, Ari GB, Weigend S, Cahaner A, Lavi U, Hillel J 2006 Marker-assisted selection based on a multi-trait economic index in chicken: experimental results and simulation. Anim Genet 37:482-488.

Lindblad TK, Winchester E, Daly MJ, Wang DG, Hirschhorn JN, Laviolette P, Ardlie K, Reich DE, Robinson E, Sklar P, Shah N, Thomas D, Fan JB, Gingeras T, Warrington J, Patil N, Hudson TJ, Lander ES 2000 Large scale dis- covery and genotyping of single nucleotide polymorphisms in the mouse. Nat Genet 24:381-386.

Liu HC, Cheng HH, Tirunagaru V, Sofer L, Burnside J 2001a A strategy to identify positional candidate genes conferring marek’s disease resistance by integrating DNA microarrays and genetic mapping. Anim Genet 32:351-359.

Liu HC, Kung HJ, Fulton JE, Morgan RW, Cheng HH, 2001b Growth hormone interacts with the Marek’s disease virus SORF2 protein and is associated with disease resis- tance in chicken. Proc Natl Acad Sci USA 98:9203-9208.

Liu HC, Niikura M, Fulton JE, Cheng HH 2003 Identifica- tion of chicken lymphocyte antigen 6 complex, locus E (LY6E, alias SCA2) as a putative Marek’s disease resis- tance gene via a virus-host protein interaction screen.

Cytogenet Genome Res 102 (1-4):304-308.

Liu R, Sun Y, Zhao G, Wang F, Wu Dan, Zheng M, Chen

J, Zhang L, Hu Y, Wen J 2013 Genome-wide associ-

ation study Identifies Loci and candidate genes for body

(11)

composition and meat quality traits in Beijing-You Chi- cken. PLoS One 8:e61172.

Liu W, Li D, Liu J, Chen S, Qu L, Zheng J, Xu G, Yang N 2011 A genome-wide SNP Scan Reveals Novel Loci for Egg Production and Quality Traits in White Leghorn and Brown-Egg Dwarf Layers. PLoS One 6(12):e28600.

Liu X, Zhang H, Li H, Li N, Zhang Y, Zhang Q, Wang S, Wang Q, Wang H 2008 Fine-mapping quantitative trait loci for body weight and abdominal fat traits: effects of marker density and sample size. Poultry Sci 87:1314-1319.

Lwelamira J, Kifaro GC, Gwakisa P 2008 Breeding strategies for improving performance of Kuchi chicken ecotype of Tanzania for production under village conditions. Livest Res Rural Dev 20:11. Available from http://www.lrrd.org/

lrrd20/11/lwel20171.htm (Accessed on Dec. 09. 2012).

Malek M, Lamont SJ 2003 Association of INOS, TRAIL, TGF-β2, TGF- β3 and IgL genes with response to Sal- monella enteritidis in poultry. Genet Sel Evol 35(Suppl.

1):S99-S111.

Muir W M 2003 Incorporating molecular information in breeding programmes: applications and limitations. Poultry Genetics, Breeding and Biotechnology, edited by WM Muir

& SE Aggrey (CABI Publishing, Wallingford, U. K.) pp.

549- 562.

Ordas B, Malvar RA, Hill WG 2008 Genetic variation and quantitative trait loci associated developmental stability and the environmental correlation between traits in maize.

Genet Res 90:385-95.

Paterson AH, Lander ES, Hewitt JD, Peterson S, Lincoln SE, Tanksley SD 1988 Resolution of quantitative traits into Mendelian factors by using a complete linkage map of restriction fragment length polymorphisms. Nature 335:

721-726.

Ribaut JM, Hoisington D 1998 Marker-assisted selection:

new tools and strategies. Trends Plant Sci 3(6):236-239.

Rosario MF, Silva MAN, Coelho AAD, Savino VJM 2008 Selection of traits in poultry breeding using cluster analy- sis. Int J Poult Sci 7:374-378.

Ruane J, Sonnino A 2007 Marker assisted selection as a tool for genetic improvement of crops, livestock, forestry and fish in developing countries: an overview of issues. Marker assisted selection-current status & future perspectives in

crops, livestock, forestry and fish, edited by EP Guima- raes, J Ruane, BD Scherf, A Sonnino & JD Dargie. Food and Agriculture Organization of the United Nations, Rome. pp. 4-13.

Saszanov A, Barkova O, Jaszczak K 2010 QTL in chicken:

a look back and forward- a review. Anim Sci Pap Rep 28 (4):307-314.

Savegnago RP, Buzanskas ME, Nunes BN, Ramos SB, Ledur MC, Nones K, Munari DP 2011 Heritabilities and genetic correlations for reproductive traits in an F2 reciprocal cross chicken population. Genet Mol Res 10(3):1337-1344.

Sewalem A, Morrice DM, Law A, Windsor D, Haley CS, Ikeobi CON, Burt DW, Hocking PM 2002 Mapping of quantitative trait loci for body weight at three, six, and nine weeks of age in a broiler layer cross. Poultry Sci 81:

1775-1781.

Slatkin M 2008 Linkage disequilibrium-understanding the evolutionary past and mapping the medical future. Nat Rev Genet 9(6):477-485.

Taha FA 2003 Patterns of world poultry consumption and production. In: The Poultry Sector in Middle-Income Countries and Its Feed Requirements, The Case of Egypt, E.R.S., Washington, DC, USA, Agriculture and Trade Report No. WRS03-02. pp. 3-14.

Teneva A 2009 Molecular markers in animal genome ana- lysis. Biotechnol Anim Husb 25(5-6):1267-1284.

Tuiskula-Haavisto M, Honkatukia M, Vilkki J, deKoning DJ, Schulman NF, Tanila AM 2002 Mapping of quantitative trait loci affecting quality and production traits in egg layers. Poultry Sci 81(7):919-927.

Vallejo RL, Bacon LD, Liu HC, Witter RL, Groenen MA, Hillel J, Cheng HH 1997 Genetic mapping of quantitative trait loci affecting susceptibility to marek’s disease virus induced tumors in F2 intercross chickens. Genetics 148:

349-360.

Vander BS, vanArendonk JAM 1996 Marker assisted selection in an outbred poultry breeding nucleus, Anim Sci 62:171- 180.

Visscher PM, Haley CS 1999 On the efficiency of marker- assisted introgression. Anim Sci 68:59-68.

Visscher PM, Haley CS, Thompson R 1996 Marker-assisted

introgression in backcross breeding programs. Genetics

(12)

144:1923-1932.

Visscher PM, Posthuma D 2010 Statistical power to detect genetic loci affecting environmental sensitivity. Behav Ge- net 40:728-33.

Wang Y, Zhu Q, Yao YG, Zhao XL, Liu YP 2010 Associ- ation of FATP1 gene polymorphisms with chicken carcass traits in Chinese meat-type quality chicken populations.

Mol Biol Rep 37:3683-3690.

Williams JL 2005 The use of marker-assisted selection in animal breeding and biotechnology. Rev Sci Tech Off Int Epiz 24:379-391.

Wolc A, Arango J, Settar P, Fulton JE, O’Sullivan NP, Preisinger R, Habier D, Fernando R, Garrick DJ, Hill WG, Dekkers JC 2012 Genome-wide association analysis and genetic architecture of egg weight and egg uniformity

in layer chickens. Anim Genet 43(Suppl. 1):87-96.

Wright D, Boije H, Meadows JRS, Bed’hom B, Gourichon D, Vieaud A, Boichard MT, Rubin CJ, Imsland F, Hallböök F, Andersson L 2009 Copy number variation in intron 1 of SOX5 causes the pea-comb phenotype in chickens.

PLoS Genet 5:e1000512.

Yang Y, Christensen OF, Sorensen D 2011 Use of genomic models to study genetic control of environmental variance.

Genet Res 93:125-38.

Yonash N, Bacon LD, Witter RL, Cheng HH 1999 High resolution mapping and identification of new quantitative trait loci (QTL) affecting susceptibility to Marek’s disease.

Anim Genet 30:126-135.

( 접수: 2013. 8. 26, 수정: 2013. 9. 13, 채택: 2013. 9. 16)

수치

Fig.  1.  Total  egg  production  (1,000  tones  represented  on  Y-axis)  of  the  different  continents
Fig.  2.  Classification  of  markers  on  the  basis  of  relationship  between  the  markers  and  the  genes  of  interest.

참조

관련 문서

After first field tests, we expect electric passenger drones or eVTOL aircraft (short for electric vertical take-off and landing) to start providing commercial mobility

1 John Owen, Justification by Faith Alone, in The Works of John Owen, ed. John Bolt, trans. Scott Clark, "Do This and Live: Christ's Active Obedience as the

In the process, we explore machine learning approaches for robotic path planning, multi constrained optimal path computation and sensor based wearable assistive devices

By simple analysis to fine the relation between the characteristics of subjects and use of PERS for the recent 6 months, marital status, religion,

To solve this problem, GTAW assisted Friction Stir Welding method developed (TIG assisted FSW system) exhibited more than 80% the tensile strength of the

 Enhancement of Formability  Microstructure control : Metal forming by applying electric current during deformation Electrically-Assisted Manufacturing

treat wide wide wide wide necked necked necked necked aneurysms aneurysms aneurysms aneurysms that that that that selection selection selection selection of of

Biochemical markers of bone turnover can be classified according to the process that underlie in markers of bone formation, products of the osteoblast