거주지와 산업단지간의 거리와 혈 중 납 농도 및 요 중 카드뮴 농도의 상관관계에 관한 연구
허진아·김효미·이종태† 고려대학교 보건과학대학 환경보건학과
A Study of the Relationships Between Proximity to an Industrial Complex and Blood Lead Levels and Urinary Cadmium Levels
Jina Heo, Hyo-Mi Kim, and Jong-Tae Lee†
Department of Environmental Health, College of Health Science, Korea University, Seoul, Korea
ABSTRACT
Objectives: The goal of this study was to investigate the relationships between proximity to an industrial complex and blood lead levels and urinary cadmium levels.
Methods: We conducted a questionnaire survey and analyzed blood lead and urinary cadmium levels using Atomic Absorption Spectrometry (AAs). Data was analyzed using logistic regression analysis. All statistical analyses were conducted with SAS software version 9.2. The distance between the residence and an industrial complex was calculated through a Geographical Information System (GIS).
Results: A total of 967 residents living near a large petrochemical complex in Ulsan participated. The geometric mean levels of blood lead and urinary cadmium were 1.70 µg/dl (male: 1.77 µg/dl, female: 1.67 µg/dl), and 0.72 µg/g creatinine (male: 0.49 µg/g cr. female: 0.89 µg/g cr.), respectively. Blood lead and urinary cadmium levels both increased with age and were higher among smokers compared to never smokers. Both significantly showed a decreasing trend with rising income. Results from multiple logistic regression analysis showed that urinary cadmium levels for subjects aged less than 20 years old were negatively associated with distance from the industrial area to the residence. The results, however, indicated that the blood lead levels were positively associated with the distance.
Conclusions: The results of this study support that proximity to an industrial complex is related to urinary cadmium values for children. A positive finding with blood lead can be explained by the ambiguity of lead exposure sources in the general environment.
Keywords: blood lead levels, urinary cadmium levels, industrial complex
I. 서 론
산업단지는 공업용으로 개발되어 산업시설이 들어 서는 일정한 지역으로 수많은 시설이 밀집되어 있기 때문에 산업폐수, 폐기물, 매연, 악취 등 각종 환경
오염물질들이 더 많이 배출되는 주요 오염원이다. 이 에 따라 산업단지 주변은 다른 지역보다 환경오염물 질에 대한 노출가능성이 더 높다.1-3)
우리나라는 1960년대 경제개발 5개년 계획을 시 작으로 급속한 경제성장을 이루었으며 특히 울산광
†
Corresponding author: Department of Environmental Health, College of Health Science, Korea University, Seoul 136- 703, Korea, Tel: +82-2-940-2867; Fax: +82-2-2298-0248, E-mail: [email protected]
Received: 30 January 2012, Revised: 27 March 2012, Accepted: 20 April 2012
역시는 경제개발 계획의 핵심 지역으로서 특정공업 지구로 지정되어 국가공단이 형성되었다. 정유공장, 비료, 합성수지, 합성섬유 등을 시작으로 1970년 이 후에는 기계금속, 자동차, 화학 및 석유화학공장들이 울산공업단지와 온산공업단지에 입주했다. 환경오염 물질의 배출량이 가중됨에 따라 1970-1980년대에는 심각한 환경오염문제가 대두되었다.4)
환경오염으로 인한 건강영향문제가 대두됨에 따 라, 환경오염물질의 인체노출 수준을 용량적, 생화 학적으로 평가할 수 있는 수단으로서 인체노출조사 (HBM, Human Biomonitoring)가 시작되었다.5) 1960 년대 농약의 노출조사로 시작된 미국의 인체노출조 사는 국민건강영양조사(NHANES)로 발전하여 진행 되었으며, 독일에서는 1985년 German Environmental Survey(GerES)를 통해 노출수준을 조사하고 환경오 염물질에 대한 국가의 참고값(Reference value) 및 환경오염물질 노출의 가이드라인(HBM I, II)을 만 들었다.6) 국내에서는 2004년 울산지역을 대상으로 한 “지역주민 환경오염 노출수준 및 생체지표 모니 터링” 사업을 시작으로 포항, 광양, 시화반월 등 산 단지역을 대상으로 한 노출조사가 진행되고 있으며, 2005년에는 국민 생체시료를 대상으로 유해물질 실 태조사가 시작되었다.
한편, 중금속은 납, 카드뮴, 수은, 구리, 비소 등 일 반적으로 비중이 4 g/cm3 이상인 금속원소를 말하 며 자연적으로 지각이나 모래, 수환경 내에 존재한 다. 산업화로 인해 배출량이 늘어남에 따라 농도가 급격하게 증가하였는데, 이러한 중금속은 자연분해 또는 파괴되지 않아 환경 중에서 뿐만 아니라 체내 에서도 잘 배출이 되지 않고 축적되어 음식섭취, 음 용수, 호흡 등을 통해 장기간 노출이 되면 건강영향 을 받게 된다.7)
이러한 중금속 중에서도 납과 카드뮴에 대한 건강 영향은 다양한 연구와 리뷰를 통해 그 유해성이 밝 혀졌다.8) 예를 들어, 납에 장기간 노출되면 급성 또 는 만성적인 신경계 손상을 유발하며, 카드뮴에 대 한 노출은 신장 기능저하, 폐쇄성 폐질환 유발 및 호흡기계 손상을 유발한다.7) 이러한 중금속으로 인 한 건강영향을 예방하기 위해서는 중금속 노출에 대 한 감시와 관리가 필요하다. 따라서 이번 연구에서 는 다양한 경로를 통해 인체에 노출될 수 있는 대 표적인 중금속인 납과 카드뮴을 대상물질로 선정하
였다.
사람들은 대부분의 시간을 거주지에서 보내며, 거 주지를 중심으로 생활이 이루어지기 때문에9,10) 거주 지의 위치는 그 사람의 노출수준과 관련이 있을 것 으로 가정하였다. 따라서 본 연구에서는 울산 지역 주민들을 대상으로 거주지로부터 산업단지와의 거리 와 혈 중 납, 요 중 카드뮴 농도와의 상관관계에 대 하여 살펴보고자 한다.
II. 연구대상 및 방법 1. 연구대상
연구대상지역은 “지역주민 환경오염 노출수준 및 생체지표 모니터링사업”이 진행되는 울산으로 하였 다. 이 사업은 장기간 추적조사를 하는 코호트 연구 로 2003년(1차년도)부터 2010년(7차년도)까지 진행 되었으며 본 연구는 2010년 참가자를 대상으로 하 였다. 코호트 모집은 기존 참여자를 대상으로 한 개 별 전화모집과 교육청을 통한 학교 섭외로 이루어졌 으며, 모든 참여자를 대상으로 참가동의여부를 확인 하였다. 2010년 참가자는 총 1020명이었으며, 이 중 주소지가 불분명하거나 혈 중 납, 요 중 카드뮴 농 도 데이터가 없는 경우를 제외한 총 967명을 연구 대상으로 선정하였다.
2. 설문조사 및 시료채취
각 연구대상자로부터 설문지를 작성하도록 하였 다. 설문지는 국립환경과학원의 ‘환경보건자료 통합 관리 시스템 개발’ 사업에서 도출한 표준화된 설문 지를 이용하였다. 설문항목은 인적사항, 당일기록, 거 주환경, 실외환경, 생활습관, 식이습관, 질병 및 약 물복용력, 사회심리적 스트레스, 알레르기 증상, 시 간활동양상, 신체활동력, 직업노출, 여성력, 인구학적 특성 등 모두 300여 항목의 다양한 문항을 포함하였다.
또한 혈 중 납 및 요 중 카드뮴 분석을 위해 혈액 시료 20 ml, 요 시료 50~100 ml를 채취하였다.
3. 시료분석
혈 중 납과 요 중 카드뮴을 분석하기 위하여 산 처리가 끝난 시험관에 혈액과 요 0.1 ml을 각 시험 관에 넣고 0.1% TritonX-100 1.5 ml, 1% HNO3
0.1 ml을 넣어 vortex로 혼합한 뒤 분석하였다. 시료
분석은 서울 의과학연구소에서 수행되었으며, 분석 기기로는 원자흡수분광광도계(AA280Z, Varian, Australia)를 이용하였다. 분석에 이용된 AAS의 분 석조건은 Table 1과 같다.
4. 통계분석
혈 중 납 농도와 요 중 카드뮴 농도의 성별, 연령, 소득수준, 흡연 및 간접흡연 여부에 따른 차이를 분 석하기 위하여 SAS 프로그램의 Generalized linear model(GLM)을 이용하였다. 이는 t-test(두 그룹), ANOVA(세 그룹 이상), 일반선형회귀모형(연속형)의 결과와 같다. 분석대상자의 절반정도가 20세 미만이 었으며 일부 분석 항목에 대하여 연령을 구분할 필 요가 있어 20세 미만인 미성년자 그룹과 20세 이상 인 성인그룹으로 나누어서 분석하였다. 생체 내 중 금속 농도와 각 변수와의 관계를 분석하기 위하여 혈 중 납 농도와 요 중 카드뮴 농도의 산술평균을 기준으로 상·하위 그룹으로 나누어 로지스틱 분석 을 시행하였다. 모든 통계분석은 SAS 9.2를 이용하 였다.
5. 거주지와 산업단지 간의 거리산출
설문지를 통해 수집된 거주지 정보와 울산광역시 의 대표적인 산업단지인 SK공단의 위치(울산광역시 남구 황성동 600번지)를 이용하여 거주지와 산업단 지 간의 거리를 산출하였다. 거리산출에는 ArcGIS 10(GIS software package)를 이용하였다.
III. 연구결과
1. 연구대상자의 인구학적 특성 및 생체농도와의 관계 본 연구의 대상자는 총 967명(남자 350명, 여자 670명)으로 여자의 비율(69.3%)이 더 높았다. 혈 중 납 농도 기하평균은 1.70 µg/dl, 요 중 카드뮴 농도 기하평균은 0.72 µg/g crea.로 다른 산단지역에 비해 낮은 편이었다(Fig. 1). 남자의 혈 중 납 농도는 1.77µg/dl로 여자(1.67 µg/dl)보다 유의하게 높았던 반면, 요 중 카드뮴 농도는 0.49 µg/g crea.로 여자
Table 1. Condition of analyzer for analysis of lead in blood and cadmium in urine
Step Lead Cadmium
Temperature (
oC) Time (Sec) Flow (l/min) Temperature (
oC) Time (Sec) Flow (l/min)
1 95 20.0 3.0 85 5.0 3.0
2 130 20.0 3.0 110 20.0 3.0
3 350 10.0 3.0 130 10.0 3.0
4 350 5.0 3.0 500 10.0 3.0
5 750 10.0 3.0 500 30.0 3.0
6 750 4.0 3.0 500 1.0 0.0
7 750 1.0 0.0 1500 0.9 0.0
8 2200 0.7 0.0 1500 3.0 0.0
9 2200 2.0 0.0 2400 3.0 3.0
10 2300 2.0 3.0 - - -
Wavelength : 238.3 nm (lead), 228.8 nm (cadmium)
Fig. 1. Several study results of blood lead levels (a) and urinary cadmium levels (b) for total subjects.
*The results of this study.
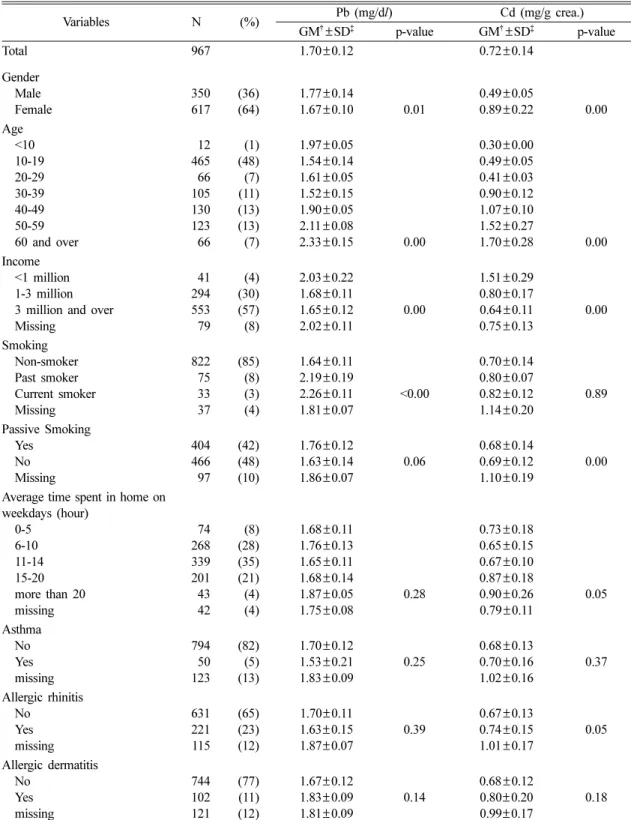
Table 2. Summary statistics of the study population and associations with lead (Pb) and cadmium (Cd) levels
Variables N (%) Pb (mg/dl) Cd (mg/g crea.)
GM
†±SD
‡p-value GM
†±SD
‡p-value
Total 967 1.70 ±0.12 0.72 ±0.14
Gender
Male 350 (36) 1.77 ±0.14 0.49 ±0.05
Female 617 (64) 1.67 ±0.10 0.01 0.89 ±0.22 0.00
Age
<10 12 (1) 1.97 ±0.05 0.30 ±0.00
10-19 465 (48) 1.54 ±0.14 0.49 ±0.05
20-29 66 (7) 1.61 ±0.05 0.41 ±0.03
30-39 105 (11) 1.52 ±0.15 0.90 ±0.12
40-49 130 (13) 1.90 ±0.05 1.07 ±0.10
50-59 123 (13) 2.11 ±0.08 1.52 ±0.27
60 and over 66 (7) 2.33 ±0.15 0.00 1.70 ±0.28 0.00
Income
<1 million 41 (4) 2.03 ±0.22 1.51 ±0.29
1-3 million 294 (30) 1.68 ±0.11 0.80 ±0.17
3 million and over 553 (57) 1.65 ±0.12 0.00 0.64±0.11 0.00
Missing 79 (8) 2.02±0.11 0.75 ±0.13
Smoking
Non-smoker 822 (85) 1.64 ±0.11 0.70 ±0.14
Past smoker 75 (8) 2.19 ±0.19 0.80 ±0.07
Current smoker 33 (3) 2.26 ±0.11 <0.00 0.82 ±0.12 0.89
Missing 37 (4) 1.81 ±0.07 1.14 ±0.20
Passive Smoking
Yes 404 (42) 1.76 ±0.12 0.68 ±0.14
No 466 (48) 1.63 ±0.14 0.06 0.69 ±0.12 0.00
Missing 97 (10) 1.86 ±0.07 1.10 ±0.19
Average time spent in home on weekdays (hour)
0-5 74 (8) 1.68 ±0.11 0.73 ±0.18
6-10 268 (28) 1.76 ±0.13 0.65 ±0.15
11-14 339 (35) 1.65±0.11 0.67 ±0.10
15-20 201 (21) 1.68 ±0.14 0.87 ±0.18
more than 20 43 (4) 1.87 ±0.05 0.28 0.90 ±0.26 0.05
missing 42 (4) 1.75 ±0.08 0.79 ±0.11
Asthma
No 794 (82) 1.70 ±0.12 0.68 ±0.13
Yes 50 (5) 1.53 ±0.21 0.25 0.70 ±0.16 0.37
missing 123 (13) 1.83 ±0.09 1.02 ±0.16
Allergic rhinitis
No 631 (65) 1.70 ±0.11 0.67 ±0.13
Yes 221 (23) 1.63 ±0.15 0.39 0.74 ±0.15 0.05
missing 115 (12) 1.87±0.07 1.01 ±0.17
Allergic dermatitis
No 744 (77) 1.67 ±0.12 0.68 ±0.12
Yes 102 (11) 1.83 ±0.09 0.14 0.80 ±0.20 0.18
missing 121 (12) 1.81±0.09 0.99±0.17
†
Geometric Mean
‡
Geometric Standard Deviation
(0.89 µg/g crea.)보다 낮았다. 대상자의 연령별 비율 은 초등학생이 많아 10대(48%)에 편중되는 경향을 보였으며, 10세 미만, 20대, 60세 이상의 수가 가장 적었다. 혈 중 납 농도, 요 중 카드뮴 농도 모두 연 령이 증가할수록 농도가 증가하는 경향을 나타내었 다. 수입에서는 300만원 이상(57%)이 가장 많았으 며 수입이 증가할수록 농도가 감소하였다. 흡연여부 에 따른 혈 중 납 농도에서는 비흡연자가 과거흡연 자, 현재 흡연자에 비해 유의하게 낮았으며, 요 중 카드뮴 농도는 현재 흡연자, 비흡연자, 과거흡연자 순이었으나 이는 통계적으로 유의하지 않았다. 간접 흡연여부에서는 있다고 한 경우 없다고 한 경우보다 혈 중 납 농도가 더 높았으나 이는 통계적으로 유 의하지 않았으며 요 중 카드뮴 농도는 없다고 한 경 우가 유의하게 높았다. 평일 하루 평균 집에서 보내 는 시간과 혈 중 납, 요 중 카드뮴 농도의 관계를 분석한 결과 유의한 관계가 없는 것으로 나타났다.
대표적인 알레르기 질환인 천식, 알레르기성 비염, 알레르기성 피부염 진단여부에서도 유의한 연관성을
보이지 않았다(Table 2).
2. 로지스틱 회귀분석 결과
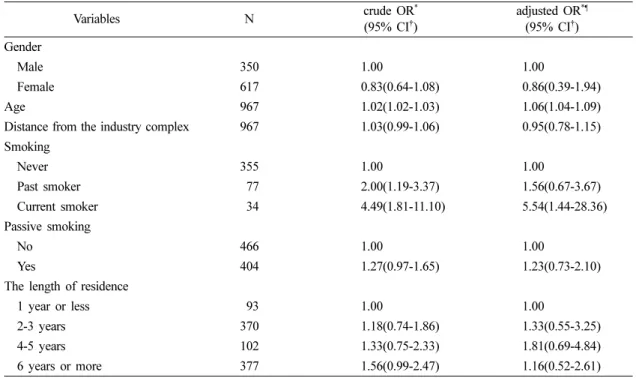
로지스틱 회귀분석의 결과는 OR로 제시하고 있으 며, 이는 독립변수의 일단위 수준 변화(one unit increment)에 대하여 혈 중 납(또는 카드뮴) 수준이 산술평균 이상의 높은 수준일 확률(odds)의 비(ratio) 를 의미한다. 한편 독립변수의 특성이 명목형인 경 우는 위해영향이 가장 낮을 것으로 생각되는 수준을 참고수준(a reference level)으로 정하고 이 때의 확 률을 나머지 수준들에서의 확률과 비교토록 하여 제 시하였다. 전체 대상자를 분석한 결과, 혈 중 납 농 도는 연령이 증가할수록 유의하게 증가하는 것으로 나타났다. 또한 비흡연자에 비해 흡연자의 혈 중 납 농도가 유의하게 높았다. 산업단지와의 거리는 유의 한 요인으로 작용하지 않았다(Table 3). 요 중 카드 뮴은 남자보다 여자가 더 유의하게 높았으며, 연령 이 증가할수록 농도가 증가하는 경향을 보였다. 단 순 로지스틱 분석에서는 산업단지와의 거리가 증가
Table 3. Logistic regression analysis between lead (Pb) and factors for total subjects
Variables N crude OR
*(95% CI
†)
adjusted OR
*¶(95% CI
†) Gender
Male 350 1.00 1.00
Female 617 0.83(0.64-1.08) 0.86(0.39-1.94)
Age 967 1.02(1.02-1.03) 1.06(1.04-1.09)
Distance from the industry complex 967 1.03(0.99-1.06) 0.95(0.78-1.15) Smoking
Never 355 1.00 1.00
Past smoker 77 2.00(1.19-3.37) 1.56(0.67-3.67)
Current smoker 34 4.49(1.81-11.10) 5.54(1.44-28.36)
Passive smoking
No 466 1.00 1.00
Yes 404 1.27(0.97-1.65) 1.23(0.73-2.10)
The length of residence
1 year or less 93 1.00 1.00
2-3 years 370 1.18(0.74-1.86) 1.33(0.55-3.25)
4-5 years 102 1.33(0.75-2.33) 1.81(0.69-4.84)
6 years or more 377 1.56(0.99-2.47) 1.16(0.52-2.61)
*
Odds Ratio
†
Confidence Interval
¶
Model including gender, age, distance between the industry complex and residence, smoking, passive smoking, the length of
residence
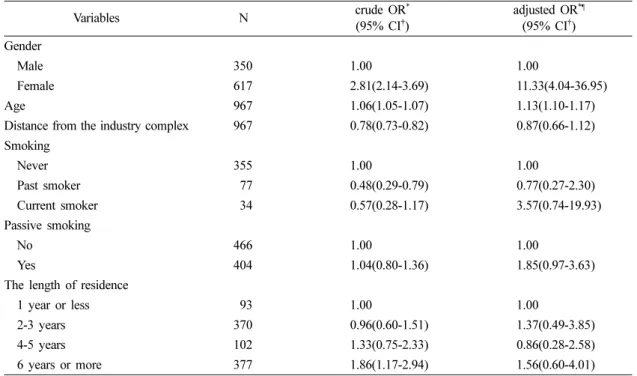
할수록 요 중 카드뮴 농도가 유의하게 감소하는 것 으로 나타났으나, 성별, 연령, 흡연여부, 간접흡연여 부, 거주기간을 보정한 결과에서는 유의하지 않았다 (Table 4).
체내 중금속 농도에 중요한 영향을 미치는 흡연여 부는 성인에게서만 조사하였기 때문에 20세 이상과 20세 미만으로 나누어 로지스틱 회귀분석을 실시해
보았다. 먼저 20세 이상의 경우 납과 카드뮴 모두 산업단지와의 거리와의 유의한 관계를 볼 수 없었 다. 20세 미만에서는 산업단지와의 거리가 증가할수 록 혈 중 납 농도가 유의하게 증가하는 것으로 나 타났으며(OR=1.09[1.05-1.14]), 요 중 카드뮴 농도는 유의하게 감소하는 것으로 나타났다(OR=0.77[0.70- 0.82]) (Table 5).
Table 4. Logistic regression analysis between cadmium (Cd) and factors for total subjects
Variables N crude OR
*(95% CI
†)
adjusted OR
*¶(95% CI
†) Gender
Male 350 1.00 1.00
Female 617 2.81(2.14-3.69) 11.33(4.04-36.95)
Age 967 1.06(1.05-1.07) 1.13(1.10-1.17)
Distance from the industry complex 967 0.78(0.73-0.82) 0.87(0.66-1.12) Smoking
Never 355 1.00 1.00
Past smoker 77 0.48(0.29-0.79) 0.77(0.27-2.30)
Current smoker 34 0.57(0.28-1.17) 3.57(0.74-19.93)
Passive smoking
No 466 1.00 1.00
Yes 404 1.04(0.80-1.36) 1.85(0.97-3.63)
The length of residence
1 year or less 93 1.00 1.00
2-3 years 370 0.96(0.60-1.51) 1.37(0.49-3.85)
4-5 years 102 1.33(0.75-2.33) 0.86(0.28-2.58)
6 years or more 377 1.86(1.17-2.94) 1.56(0.60-4.01)
*
Odds Ratio
†
Confidence Interval
¶
Model including gender, age, distance between the industry complex and residence, smoking, passive smoking, the length of residence
Table 5. Logistic regression analysis between lead (Pb), cadmium (Cd) and distance from the industry complex for adults and children
Variable N crude OR
*(95% CI
†)
adjusted OR
*¶(95% CI
†)
Distance from the industry complex
Pb Adults 490 0.94(0.83-1.06) 0.92(0.75-1.12)
Children 477 1.07(1.03-1.11) 1.09(1.05-1.14)
Cd Adults 490 0.94(0.82-1.08) 0.79(0.59-1.04)
Children 477 0.77(0.72-0.83) 0.77(0.70-0.82)
*
Odds Ratio
†
Confidence Interval
¶
Adults model adjusted for gender, age, smoking, passive smoking and the length of residence, Children model adjusted for
gender, age, passive smoking and the length of residence
IV. 고 찰
본 연구에서는 울산광역시에 거주하는 967명을 대 상으로 거주지와 산업단지 간의 거리와 혈 중 납 농 도 및 요 중 카드뮴 농도의 상관관계를 알아보고자 하였다. 연구 결과, 20세 미만은 거주지와 산업단지 간의 거리가 멀어질수록 혈 중 납 농도가 증가하며, 요 중 카드뮴 농도는 감소하는 것으로 나타났다.
납과 카드뮴은 주변 환경의 다양한 곳에 존재하며 환경오염물질 중 인체에 유해한 영향을 끼치는 대표 적인 중금속이다. 납에 대한 노출원은 주로 가솔린, 산업시설에서의 배출, 페인트 등이며, 호흡기를 통해 흡입되어진다. 그 밖에 수돗물에 함유된 납이 소화 관을 통해 흡수되기도 한다. 독성은 중추, 말초 신 경계, 혈액, 신장, 심혈관, 내분비계, 면역계, 위장관 계, 남성생식기계 등 다양한 곳에서 발생한다.15) 카 드뮴은 금속도금, 배터리, 페인트, 플라스틱의 색소 등으로 많이 사용되며, 직업적 노출이 없는 일반인 의 경우 카드뮴에 대한 노출은 주로 소화기계를 통 해 이루어진다.16)또한 공기 중의 카드뮴 입자가 호 흡을 통해 체내로 들어오기도 하는데, 이는 흡연이 주요 원인이다. 이러한 호흡기계를 통한 노출은 소 화기계를 통한 노출보다 양은 적으나 흡수율은 높 다.17) 카드뮴은 체내에서 잘 배출이 되지 않고 축적 되며 주로 신장에 축적되어 신장질환을 유발한다. 또 한 만성 폐쇄성 폐질환, 폐기종을 일으키며, 심혈관 계, 골격계에 영향을 미친다16).
흡연자는 비흡연자에 비해 혈 중 납 농도와 요 중 카드뮴 농도가 높은 것으로 나타났으며, 이는 타 연 구결과와 같다.18-23) 또한 연령에 따라 생체농도가 증 가하는 경향을 보였으며 이러한 경향은 타 연구결과 에서도 나타났다.24-26)타 연구결과들을 보면 사회경 제적인 수준 또한 혈 중 납 농도 및 요 중 카드뮴 농도와 관계가 있는 것으로 나타난다.27-31)본 연구결 과에서도 수입이 낮을수록 생체 농도가 더욱 높은 것으로 나타났다.
Zheng 등의 연구32)에서 폐기물 재순환 공업지역에 사는 어린이들이 비교지역에 사는 어린이들보다 혈 중 납 농도 및 혈 중 카드뮴 농도가 유의하게 높았 으며, Sanna 등의 연구33)에서 또한 공업지역에 사는 어린이의 혈 중 납 농도가 더 높았다. 그러나 이러 한 연구결과가 나온 지역은 공업시설로부터의 배출
로 인하여 대기 중 납 농도가 다른 지역보다 높았 으나, 본 연구의 대상지역인 울산은 대기 중 납 농 도가 크게 높지 않으며 대기 중 카드뮴 농도는 다 른 지역에 비해 높은 편이다.34,35)
본 연구결과에서는 20세 미만 대상자에서 거주지 와 산업단지간의 거리가 증가할수록 혈 중 납 농도 는 증가하고, 요 중 카드뮴 농도는 감소하는 것으로 나타나 두 중금속이 반대되는 결과를 보였다. 납은 생활주변 도처에 노출원이 존재하여 생활환경의 위 치에 상관없이 다양한 노출원으로부터 노출될 수 있 으나, 카드뮴은 식품으로부터의 섭취를 제외하고는 특정 노출원으로부터 노출되기 때문에 산업단지와의 거리에 있어서 거리가 증가할수록 농도가 감소하는 상관관계가 있었던 것으로 보인다. Lee 등36)의 연구 내용을 보면 울산지역 어린이들의 혈 중 납 농도의 3년 간(1997, 1999, 2000년) 추적조사 결과 공단지 역 인근 어린이들과 교외지역의 납 노출 정도가 해 가 갈수록 비슷한 것으로 추정된다. 이는 공단지역 의 각종 산업체 외의 다른 납의 노출원이 증가되는 것을 원인으로 보고 있다. 본 연구결과에서 거주지 와 산업단지간의 거리가 증가할수록 혈 중 납 농도 가 증가하는 것으로 나온 것은 울산지역에서 납은 산업단지에서만 배출되는 것이 아니라 주변 도로환 경 등 노출원이 다양화됨에 따라 거주환경에 크게 영향을 받지 않기 때문에 이와 같은 결과가 나온 것 으로 생각된다.
또한 20세 미만에서는 중금속 생체농도와 거주지 간의 거리가 유의한 관계를 보였으나, 20세 이상의 성인에게서는 유의한 관계가 나타나지 않았다. 20세 이상과 미만은 생활반경에 있어서 패턴의 차이가 있 기 때문에 거주지가 같더라도 20세 이상과 미만의 중금속 노출 정도에는 차이가 있을 것이다37). 따라 서 이와 같이 연령에 따라 다른 결과가 나온 것으 로 생각된다.
본 연구에는 몇 가지 제한점이 있다. 먼저 울산광 역시에는 각종 석유화학 및 조선소를 비롯한 많은 산업단지가 위치하고 있는데, 산업단지로부터의 거 리를 측정함에 있어 산업단지의 위치를 임의의 한 점으로 정하여 측정하였다. 따라서 거주지와 산업단 지 간의 거리측정에서 오차가 있을 것이라고 생각된 다. 임의로 정한 지점은 산업단지에서 해안가 쪽으 로 위치하기 때문에 내륙에서 거주하는 대부분의 대
상자는 산업단지와의 거리가 실제보다 더 크게 측정 되었을 것이며 이에 따라 결과가 과소평가되었을 가 능성이 있다. 그러나 모든 연구 대상자에 대하여 동 일한 기준으로 거리가 산출되었기 때문에 대상자별 거주지와 산업단지와의 상대적 거리 수준은 변하지 않을 것이므로 본 결과의 타당도에는 큰 영향이 미 치지 않을 것으로 사료된다.
또한, 연구 대상자는 각 연령대 별로 고루 분포하 지 않고, 초등학생 및 주부가 대부분을 차지하고 있 다. 그래서 성비 또한 여성의 비율이 매우 높게 나 타났다. 거주지 역시 울산광역시 내에 고르게 퍼져 있지 않고 일부 지역에 편중된 측면이 있다. 그러나 통계분석 단계에서 연령이나 성비, 거주지역에 대한 요소는 통제변수로 보정하였거나 개별 분석(연령별) 의 결과를 제시하는 등의 방법으로 불확실성을 최소 화 하였다.
본 연구에서는 요 중 카드뮴 농도의 중요한 요인 이 되는 직업노출여부를 조사하였으나 응답자 수가 너무 적어 고려하지 못하였다. 또한 흡연여부에 있 어서 흡연자가 너무 적어 흡연요인의 고려가 어려운 점이 있었다. 그래서 20세 이상과 20세 미만을 나누 어 분석을 실시하였다.
V. 결 론
본 연구에서는 2010년 울산광역시 거주자들을 대 상으로 혈 중 납 농도 및 요 중 카드뮴 농도를 분 석하여 거주지와 산업단지 간의 거리와의 상관관계 를 알아보았으며, 결과는 다음과 같다.
1. 혈 중 납 농도는 여성보다 남성이 유의하게 높 았으며(p=0.01), 요 중 카드뮴 농도는 남성보다 여 성이 유의하게 높았다(p=0.00). 또한 혈 중 납과 요 중 카드뮴 농도 모두 연령이 증가할수록 농도가 증 가하는 경향을 나타냈다(각각 p=0.00).
2. 전체 대상자와 20세 이상에서는 거주지와 산업 단지 간의 거리가 혈 중 납 농도 및 요 중 카드뮴 농도와 연관성이 없었으나, 20세 미만에서는 혈 중 납 농도는 거리가 증가할수록 농도가 증가하며 (OR = 1.09[1.05-1.14]), 요 중 카드뮴 농도는 거리가 증가할수록 농도가 감소하는 것으로 나타났다 (OR = 0.77[0.70-0.82]).
본 연구결과는 거주지 환경에 따라 어린이의 건강
에 미치는 영향이 다르다는 가설을 뒷받침할 수 있 다. 또한 납 및 카드뮴의 발생원이 산업단지 이외에 도 다양하게 존재하므로 이에 대한 추가적인 연구가 필요할 것으로 사료된다.
감사의 글
본 연구는 환경부 국립환경과학원 “지역주민 환경 오염 노출수준 및 생체지표 모니터링(울산)” 사업으 로 지원받은 과제로 이에 감사드립니다.
참고문헌