− 460 −
비만인과 정상인에서 24시간 소변 내 나트륨 배출량과 비만관련 대사위험지표의 관련성
오현우1)·김현정2)·전대원1)·이승민2),†
1)
한양대학교 의과대학 내과학교실,
2)성신여자대학교 식품영양학과
Associations between 24-hour Urine Sodium Excretion Level and Obesity-related Metabolic Risk Factors
Hyun Woo Oh
1), Hyun Jung Kim
2), Dae Won Jun
1), Seung Min Lee
2),†1)
Department of Internal Medicine, Hanyang University College of Medicine, Seoul, Korea
2)
Department of Food and Nutrition, Sungshin Women's University, Seoul, Korea
†Corresponding author Seung Min Lee Department of Food and Nutrition, Sungshin Women's University, 55, Dobong-ro76ga- gil, Gangbuk-gu, Seoul 01133, Korea
Tel: (02) 920-7671 Fax: (02) 920-2076
E-mail: smlee@sungshin.ac.kr
Acknowledgments
This research was supported by a grant (14162MFDS134) from Ministry of Food and Drug Safety in 2014.
Received: October 12, 2015 Revised: December 13, 2015 Accepted: December 24, 2015
ABSTRACT
Objectives: Excess sodium intake has been linked to obesity and obesity-related indices. However, the scientific evidence for this association is inadequate. The purpose of this study was to investigate the association between urinary sodium excretion and obesity-related indices among Korean adults.
Methods: A convenience sample of 120 subjects (60 obese and 60 non-obese subjects) were recruited applying frequency matching for sex and age between two groups.
Sodium intake level was assessed through 24-hour urine collection. Obesity-related metabolic risk factors, including fasting blood lipid indices, subcutaneous and visceral fat through computed tomography (CT), insulin resistance indices, blood pressure and liver enzymes were measured in all subjects. These obesity-related metabolic risk factors were compared between obese and non-obese group according to sodium excretion levels (<110 mEq/day, 110~180 mEq/day, >180 mEq/day).
Results: After adjusting for age, gender, health behaviors (smoking, exercise, drinking), and energy intake, several obesity-related metabolic risk factors, including abdominal circumference, body fat percentage, subcutaneous and visceral fat, triglyceride, and systolic blood pressure were found to be significantly deteriorated as the sodium excretion level increases. In addition, multivariate adjusted-odds ratios of abdominal obesity, high blood triglyceride, and high blood pressure were found significantly higher in the highest sodium excretion group compared to the lowest group. The mean number of metabolic syndrome risk factors was also significantly greater in the highest sodium excretion group than in the lowest group.
Conclusions: The current study findings suggested that high sodium intake can affect obesity and metabolic syndrome risk negatively, implying the necessity of future research on low-sodium diet intervention in relation to obesity and related health problems.
Korean J Community Nutr 20(6): 460~467, 2015
KEY WORDS sodium intake, obesity, 24-hour urine sodium excretion
This is an Open-Access article distributed under the terms of the Creative Commons Attribution Non-Commercial License (http://
creativecommons.org/licenses/by-nc/3.0) which permits unrestricted non-commercial use, distribution, and reproduction in any medium, provided the original work is properly cited.
RESEARCH ARTICLE
—————————————————————————
서 론
—————————————————————————
국민건강영양조사 자료에서 보고한 1일 나트륨 섭취량을 살펴보면 2008년~2010년 각각 4,630.2 mg, 4,645.4 mg, 4,831.1 mg으로 계속 증가하는 추세로 나타났다[1].
이는 1일 2,000 mg인 세계보건기구(world health orga- nization, WHO) 권장수준 보다 상당히 높은 수준이다.
나트륨 과잉 섭취가 고혈압, 심혈관계 질환, 골다공증 및 위염 발생의 원인이 된다는 것은 이미 잘 알려져 있다[2,3].
최근 몇몇 대규모의 코호트 연구 및 단면연구에서 나트륨의 과잉 섭취가 비만 위험 증가와 연관성이 있다는 연구결과가 보고되었다[4-8]. Räisänen 등의 연구에서는 나트륨이 대 사증후군의 독립적 예측인자로 작용하였다[9]. 대사증후군 과 영양소 섭취에 관한 선행연구들을 살펴보면 대사증후군 을 가진 대상자가 정상인보다 나트륨 섭취량이 유의적으로 높았다[10,11]. Hoffmann 등은 766명의 성인을 대상으로 24시간 소변 나트륨 배설량에 따른 대사증후군 요인의 수치 를 살펴보았다[7]. 남, 여 공통적으로 비만지표인 체중, 체 질량지수(body mass index, BMI), 허리둘레 수치 등에서 유의적인 증가가 있었다. 혈압의 경우 남자는 수축기와 이완 기 혈압이, 여자는 이완기 혈압이 증가하였다. 또한 대사증 후군 지표 보유 개수에 따른 나트륨 배설량을 남, 여 각각 살 펴본 결과, 대사증후군 지표를 3개 또는 그 이상 보유한 사 람의 소변에서 나트륨 배설량이 더 많았다[7]. Hu 등은 24 시간 소변 나트륨 배설량에 따른 제2형 당뇨병 발생률을 살 펴보았는데, 나트륨 섭취가 가장 많은 군이 제2형 당뇨병에 걸릴 위험도가 2.05배 높았다[12].
BMI를 기준으로 한 국내 비만 유병율의 경우 1998년에 서 2001년 사이에 25.8%에서 30.3%로 급격하게 증가했 으며 2013년도까지 비만 유병율의 큰 감소현상 없이 31.0%-32.5%사이를 유지하고 있다[1]. 또한 국민건강영 양조사 자료를 이용하여 1998년, 2001년, 2005년, 2007 년의 대사증후군 유병율을 나이를 보정하여 분석한 결과, 대 사증후군 유병율이 24.9%에서 31.3%로 유의하게 증가하 고 있는 것으로 나타났다[13]. 따라서 나트륨 섭취량이 많 고 비만 및 대사증후군 유병율이 증가하고 있는 한국 성인에 서 나트륨 섭취수준과 대사 위험지표의 연관성을 살펴볼 필 요가 있다.
다수의 선행연구에서 나트륨섭취량을 파악을 위하여 회상 기억에 의존한 1일 식사일기를 사용하였거나, 비만의 중요 관련지표인 인슐린저항성이나 내장지방량에 대한 평가는 없 었다는 한계가 있다. 또한 이러한 나트륨의 과잉섭취가 인슐
린 저항성을 포함한 대사지표에 미치는 영향에 대하여서도 알려진 바가 적다. 이에 본 연구는 나트륨 섭취량과 비민관 련 대사 위험지표와의 연관성을 살펴보기 위해 비만군과 대 조군간 24시간 소변검사를 이용해 나트륨 섭취수준을 비교 하고 나트륨 섭취수준과 비만 및 복부지방, 인슐린저항성 등 대사 위험지표간의 연관성을 분석하고자 하였다.
—————————————————————————
연구대상 및 방법
—————————————————————————
1. 연구대상자
일반검진을 목적으로 병원을 방문한 내원자와 보호자들을 대상으로 광고를 통해, 일반인 총 120명을 모집하였다. 성 별(각 군의 여성 대상자 비율 75%)과 연령분포(5세 단위로 구분)에 대한 frequency matching을 적용하여 60명의 비 만군과 60명의 대조군(60명)으로 분류되었다. 비만군의 체 질량지수(body mass index, BMI) 기준은 25 kg/m
2이 상이었으며, 대조군의 BMI 기준은 18.5~22.9 kg/m
2이었 다. 연구대상자의 선정기준은 만 19세 이상 & 60세 미만, 본 연구의 목적과 연구수행 내용에 동의한 경우, 악성 종양 을 가지고 있더라도 완치판정을 받고 1년 이상 경과된 경우, 식이에 영향을 미치는 소화기계 및 만성질환이 없는 자였으 며, 제외기준에는 최근 3년 이내 위 수술을 받은 경우, 최근 3년 이내 갑상선 전절제술을 시행 받은 경우, 간질환, 심장질 환, 신장질환으로 병원에 주기적으로 방문하여 약물을 복용 중인 경우, 일주일에 알코올 섭취량이 남자의 경우 210 g 이 상 여자의 경우 140 g 이상인 경우, 당뇨조절을 위하여 당 뇨조절 약물을 사용하는 경우, 악성종양을 가지고 있거나 완 치되지 않는 경우, 체중조절 또는 건강관리를 목적으로 식이 조절을 하는 경우 등이 포함되었다. 모든 연구대상자들에게 는 연구의 목적에 대하여 미리 설명하고 연구 참여에 대한 동 의를 얻었으며, 임상연구윤리심의위의 승인 후, 2014년 02 월 01일에서 2014년 11월 30일까지 10개월간 진행되었 다(CRIS : KCT0001084)
2. 신체계측
자동 신장계를 이용하여 키와 체중을 측정하고 체질량지 수를 계산하였으며, 허리둘레는 줄자를 이용하여 양쪽 장골 능의 가장 높은 부위 2 cm 위에 줄자를 대고 호기상태에서 바닥과 수평하게 측정하였다. 3회 반복하며 옷의 두께는 포 함하지 않았고, 단위는 0.1 cm까지 기록 하였다. 혈압은 안 정된 상태에서 긴장을 풀고 오른팔을 넣어 자동혈압계로 측 정하였다. 측정도중에 말을 하거나 움직이지 않도록 하였다.
체지방량 및 분포 계측은 INBODY (INBODY 520 body
composition analysis)를 이용하여 체성분분석(체수분, 단 백질, 무기질, 체지방), 골격근-지방(체중, 골격근량, 체지 방량), 비만진단(체지방률, 복부지방률) 등을 측정하였다.
복부지방량 및 내장지방량 검사는 총 16 슬라이스 이상의 다검출기 컴퓨터 단층촬영(multi detector computed tomohraphy, MDCT)을 이용하고 매일 감쇄 보정을 받았 다. 방사선 피폭 선량을 줄이기 위해 복부에 사용되는 저선 량 기법(120 kVp, 50-75 mAs)을 사용하였고 절편두께 는 5 mm로 하였다.
3. 혈액검사
혈액검사는 12시간 공복상태에서 채혈한 혈액을 원심분 리기에 돌린 후, 혈청 1 ml을 각각 0.5 ml tube 2곳으로 나 누어 e-tube에서 분주하여 섭씨 영하 70도 냉동고에 보관 하였다. 공복 혈당, 중성지질, HDL-콜레스테롤, 공복 인슐 린, alanine transferase(ALT), aspartate transferase (AST), gamma-glutamyl transferase(gamma-GGT), 등의 항목을 Bayer Reagent Packs 을 이용하여 자동생화 학 분석장비(Advia 1650 Autoanalyzer, Bayer Diag- nostics, Leverkusen, Germany)를 이용하여 측정했다.
인슐린저항성의 지표로서 homeostasis model assess- ment of insulin resistance(HOMA-IR)를 이용하였다.
HOMA-IR 수치는 아래의 공식을 적용하여 산출하였다.
HOMA-IR = [fasting insulin(IU/mL) × fasting plasma glucose(mg/dl)] / 22.5
4. 24 시간 소변 분석을 통한 나트륨 섭취수준 파악
전날 아침 두 번째 소변부터 다음날 첫 번째 소변까지의 24시간 소변을 방부 처리된 소변통에 수집하도록 하였고 수 집된 소변은 총량을 측정한 후 정확한 소변의 양이 수집되었 는지 확인하기 위하여 소변 중의 크레아티닌 농도를 측정하 였다. 만약 24시간 소변 내 크레아티닌이 600 mg 이하이거 나 3,200 mg 이상인 경우는 분석에서 제외하였다.
5. 통계분석
비만군과 대조군 간 24시간 소변검사 나트륨 배설량, 비 만 관련 위험지표 등의 비교는 t-test, chi-square test를 이용하였다. 소변검사를 통한 나트륨 섭취량과 비만 및 복부 비만, 혈중 인슐린 저항증 지표, 신체구성, 복부 및 내장 지 방량의 상관성 분석에는 partial Spearman correlation analysis를 사용하여 공변수로 연령(세)와 에너지섭취량 (kcal/일)을 포함시켜 분석하였다. 대상자의 나트륨 배설량 자료의 대략적인 3분위 값을 적용하여 <110 mEq/일, 110~180 mEq/일, >180 mEq/일의 3군으로 나누었다. 나 트륨 배설수준에 따른 비만, 복부비만, 혈중 지질, 혈중 인슐 린 저항증 지표, 신체구성, 복부 및 내장 지방량, 간효소 수
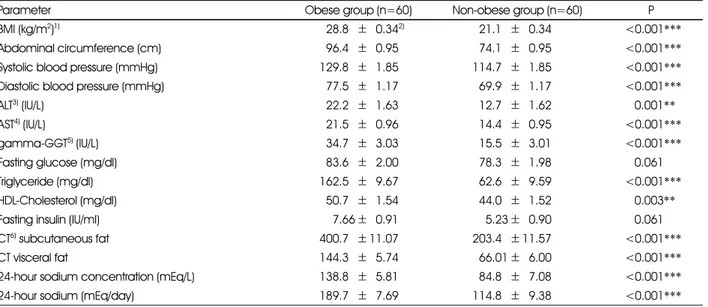
Table 1. Comparison of obesity and obesity-related metabolic indices between obese and non-obese groups
Parameter Obese group (n=60) Non-obese group (n=60) P
BMI (kg/m2)1) 528.85±50.342) 521.15±50.34 <0.001***
Abdominal circumference (cm) 596.45±50.95 574.15±50.95 <0.001***
Systolic blood pressure (mmHg) 129.85±51.85 114.75±51.85 <0.001***
Diastolic blood pressure (mmHg) 577.55±51.17 569.95±51.17 <0.001***
ALT3) (IU/L) 522.25±51.63 512.75±51.62 0.001**
AST4) (IU/L) 521.55±50.96 514.45±50.95 <0.001***
gamma-GGT5) (IU/L) 534.75±53.03 515.55±53.01 <0.001***
Fasting glucose (mg/dl) 583.65±52.00 578.35±51.98 0.061
Triglyceride (mg/dl) 162.55±59.67 562.65±59.59 <0.001***
HDL-Cholesterol (mg/dl) 550.75±51.54 544.05±51.52 0.003**
Fasting insulin (IU/ml) 557.66±50.91 555.23±50.90 0.061
CT6) subcutaneous fat 400.75± 11.07 203.45± 11.57 <0.001***
CT visceral fat 144.35±55.74 566.01±56.00 <0.001***
24-hour sodium concentration (mEq/L) 138.85±55.81 584.85±57.08 <0.001***
24-hour sodium (mEq/day) 189.75±57.69 114.85±59.38 <0.001***
1) BMI: body mass index 2) Mean± SE
3) ALT: alanine transferase 4) AST: aspartate transferase 5) GGT: glutamyl transferase 6) CT: computed tomography
**: p < 0.01, ***: p < 0.001
치의 평균 비교와 대사증후군 위험지표 보유 개수의 평균 비 교에는 ANCOVA test와 Tukey-Kramer's multiple comparison test를 사용하였다. 아울러 multiple logistic regression analysis를 적용하여 나트륨 배설수준에 따른 대사증후군 위험지표 및 대사증후군의 오즈비와 95% 신뢰 구간을 산출하였다. 상기 ANCOVA test와 multiple logistic regression analysis에서 연령(세), 성별(남/여), 흡연 (비흡연/과거 흡연/현재 흡연), 음주(비음주/월 1회 미 만/월 1~4회/월 5회 이상), 신체활동(거의 하지 않음/주 1~2회/주 3회 이상), 에너지섭취량(kcal/일) 등에 대하여 통계적 보정을 적용하였으며 모든 통계적 분석에는 SAS program version 9.2(SAS Inc., Cary, NC, USA)를 사용하였다.
—————————————————————————
결 과
—————————————————————————
본 연구에 참여한 비만군과 정상군의 성별분포(두 군 모두 여성 대상자 75.0%)와 평균 연령(비만군: 38.9±0.72세, 대조군: 37.3±1.52세)은 군간 유의한 차이가 없었다. Table
1은 비만군과 정상군의 비만도 및 비만 관련 대사적 위험지 표의 수치를 비교한 결과이다. 24시간 소변검사를 통하여 측 정한 나트륨 배설량이 정상군에 비하여 비만군에서 유의하 게 높게 나타났다(P < 0.001). 또한 비만군에서 허리둘레, 혈압, 간효소 수치, 혈중 중성지방, HDL-콜레스테롤, CT 로 측정한 복부지방량 및 내장지방량 등의 다양한 위험지표 들의 수치가 유의하게 높았다(P=0.003~P < 0.001).
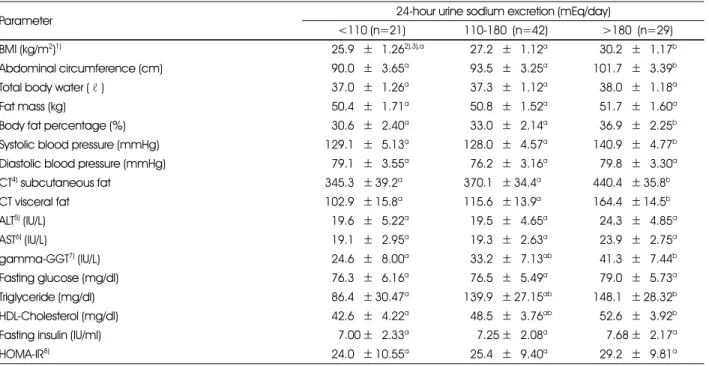
24시간 소변검사법으로 측정한 연구대상자의 나트륩 배 설량을 110 mEq/일 미만, 110~180 mEq/일, 180 mEq/
일 이상의 세 군으로 나누어 다양한 비만 및 관련 위험지표 의 평균을 비교한 결과를 Table 2에 제시하였다. 성별, 연 령, 흡연, 음주, 신체활동, 에너지섭취량에 대하여 보정한 후 비교한 결과, 나트륨 배설량이 180 mEq/일 이상인 군이 110 mEq/일 미만인 군에 비하여 체질량지수, 허리둘레, 체 지방률, 수축기혈압, CT 복부지방량, CT 내장지방량, gamma-GGT, 중성지질, HDL-콜레스테롤이 유의하게 높 게 나타났다(P < 0.05).
24시간 소변으로 측정한 나트륨 배설량과 비만관련 위험 지표의 연관성을 상관분석을 살펴본 결과에서도(Table 3)
Table 2. Comparison of obesity and obesity-related metabolic indices according to 24-hour urine sodium excretion levels
Parameter 24-hour urine sodium excretion (mEq/day)
<110 (n=21) 110-180 (n=42) >180 (n=29)
BMI (kg/m2)1) 525.95±51.262),3),a 527.25±51.12a 530.25±51.17b
Abdominal circumference (cm) 590.05±53.65a 593.55±53.25a 101.75±53.39b
Total body water (ℓ ) 537.05±51.26a 537.35±51.12a 538.05±51.18a
Fat mass (kg) 550.45±51.71a 550.85±51.52a 551.75±51.60a
Body fat percentage (%) 530.65±52.40a 533.05±52.14a 536.95±52.25b
Systolic blood pressure (mmHg) 129.15±55.13a 128.05±54.57a 140.95±54.77b Diastolic blood pressure (mmHg) 579.15±53.55a 576.25±53.16a 579.85±53.30a
CT4) subcutaneous fat 345.35± 39.2a 370.15± 34.4a 440.45± 35.8b
CT visceral fat 102.95± 15.8a 115.65± 13.9a 164.45± 14.5b
ALT5) (IU/L) 519.65±55.22a 519.55±54.65a 524.35±54.85a
AST6) (IU/L) 519.15±52.95a 519.35±52.63a 523.95±52.75a
gamma-GGT7) (IU/L) 524.65±58.00a 533.25±57.13ab 541.35±57.44b
Fasting glucose (mg/dl) 576.35±56.16a 576.55±55.49a 579.05±55.73a
Triglyceride (mg/dl) 586.45± 30.47a 139.95± 27.15ab 148.15± 28.32b
HDL-Cholesterol (mg/dl) 542.65±54.22a 548.55±53.76ab 552.65±53.92b
Fasting insulin (IU/ml) 557.00±52.33a 557.25±52.08a 557.68±52.17a
HOMA-IR8) 524.05± 10.55a 525.45±59.40a 529.25±59.81a
1) BMI: body mass index 2) Mean± SE
3) Adjusted for age (years), sex, smoking (no smoking, previous smoking. current smoking), drinking (no drinking, 1~4 times/month,
>=5 times/month), physical activity (rarely, 1~2 times/week, >=3 times/week), energy intake (kcal/day) 4) CT: computed tomography
5) ALT: alanine transferase 6) AST: aspartate transferase 7) GGT: glutamyl transferase
8) HOMA-IR: homeostasis model assessment of insulin resistance
ab: Different alphabet letters within a row represent significant difference (p < 0.05) by Tukey-Kramer’s multiple comparison test.
나트륨 배설량과 일부 비만관련 위험지표 간의 유의한 양의 상관성이 관찰되었다. BMI(r=0.49, P < 0.001), 허리둘 레(r=0.44, P < 0.001), CT 복부지방량(r=0.38, P <
0.001), CT 내장지방량(r=0.44, P < 0.001), 공복 인슐 린(r=0.30, P < 0.001), HOMA-IR(r=0.29, P < 0.001) 이 24시간 소변 나트륨 배설량과 유의한 양의 상관관계를 가 지는 것으로 나타났다.
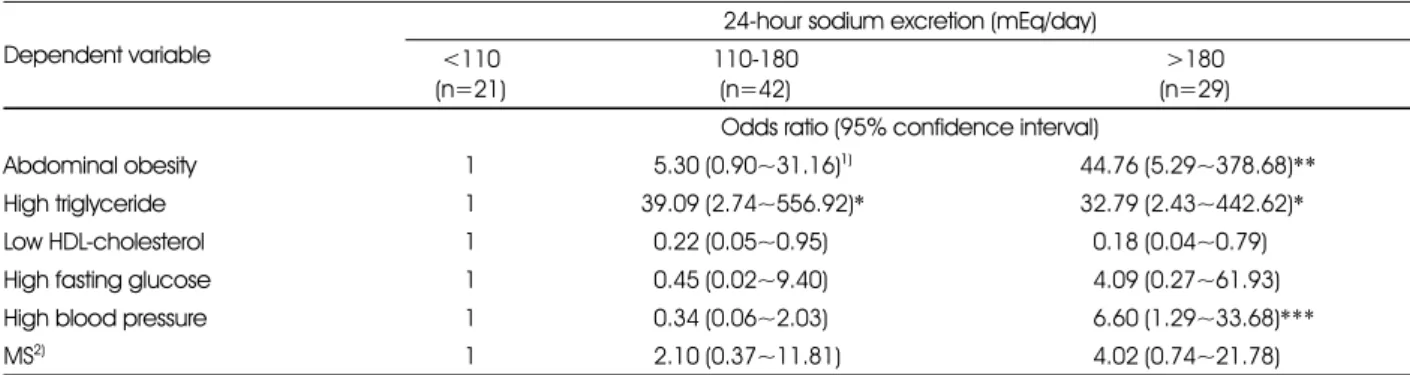
Table 4은 24시간 소변 나트륨 배설수준에 따른 대사증 후군 위험지표 및 대사증후군의 오즈비를 살펴본 결과이다.
나트륨 배설량이 가장 적은 군에 비하여 가장 높은 군의 복 부비만, 고중성지방혈증, 고혈압의 오즈비가 유의하게 높았 다. 평균 대사증후군 위험 지표의 개수는 나트륨 배설량이 가 장 낮은 군 2.02개에서 가장 높은 군 2.91개로 유의하게 증 가하였다(Figure 1, P < 0.05).
—————————————————————————
고 찰
—————————————————————————
최근 나트륨의 과잉 섭취가 에너지 섭취량과 독립적으로 비만과 연관이 있다는 연구결과가 보고되었다[4-8]. 이러 한 나트륨 섭취와 비만의 연관성을 알아보기 위해서는 나트 륨을 정확하게 측정하는 것이 중요하다. 그러나 현재까지 현 재 나트륨 섭취량을 평가하는 객관적인 표준화된 방법은 제 시되어 있지 않다. 24시간 소변 수집을 통한 나트륨 섭취량 이 가장 정확하다고 알려져 있으나 다수로부터 24시간 소변 을 채취하는 것이 어렵고[14,15], 회상에 의한 식사일기방 법은 부정확하며 식품모델 및 목측량 책을 이용하더라도 나 트륨량을 정확히 반영하지 못할 가능성이 높다. 본 연구 결 과에서는 소변을 이용한 24시간 나트륨 배설량이 비만 및 인 슐린 저항성을 포함한 비만관련 대사지표와 의미있는 양의 상관관계를 보였다.
Table 4. Odds radios of metabolic syndrome risk factors and metabolic syndrome according to 24-hour sodium excretion levels
Dependent variable
24-hour sodium excretion (mEq/day)
<110 (n=21)
110-180 (n=42)
>180 (n=29) Odds ratio (95% confidence interval)
Abdominal obesity 1 55.30 (0.90~31.16)1) 44.76 (5.29~378.68)**
High triglyceride 1 39.09 (2.74~556.92)* 32.79 (2.43~442.62)*
Low HDL-cholesterol 1 50.22 (0.05~0.95) 50.18 (0.04~0.79)
High fasting glucose 1 50.45 (0.02~9.40) 54.09 (0.27~61.93)
High blood pressure 1 50.34 (0.06~2.03) 56.60 (1.29~33.68)***
MS2) 1 52.10 (0.37~11.81) 54.02 (0.74~21.78)
1) Adjusted for age(years), sex, smoking (no smoking, previous smoking. current smoking), drinking(no drinking, 1~4 times/month,
>=5 times/month), physical activity(rarely, 1~2 times/week, >=3 times/week), energy intake (kcal/day) 2) MS : Metabolic syndrome
*: p < 0.05, **: p < 0.01, ***: p < 0.001
Table 3. Spearman correlation coefficient between obesity- related indices and 24-hour urine sodium excretion levels
Variables r
BMI1) 0.492)***
Abdominal circumference 0.44***
CT3) subcutaneous fat 0.38***
CT visceral fat 0.44***
Fasting insulin 0.30**
HOMA-IR4) 0.29**
1) BMI: body mass index
2) Adjusted for age (years) and energy intake (kcal/day) 3) CT: computed tomography
4) HOMA-IR: homeostasis model assessment of insulin resis- tance
**: p < 0.01, ***: p < 0.001 by partial Spearman correlation analysis
Fig. 1. Mean numbers1) of metabolic syndrome risk factors according to according to 24-hour sodium excretion levels
1) Adjusted for age(years), sex, smoking(no smoking, previous smoking. current smoking), drinking(no drinking, 1~4 times/
month, >=5 times/month), physical activity(rarely, 1~2 times/
week, >=3 times/week), energy intake (kcal/day)
Different alphabet letters represent significant difference (p <
0.05) by Tukey-Kramer’s multiple comparison test
본 연구에서 주목한 중요한 비만관련 지표중 하나는 CT 촬영을 통한 복부 내장지방 및 피하지방이다. 비만에 동반되 는 고혈압, 고지혈증, 제2형 당뇨병, 심혈관 질환 등의 여러 합병증의 유병률이 비만의 정도보다는 체지방의 분포와 보 다 큰 상관관계가 있는 것으로 알려져 있다. 즉 비만의 형태 중 복부에 지방 축적이 더 많은 복부 비만에서 둔부 등에 지 방 축적이 더 많은 둔부 비만보다 심혈관 질환의 발병이 많 은 것으로 알려져 있다[16,17]. Fujioka 등은 CT로 측정 한 내장지방 면적 및 피하지방 면적의 비(V/S Ratio;
Visceral -Subcutaneous Fat Ratio)가 0.4 이상인 경우 를 내장형 비만이라고 하였으며, 이 경우 대사이상 및 심혈 관 질환의 위험이 높다고 하였다[18]. 본 연구에서는 상관 분석을 통하여 24시간 소변검사의 나트륨배설량과 CT 복 부지방량 및 내장지방량이 모두 유의한 연관성이 있음을 관 찰하였다.
한편 대사증후군 유병률과 식행동 혹은 식행동과 나트륨 섭취량과의 연관성에 대한 단면연구들은 발표된 바 있으나 나트륨 섭취량, 특히 24시간 소변과 대사증후군에 대해 직 접적인 연관성을 비교한 연구는 드물다. Chen 등은 순차적 으로 저염식이와 고염식이를 시행하여 대사증후군의 관계를 살핀 연구에서 대사증후군이 있는 실험군에서 유의하게 나 트륨 배설량이 높았으며 저염식이 시행 시 혈압이 감소하는 효과를 보여 나트륨섭취가 대사증후군의 위험인자와 연관성 이 있음을 제시하였다. 또한 나트륨 배설량은 대사증후군의 위험인자 개수와도 연관이 있었다[19]. Lee 등은 463명을 대상으로 나트륨 배설량과 비만관련 인자 및 대사증후군의 연관관계를 분석하여, 대사증후군의 유병률, 고혈압과 유의 한 상관관계가 있음을 보고하였다. 아울러 여성에서 나트륨 배설량의 증가가 대사증후군 위험인자의 개수와 유의한 연 관성이 있음을 확인하였다[20]. 그러나 두 연구에서 모두 인 슐린저항성에 관련한 연구 자료는 없었다. 본 연구에서는 나 트륨배설량의 증가와 복부비만과 중성지방, 고혈압, 대사증 후군 위험인자의 개수가 유의한 연관성이 있음을 확인하였 다. 또한 상관분석을 통하여도 나트륨배설량의 증가와 인슐 린저항성이 유의한 연관이 있음을 확인하였다.
저나트륨 식이가 인슐린저항성에 미치는 영향은 매우 다 양하게 보고되어 아직 정립된 정설이 없는 상태이다[21- 44]. 대부분 단기간, 소규모의 연구였거나 또는 저염식이가 고혈압에 대해 미치는 영향에 대한 연구에서 이차적으로 산 출된 자료를 모아 분석한 것으로 해석에 주의가 필요하다. 그 간의 발표된 실험연구를 모아놓고 봤을 때[21,22,25,29, 36,42], 연구마다 나트륨 제한의 정도, 연구기간 및 인슐린 저항성 평가기준이 모두 달라 공통된 결론을 이끌어내기 어
렵다. 즉 인슐린저항성의 평가법으로 euglycemic clamp test, oral glucose tolerance test(OGTT), HOMA 등 이 사용되어 연구들 간의 객관적인 비교가 어려우며 연구기 간 역시 5~8일에서 2주 이상까지 실험기간이 다양하다.
본 연구를 포함한 기존의 단면 연구의 단점은 나트륨과 비 만과의 연관성을 보여 줄 수 있으나 인과관계를 증명할 수 없 는 구조적인 문제점이 있다. 나트륨을 많이 섭취하는 사람이 섭취하는 에너지 섭취량이 많고 인스턴트 가공식품이나 과 당이 많이 포함되어 있는 음료를 많이 마시게 되어 총 에너 지 섭취량 증가에 의한 이차적인 현상인지[45, 46] 또는 나 트륨 섭취 자체가 대사에 영향을 미쳐 비만 발생에 직접적인 원인이 되는지 그 기전이 밝혀지지 않아 이에 대한 연구가 필 요한 상태이다[42]. 아울러 본 연구에서 사용한 1일치의 24 시간 소변 나트륨 배설량은 식사조사법에서 기인하는 다양 한 측정오차를 극복할 수 있는 방법이기는 하나, 여전히 나 트륨 섭취량의 일간 섭취량 변이를 반영하지 못한다는 제한 점이 있다. 따라서 위와 같은 문제점을 해결하기 위해서는 식 이조사 연구보다는 나트륨의 섭취량을 조절한 식이조절 혹 은 식이를 통제한 연구가 필요하며 무작위 대조군 연구와 같 이 상위의 연구방법론을 통한 나트륨섭취와 비만의 인과관 계 파악이 필요할 것이다.
—————————————————————————
요약 및 결론
—————————————————————————
본 연구는 총 120명의 비만인과 정상인을 대상으로 나트
륨 과잉 섭취와 비만 특히 복부비만과의 연관성을 관찰하였
으며, 아울러 인슐린저항성 및 대사증후군과의 연관성을 확
인하였다. 24시간 소변검사를 통한 나트륨 배설량은 대조군
에 비하여 비만군에서 유의하게 높게 나타났으며, 비만군은
체질량지수, 허리둘레, 혈압, 간효소 수치, 혈중 중성지방,
CT상 복부지방량 및 내장지방량 등 다양한 비만 관련 위험
지표가 유의하게 높았다. 또한 24시간 소변검사법으로 측정
한 연구대상자의 나트륨 배설량이 증가함에 따라 BMI, 허리
둘레, 체지방률, 수축기혈압, CT 복부지방량, CT 내장지방
량, gamma-GGT, 중성지질, HDL-콜레스테롤이 유의하
게 증가하였으며 상관분석을 통해서도 일관된 결과를 확인
할 수 있었다. 또한 나트륨 섭취수준과 대사증후군 위험지표
의 개수와도 유의한 연관성이 있었다. 이러한 결과는 높은 나
트륨 섭취량이 비만 및 대사증후군의 위험 상승에 부정적인
영향을 미칠 수 있다는 가능성을 제기하는 것으로 향후 저염
식이를 통해 비만과 연관된 건강문제를 해결하고자 하는 연
구의 필요성을 시사한다.
—————————————————————————
References
—————————————————————————
1. Ministry of Health and Welfare & Korea Centers for Disease Control and Prevention. Korea Health Statistics 2013: Korea National Health and Nutrition Examination Survey (KNHANES
Ⅵ-1) [internet]. 2014 [cited 2015 Aug 10]. Available from:
https://knhanes.cdc.go.kr/.
2. Bibbins-Domingo K, Chertow GM, Coxson PG, Moran A, Lightwood JM, Pletcher MJ et al. Projected effect of dietary salt reductions on future cardiovascular disease. N Engl J Med 2010;
362(7): 590-599.
3. Asaria P, Chisholm D, Mathers C, Ezzati M, Beaglehole R.
Chronic disease prevention: health effects and financial costs of strategies to reduce salt intake and control tobacco use. Lancet 2007; 370(9604): 2044-2053.
4. Song HJ, Cho YG, Lee HJ. Dietary sodium intake and prevalence of overweight in adults. Metab 2013; 62(5): 703-708.
5. Yoon YS, Oh SW. Sodium density and obesity; the Korea National Health and Nutrition Examination Survey 2007-2010.
Eur J Clin Nutr 2013; 67(2): 141-146.
6. He FJ, Marrero NM, MacGregor GA. Salt intake is related to soft drink consumption in children and adolescents: a link to obesity? Hypertension 2008; 51(3): 629-634.
7. Hoffmann IS, Cubeddu LX. Salt and the metabolic syndrome.
Nutr Metab Cardiovasc Dis 2009; 19(2): 123-128.
8. Larsen SC, Ängquist L, Sørensen TI, Heitmann BL. 24h urinary sodium excretion and subsequent change in weight, waist circumference and body composition. PLoS One 2013; 8(7):
e69689.
9. Räisänen JP, Silaste ML, Kesäniemi YA, Ukkola O. Increased daily sodium intake is an independent dietary indicator of the metabolic syndrome in middle-aged subjects. Ann Med 2012;
44(6): 627-634.
10. Moon HK, Kong JE. Assessment of nutrient intake for middle aged with and without metabolic syndrome using 2005 and 2007 Korean National Health and Nutrition Survey. Korean J Nutr 2010; 43(1): 69-78.
11. Yoo HJ, Kim YH. A study on the characteristics of nutrient intake in metabolic syndrome subjects. Korean J Nutr 2008;
41(6): 510-517.
12. Hu G, Jousilahti P, Peltonen M, Lindstrom J, Tuomilehto J.
Urinary sodium and potassium excretion and the risk of type 2 diabetes: a prospective study in Finland. Diabetol 2005; 48(8):
1477-1483.
13. Hong AR, Lim S. Clinical characteristics of metabolic syndrome in Korea, and its comparison with other Asian countries. J Diabetes Invest 2015; 6(5): 508-515.
14. Intersalt Cooperative Research Group. Intersalt: an international study of electrolyte excretion and blood pressure. Results for 24 hour urinary sodium and potassium excretion. BMJ 1988; 297:
319-327.
15. Ji C, Sykes L, Paul C, Dary O, Legetic B, Campbell NR et al.
Sub-group for research and surveillance of the PAHO-WHO regional expert group for cardiovascular disease prevention
through population-wide dietary salt reduction. Systematic review of studies comparing 24-hour and spot urine collections for estimating population salt intake. Rev Panam Salud Publica 2012; 32(4): 307-315.
16. Kissebah AH, Vydelingum N, Murray R, Evans DJ, Kalkhoff RK, Adams PW. Relation of body fat distribution to metabolic complications of obesity. J Clin Endocrinol Metab 1982; 54(2):
254-260.
17. Park HS, Lim SY. Visceral fat accumulation according to sex &
age, and in relation to cardiovascular risk factors in Korean obese men & women. Korean J Obes 1998; 7(4): 342-354.
18. Fujioka S, Matsuzawa Y, Tokunaga K, Tarui S. Contribution of intra-abdominal fat accumulation to the impairment of glucose and lipid metabolism in human obesity. Metab 1987; 36(1): 54- 59.
19. Chen J, Gu D, Huang J, Rao DC, Jaquish CE, Hixson JE et al.
Metabolic syndrome and salt sensitivity of blood pressure in non-diabetic people in China: a dietary intervention study. Lancet 2009; 373(9666): 829-835.
20. Rhee MY, Kim JH, Kim YS, Chung JW, Bae JH, Nah DY et al.
High sodium intake in women with metabolic syndrome. Korean Circ J 2014; 44(1): 30-36.
21. Perry CG, Palmer T, Cleland SJ, Morton IJ, Salt IP, Petrie JR et al. Decreased insulin sensitivity during dietary sodium restriction is not mediated by effects of angiotensin II on insulin action.
Clin Sci (Lond) 2003; 105(2): 187-194.
22. Townsend RR, Kapoor S, McFadden CB. Salt intake and insulin sensitivity in healthy human volunteers. Clin Sci (Lond). 2007;
113(3): 141-148.
23. Fliser D, Fode P, Arnold U, Nowicki M, Kohl B, Ritz E. The effect of dietary salt on insulin sensitivity. Eur J Clin Invest 1995; 25(1): 39-43.
24. Foo M, Denver AE, Coppack SW, Yudkin JS. Effect of salt- loading on blood pressure, insulin sensitivity and limb blood flow in normal subjects. Clin Sci (Lond) 1998; 95(2): 157-164.
25. Donovan DS, Solomon CG, Seely EW, Williams GH, Simonson DC. Effect of sodium intake on insulin sensitivity. Am J Physiol Endocrinol Metab 1993; 264(5): E730-E734.
26. Gruska S, Wolf E, Jendral I, Wedler B, Kraatz G. Salt sensitivity and insulin resistance in normotensives. Exp Clin Endocrinol Diabetes 1997; 105(S2): 22-26.
27. Gomi T, Shibuya Y, Sakurai J, Hirawa N, Hasegawa K, Ikeda T.
Strict dietary sodium reduction worsens insulin sensitivity by increasing sympathetic nervous activity in patients with primary hypertension. Am J Hypertens 1998; 11(9): 1048-1055.
28. Petrie JR, Morris AD, Minamisawa K, Hilditch TE, Elliott HL, Small M et al. Dietary sodium restriction impairs insulin sensitivity in noninsulin-dependent diabetes mellitus. J Clin Endocrinol Metab 1998; 83(5): 1552-1557.
29. Sharma AM, Ruland K, Spies KP, Distler A. Salt sensitivity in young normotensive subjects is associated with a hyperinsulinemic response to oral glucose. J Hypertens 1991;
9(4): 329-335.
30. Iwaoka T, Umeda T, Inoue J, Naomi S, Sasaki M, Fujimoto Y et al. Dietary NaCl restriction deteriorates oral glucose tolerance in hypertensive patients with impairment of glucose tolerance. Am
J Hypertens 1994; 7(5): 460-463.
31. Iwaoka T, Umeda T, Ohno M, Inoue J, Naomi S, Sato T et al.
The effect of low and high NaCl diets on oral glucose tolerance.
Klin Wochenschr 1988; 66(16): 724-728.
32. Inoue J, Cappuccio FP, Sagnella GA, Markandu ND, Folkerd EJ, Sampson B et al. Glucose load and renal sodium handling in mild essential hypertension on different sodium intakes. J Hum Hypertens 1996; 10(8): 523-529.
33. Ames RP. The effect of sodium supplementation on glucose tolerance and insulin concentrations in patients with hypertension and diabetes mellitus. Am J Hypertens 2001; 14(7): 653-659.
34. Meland E, Laerum E, Aakvaag A, Ulvik RJ, Høstmark AT. Salt restriction: effects on lipids and insulin production in hypertensive patients. Scand J Clin Lab Invest 1997; 57(6): 501- 505.
35. Ferri C, Bellini C, Desideri G, Giuliani E, De Siati L, Cicogna S et al. Clustering of endothelial markers of vascular damage in human salt-sensitive hypertension: influence of dietary sodium load and depletion. Hypertension 1998; 32(5): 862-868.
36. Grey A, Braatvedt G, Holdaway I. Moderate dietary salt restriction does not alter insulin resistance or serum lipids in normal men. Am J Hypertens 1996; 9(4): 317-322.
37. Kerstens MN, van der Kleij FG, Boonstra AH, Sluiter WJ, Koerts J, Navis G et al. Salt loading affects cortisol metabolism in normotensive subjects: relationships with salt sensitivity. J Clin Endocrinol Metab 2003; 88(9): 4180-4185.
38. Lopes HF, Martin KL, Nashar K, Morrow JD, Goodfriend TL, Egan BM. DASH diet lowers blood pressure and lipid-induced oxidative stress in obesity. Hypertens 2003; 41(3): 422-430.
39. Kuroda S, Uzu T, Fujii T, Nishimura M, Nakamura S, Inenaga T et al. Role of insulin resistance in the genesis of sodium sensitivity in essential hypertension. J Hum Hypertens 1999;
13(4): 257-262.
40. Blumenthal JA, Babyak MA, Sherwood A, Craighead L, Lin PH, Johnson J et al. Effects of the dietary approaches to stop hypertension diet alone and in combination with exercise and caloric restriction on insulin sensitivity and lipids. Hypertens 2010; 55(5): 1199-1205.
41. Suzuki M, Kimura Y, Tsushima M, Harano Y. Association of insulin resistance with salt sensitivity and nocturnal fall of blood pressure. Hypertension 2000; 35(4): 864-868.
42. Facchini FS, DoNascimento C, Reaven GM, Yip JW, Ni XP, Humphreys MH. Blood pressure, sodium intake, insulin resistance, and urinary nitrate excretion. Hypertension 1999;
33(4): 1008-1012.
43. Sharma AM, Schorr U, Distler A. Insulin resistance in young salt-sensitive normotensive subjects. Hypertension 1993; 21(3):
273-279.
44. Dengel DR, Mayuga RS, Kairis GM, Goldberg AP, Weir MR.
Effect of dietary sodium on insulin sensitivity in older, obese, sedentary hypertensives. Am J Hypertens 1997; 10(9): 964-970.
45. Khaw KT, Bingham S, Welch A, Luben R, O'Brien E, Wareham N et al. Blood pressure and urinary sodium in men and women:
the Norfolk cohort of the European Prospective Investigation into Cancer (EPIC-Norfolk). Am J Clin Nutr 2004; 80(5): 1397-1403.
46. Karppanen H, Mervaala E. Sodium intake and hypertension. Prog Cardiovasc Dis 2006; 49(2): 59-75.