https://doi.org/10.4174/astr.2017.93.1.1 Annals of Surgical Treatment and Research
Omega-3 fatty acids inhibit oxidative stress in a rat model of liver regeneration
Ozgur Firat, Ozer Makay, Levent Yeniay, Goksel Gokce1, Cigdem Yenisey2, Ahmet Coker
Department of General Surgery, Ege University Hospital, Izmir, 1Department of Pharmacology, Faculty of Pharmacy, Ege University, Izmir, 2Department of Medical Biochemistry, Adnan Menderes University Hospital, Aydın, Turkey
INTRODUCTION
The liver has a unique capability of regeneration after several types of injuries, including surgical trauma. Improved quality of care accompanying advanced surgical techniques enables surgeons to push the safety limits of resections up on the basis of regeneration. Hence, understanding the basic patho
physiological processes enlightens this phenomenon and the impor tance of supplementary therapies considering these actions gradually increase.
The regeneration process requires great amounts of energy,
and this demand is supplied by the mitochondria through oxidative phosphorylation, producing oxidative stress [1]. Lipid peroxidation and consequent reactive oxygen species (ROS) in the setting of oxidative stress have crucial roles in liver regeneration, which may adversely affect the regeneration itself and lead to liver failure [2]. Therefore, decreasing the concentrations of ROS, while enhancing the antioxidant defense system, has become the main purpose of numerous investigations [3].
Fish oil based lipid emulsions contain high amounts of omega3 polyunsaturated fatty acids. Omega3 fatty acids Purpose: Lipid peroxidation and consequent reactive oxygen species in the setting of oxidative stress have crucial roles in liver regeneration, which may adversely affect the regeneration itself and lead to liver failure. The aim of the current study is to investigate whether omega-3 fatty acid supplementation inhibits oxidative stress in an experimental model of liver regeneration.
Methods: Forty rats were allocated to four groups. Rats in group A received a sham operation. Rats in group B were sub- jected to right portal vein ligation (RPVL) and saline infusion. Rats in groups C and D were subjected to RPVL and total paren teral nutrition (TPN) with an all-in-one admixture containing a soybean oil based lipid emulsion. Rats in group D were addi tionally supplemented with omega-3 fatty acid infusion. Oxidative stresses in the blood and liver were measured by gluta thione, superoxide dismutase, catalase, glutathione peroxidase, malondialdehyde, and nitric oxide.
Results: Omega-3 supplementation to the TPN solution significantly corrected alterations in the blood and tissue con- centrations of oxidants and anti-oxidants during regeneration (P < 0.05).
Conclusion: Omega-3 fatty acid supplementation to the TPN solution revealed promising results in removal of oxidative stress that emerges during liver regeneration.
[Ann Surg Treat Res 2017;93(1):1-10]
Key Words: Omega-3 fatty acids, Oxidative stress, Liver regeneration
Reviewed January February March April May June JulyAugust September October November December
Received August 9, 2016, Revised December 2, 2016, Accepted December 12, 2016
Corresponding Author: Ozgur Firat
Department of General Surgery, Ege University Hospital, 3rd Floor, Bornova, Izmir 35100, Turkey
Tel: +90-232-390-5050, Fax: +90-232-339-8838 E-mail: [email protected]
• This experimental study was presented at the 30th ESPEN (European Society for Clinical Nutrition and Metabolism) Congress which was held in September 13th–16th, 2008, Florence, Italy and a travel fellowship award was granted.
Copyright ⓒ 2017, the Korean Surgical Society
cc Annals of Surgical Treatment and Research is an Open Access Journal. All articles are distributed under the terms of the Creative Commons Attribution Non- Commercial License (http://creativecommons.org/licenses/by-nc/4.0/) which permits unrestricted non-commercial use, distribution, and reproduction in any medium, provided the original work is properly cited.
(Ω3FAs) and their longer chain downstream products such as eicosapentaenoic acid (EPA), docosapentaenoic acid (DPA) and docosahexaenoic acid (DHA) have been demonstrated as beneficial on the liver in several different aspects [46].
However, the number of studies focusing on the effects of Ω3FAs on liver regeneration is relatively few with different results [7,8]. Moreover, the effects of adding these emulsions to total parenteral nutrition (TPN) on the oxidative stress, which develop in the regenerating liver, are not clear.
Based on these considerations; the aim of the present study was to investigate whether Ω3FA supplementation inhibits oxidative stress in an experimental model of liver regeneration.
METHODS
Animals and preparation
Forty adult male Wistar rats, weighing 200–250 g were used in the current study. The animals were obtained from the Depart ment of Experimental Surgery, Animal Breeding and Research Laboratory. The experimental procedures of the study were approved by the Institutional Animal Ethics Committee and were conducted in accordance with the National Institutes of Health Guidelines. All of the animals were kept in single cages at room temperature under a 12/12hour light/dark cycle and with standard rat chow and water ad libitum. The compo
sition of the rat chow was 640 g/kg for carbohydrates, 180 g/
kg for proteins, 70 g/kg for fat, 35 g/kg for minerals, 10 g/kg for vitamins, and 65 g/kg for water. The metabolic energy value of the standard rat chow was 11.1 kJ/g with a composition of 13%
fat, 22% crude protein, and 65% carbohydrate. Twelve hours before the experiment, the rats were fasted but given free access to water.
Experimental design
Subjects were randomly allocated to 4 groups comprising ten rats each and underwent: group A, sham operation (weight [mean ± standard deviation]: 222.4 ± 21.2 g); group B, right portal vein ligation (RPVL) + intravenous saline infusion (2 mL/kg/hr) (228.2 ± 20.4 g); group C, RPVL + TPN solution infusion (2 mL/kg/hr) (224.8 ± 18.4 g); group D, RPVL + TPN (2 mL/kg/hr) + Ω3FA infusion (0.5 mL/kg/hr) (226.6 ± 19.6 g).
A midline laparotomy was performed after each rat had been anesthetized (10 mg/kg, intramuscular, Ketalar; Eczacibasi, Istanbul, Turkey), and the right portal veins of the rats in groups B, C, and D were ligated with 4.0 silk. A similar dissection of the porta hepatis was performed in the sham group, except that the right portal veins were not ligated. The abdominal incisions were closed in 2 layers with continuous 3.0 silk sutures. The rats were catheterized via femoral vein and the infusions of the saline solution (Izotonik Sodyum Klorur, Eczacıbasi-Baxter, Istanbul, Turkey) TPN and Ω3FAs solutions were maintained for
48 hours under light ether anesthesia. The rats were sacrified on postoperative day 3.
Nutritional supplementation
The solution used in the current study is a sterile emulsion manu factured as an allinone admixture for TPN (Kabiven Peri
pheral, Fresenius Kabi AG, Bad Homburg, Germany). The total amount of energy provided by the TPN solution is 305.2 kJ/100 mL. The lipid emulsion consisted of 3.9g purified soybean oil for 100 mL of TPN solution.
The Ω3FAs supplement used in the current study is a paren
teral lipid emulsion, which is composed of 10 g of 100% fish oil in 100 mL (Omegaven, Fresenius Kabi AG). The fat composition of this highly refined fish oil consisted of 1.25–2.82 g of EPA, 1.44–3.09 g of DHA, 0.15–0.45 g of DPA, 0.1–0.7 g of linoleic acid, 0.2 g of αlinolenic acid, 0.6–1.3 g of oleic acid, 0.25–1.0 g of palmitic acid, 0.05–0.2 g of stearic acid, 0.1–0.4 g of arachidonic acid, 0.1–0.6 g of myristic acid, 0.3–0.6 g of palmitoleic acid, 0.05–0.4 g of octadecatetraenoic acid, 0.05–0.3 g of eicosaenoic acid, and 0.15 g of docosaenoic acid. The emulsion also contained 150–296 mg/L αtocopherol, 2.5 g of glycerol and 1.2 g of purified egg phosphatide. The energy value of the emulsion is 470 kJ/100 mL. The adjusted total volumes and amounts of Omegaven administered according to the body weights of the rats were between 4.8–6 mL corresponding to 0.48–0.6 g fish oil.
The composition of both emulsions are quoted from the manu facturer’s prescription information; also, the infusion rates used in the current study were arranged according to the recom mended posology of the manufacturer.
Collection and preparation of blood and tissue samples
Blood samples were collected by cardiac puncture using hepa rinized tubes. Two milliliters of blood was separated into plasma and erythrocytes by centrifugation at 10,000 × g for 10 minutes at 4°C. The erythrocyte samples were washed three times with cold physiological saline and then lyzed by adding a fourfold volume of icecold ultrapure water (DirectQ3 UV, Millipore, Bedford, MA, USA). Lyzed erythrocyte samples were centrifuged at 10,000 × g for 10 minutes at +4°C, and the supernatant was collected and stored at –70°C for less than 2 months pending measurement of enzymatic activity.
Hemoglobin content in erythrocyte lysates was estimated using the method of Drabkin and Austin [9].
The rats underwent total hepatectomies and the livers were separated into right and left lobes outside the body.
The specimens were subsequently washed with phosphate
buffered saline (pH, 7.4). Liver tissues were snap frozen in liquid nitrogen and stored at –70°C until biochemical assays.
Frozen tissue samples of liver were weighed and homogenized
(Ultra Turrax T25, IKA, Staufen, Germany) in cold phosphate buffer, pH 7.0 with ethylenendiaminetetraacetic acid in an ice bath. Homogenates were sonicated (Bandelin Sonopuls UW 2070, Bandelin Electronics, Berlin, Germany) for 30 seconds and centrifuged (10,000 × g for 10 minutes at +4°C). The supernatants were aliquoted and stored at –70°C. The protein contents of the supernatants were determined using the Lowry method [10].
All spectrophometric measurements were made using a multi task plate reader (Victor 3Model 1420, Perkin Elmer, Turku, Finland). Two additional independent experiments performed prior to the study provided clear normative limits, representing the reproducibility of the biochemical assays employed in the current study.
Liver injury
The degree of liver injury was assessed by serum ALT. The serum concentrations of ALT were determined by Abbott C8000 Architect/Aeroset autoanalyzer (ABBOTT, MaxPlanckRing 2, Wiesbaden, Germany) using a commercial assay kit (catalogue number 7D5620/304096/R6). ALT catalysed the transfer of the amino group from Lalanine to αketoglutarate, forming pyruvate and Lglutamate. In the presence of nicotinamide adenine dinucleotide (NADH) and lactate dehydrogenase, pyru
vate was then reduced to Llactate. In this reaction NADH was oxidized to NAD. The reaction was monitored by measuring the rate of decrease in absorbance at 340 nm due to the oxidation of NADH to NAD. The manufacturer’s recommendation for the referance range of the kit was 0–55 U/L.
Spectrophotometric measurements
Glutathione
Tissue and blood concentrations of total glutathione (GSH) as well as the oxidized disulfide dimer of glutathione (GSSG) were measured according to the method described by Baker et al.
[11]. Briefly, total GSH was assayed using an enzymatic recycling procedure in which reduced GSH was sequentially oxidized by 5,5'dithiobis(2nitrobenzoicacid) (DTNB; SigmaAldrich Inc.
Saint Louis, MO, USA) to GSSG, which was then reduced by nicotinamide adenine dinucleotide phosphate (NADPH) back to GSH in the presence of GSH reductase to react again with DTNB. The absorbance was measured spectrophotometrically at 405 nm. The concentrations of GSH, GSSG, and GSH to GSSG ratio were calculated. Data were expressed as nmol/mg protein in liver and mmol/mL/red blood cell in blood samples.
Superoxide dismutase
Superoxide dismutases (SOD) are metalloenzymes that catalyze the dismutation of superoxide anion into oxygen and hydrogen peroxide (H2O2). SOD activities in the liver super
na tants and in the blood were measured using a commercial
assay kit (Bioxytech SOD525, OxisResearch, Portland, OR, USA) according to the manufacturer’s instructions. The principle of the method is based on the SODmediated increase in the rate of autoxidation of 5,6,6a,11btetrahydro3,9,10
trihydroxybenzo[c]fluorene in aqueous alkaline solution to yield a chromophore with a maximum absorbance at 525 nm [12]. The calculated SOD activity was expressed as U/mg protein in both liver and erythrocyte lysates.
Catalase
Catalase is a widely distributed enzyme that destroys hydro
gen peroxide by dismutation, and also demonstrates peroxidatic activity. Catalase activities in the liver supernatants and in the blood were measured using a commercial assay kit (Bioxytech Catalase520, OxisResearch) according to the manufacturer’s instructions. The rate of dismutation of H2O2 to water and molecular oxygen is proportional to the concentration of catalase [13]. Therefore, the sample was incubated in the pre
sence of H2O2. After incubation for exactly one minute, the reaction was quenched with sodium azide. The amount of H2O2 remaining in the reaction mixture was then determined by the oxidative coupling reaction of 4aminophenazone and 3,5dichloro2hydroxybenzenesulfonic acid in the presence of H2O2 and catalyzed by horseradish peroxidase. The resulting quinoneimine dye was measured at 520 nm. The calculated catalase activity was expressed as U/mg protein in liver and as mm decomposed H2O2/min/dL red blood cell in erythrocyte lysates. Hemoglobin was evaluated as described above.
Malondialdehyde
Measurement of MDA is widely used as an index of lipid peroxi dation. MDA concentrations were calculated using a com
mercial assay kit (Bioxytech MDA586, OxisResearch) according to the manufacturer’s instructions. The principle of the method is based on the reaction of a chromogenic reagent, Nmethyl
2phenylindole (NMPI), with MDA at 45°C [14]. One molecule of MDA reacts with 2 molecules of NMPI to yield a stable carbocyanine dye with a maximum absorption at 586 nm. The calculated MDA concentrations were expressed as nmol/g wet tissue in liver and as nmol/mL in blood samples.
Glutathione peroxidase
Glutathione peroxidases (GPx) are selenoenzymes that catalyze the reduction of hydroperoxides in the presence of GSH. GPx concentrations were estimated using a commercial assay kit (Bioxytech GPx340, OxisResearch) according to the manu facturer’s instructions. The principle of the method is based on indirect measure of the activity of GPx [15]. GSSG, pro duced upon reduction of an organic peroxide by GPx, is re
cycled to its reduced state by the enzyme GSH reductase. The oxi dation of NADPH to NADP+ is accompanied by a decrease in
absorbance at 340 nm (A340). In order to assay GPx, supernatants of erythrocyte lysates or liver homogenates (with minimum pro tein concentation of 7 mg/mL) were added to a solution con
taining GSH, GSH reductase, and NADPH. The enzyme reaction was initiated by adding the substrate, tertbutyl hydroperoxide and the A340 was recorded. The rate of decrease in the A340 was evaluated using the enzyme kinetics module of the integrated software application (Workout 2.0, Perkin Elmer Life Sciences, Waltham, MA, USA). Correction factor for the path length of the system was calculated by comparing the rates obtained in a spectrophotometer with a 1cm path length with those obtained in the plate reader using the same samples. The calculated GPx activity was expressed as U/mg protein in liver and as nmol/
min/mg protein in erythrocyte lysates.
Total nitrit
Total nitrit (nitrite + nitrate) in liver homogenates and plasma was measured using a commercial assay kit (Bioxytech Nitric Oxide Assay, OxisResearch) according to the manufacturer’s instructions. The principle of the method is based on enzymatic reduction of nitrate to nitrite by NADHdependent enzyme nitrate reductase, followed by spectro pho to metric analysis of total nitrite using Greiss reagent. Briefly, nitrite is converted to nitrous acid which diazotizes sulfa nila mide. The resulting sulfa
nilamidediazonium salt was then re acted with N(1Naphthyl)
ethylenediamine to produce a chromo phore. Absorbance was measured at 540 nm. Total nitrit con cen trations were expressed as nmol/mg protein in liver and mmol/L in plasma samples.
Statistical analysis
All data are expressed as mean ± standard deviation. Signifi
cant differences between groups were determined by analysis of variance followed by Tukey post hoc analysis using Graphpad Prism ver. 3.02 (GraphPad Software, San Diego, CA, USA). A value of P < 0.05 was considered as significant.
RESULTS
The serum concentrations of ALT with blood and tissue con
centrations of oxidative stress markers are shown in Table 1. In the current study, selective ligation of the right portal vein was considered a successful experimental model to induce oxidative stress in the liver tissue. In the control group, ascending con cen
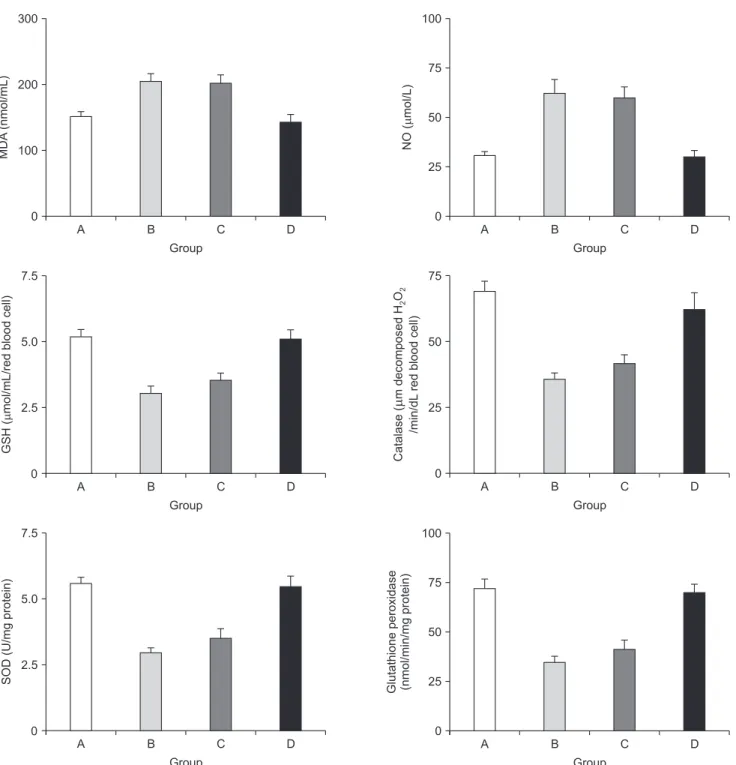
trations of the oxidants were accompanied by the descending concentrations of the members of the antioxidant defence system and this impact was significantly reversed in the study group. Blood concentrations of MDA and nitric oxide (NO) in group B were significantly increased with respect to the sham group (P = 0.0023 for MDA, P = 0.0046 for NO). TPN solution infusion provided slight changes in group C with respect to the control group, where Ω3FAs supplementation to TPN signifi
Table 1. Blood and tissue concentrations of oxidative stress markers with the serum alanine aminotransferase concentrations GroupBloodTıssue (left lobe) ShamRPVLRPVL+TPNRPVL+TPN+Omega-3 ShamRPVLRPVL+TPNRPVL+TPN+Omega-3 Malondialdehyde152.9 ± 19.4206.5 ± 32.4* 205.3 ± 29.4143.7 ± 22.3† 334.3 ± 19.46392.2 ± 17.12*380.4 ± 11.27332.9 ± 10.22† Nitric oxide30.8 ± 6.762.8 ± 20.0*60.6 ± 15.830.0 ± 7.6† 340.4 ± 39.1494.3 ± 60.7*469.4 ± 103.5336.6 ± 55.03† Glutathione5.2 ± 0.83.0 ± 0.7*3.5 ± 0.75.1 ± 0.7† 7.45 ± 0.664.55 ± 0.33*5.08 ± 0.547.03 ± 0.55† Catalase69.1 ± 11.335.8 ± 7.4*42.0 ± 9.062.2 ± 14.5† 139.2 ± 9.6103.4 ± 7.9*108.6 ± 7.5136.6 ± 11.6† Superoxide dismutase5.6 ± 0.62.9 ± 0.7*3.5 ± 0.95.4 ± 0.9† 6.16 ± 0.934.12 ± 0.87*4.50 ± 0.886.07 ± 0.59† Glutathıone peroksıdase72.3 ± 13.334.7 ± 10.7*41.7 ± 13.070.1 ± 9.7† 0.138 ± 0.0080.101 ± 0.010*0.096 ± 0.0060.133 ± 0.016† ALT53.44 ± 20.7 342.6 ± 225.1*78.0 ± 12.2† 84.2 ± 5.9 ---- Values are presented as mean ± standard deviation. RPVL, right portal vein ligation; TPN, total parenteral nutrition. *P < 0.05, mean value was significantly different compared with that of the sham group. † P < 0.05, mean value was significantly different compared with that of the RPVL group.
Fig. 1. The alterations in the blood concentrations of the oxidants and the components of the antioxidant defense system.
MDA, malondialdehyde; NO, nitric oxide; GSH, glutathione; SOD, superoxide dismutase; GPx, glutathione peroxidase. MDA:
P = 0.0051 for group C vs. A, P = 0.0075 for group C vs. D, P = 0.0057 for group D vs. B, P = 0.25 for group C vs. B, and P = 0.39 for group D vs. A; NO: P = 0.065 for group C vs. A, P = 0.029 for group C vs. D, and P = 0.066 for group D vs. B, P = 0.27 for group C vs. B, and P = 0.73 for group D vs. A. GSH: P = 0.00031 for group A vs. B, P = 0.00042 for group A vs. C, P = 0.00019 for group B vs. D, P = 0.0084 for group D vs. C, P = 0.63 for group A vs. D, and P = 0.28 for group B vs. C; Catalase: P = 0.00041 for group A vs. B, P = 0.00082 for group A vs. C, P = 0.00059 for group B vs. D, P = 0.0093 for group D vs. C, P = 0.52 for group A vs. D, and P = 0.47 for group B vs. C; SOD: P = 0.00021 for group A vs. B, P = 0.00032 for group A vs. C, P = 0.00039 for group B vs. D, P = 0.0054 for group D vs. C, P = 0.16 for group A vs. D, and P = 0.25 for group B vs. C; GPx: P = 0.00071 for group A vs. B, P = 0.00034 for group A vs. C, P = 0.00062 for group B vs. D, P = 0.00022 for group D vs. C, P = 0.17 for group A vs. D, and P = 0.27 for group B vs. C.
NO(mol/L)
0 100
75
50
25
Group
A B C D
Group
A B C D
Glutathioneperoxidase (nmol/min/mgprotein)
0 100
75
50
25 Group
A B C D
MDA(nmol/mL)
0 300
200
100
Group
A B C D
SOD(U/mg)protein
0 7.5
5.0
2.5
Group
A B C D
GSH(mol/mL/redbloodcell)
0 7.5
5.0
2.5
Catalase(mdecmposedHO /min/dLredbloodcell) 2o2
0 75
50
25
Group
A B C D
X Y
Catalase(U/mgprotein)
75 150
125
100
NO(nmol/mgprotein)
200 600
400
X Y
MDA(nmol/grtissue)
300 500
400
X Y
X Y
GSH(nmol/mgprotein)
0.0 10.0
5.0
2.5 7.5
X Y
SOD(U/mg)protein
0.0 10.0
5.0
2.5 7.5
X Y
Glutathioneperoxidase()U/mgprotein
0.05 0.15
0.10 Group A
Group B
Group C Group D
Group A Group B
Group C Group D
Group A Group B
Group C Group D Group A
Group B
Group C Group D
Group A Group B
Group C Group D
Group A Group B
Group C Group D
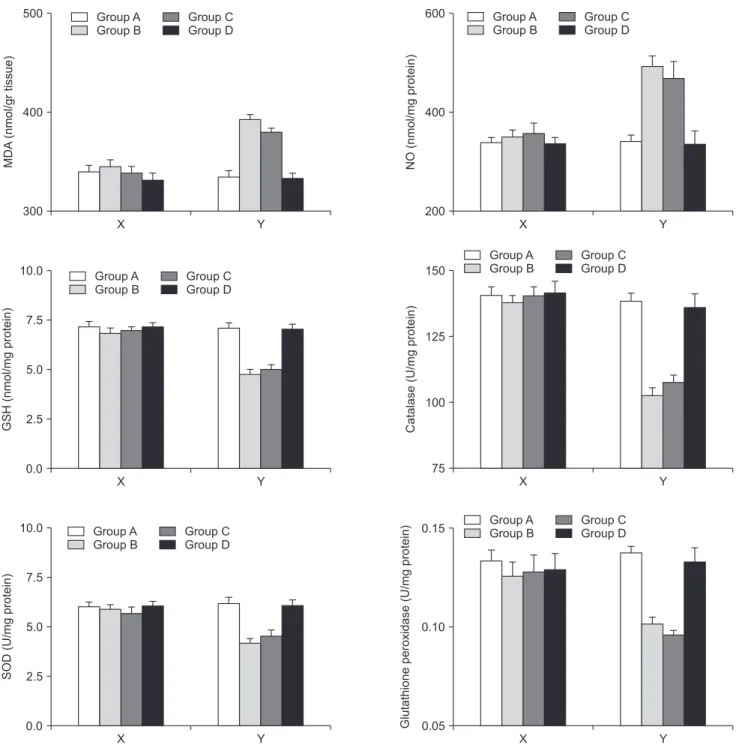
Fig. 2. The alterations in the tissue concentrations of the oxidants and the components of the antioxidant defense system for the right and left lobes separately. The X plots represent the right lobes where the Y plots represent the left lobes. MDA, malondialdehyde; NO, nitric oxide; GSH, glutathione; SOD, superoxide dismutase; GPx, glutathione peroxidase. MDA: P = 0.00011 for group A vs. B, P = 0.00032 for group A vs. C, P = 0.00047 for group B vs. D, P = 0.0021 for group C vs. D, P = 0.17 for group A vs. D, and P = 0.66 for B vs. C; NO: P = 0.00069 for group A vs. B, P = 0.00058 for group A vs. C, P = 0.00036 for group B vs. D, P = 0.0021 for group C vs. D, P = 0.43 for group A vs. D, and P = 0.26 for group B vs. C; GSH: P = 0.00021 for group A vs. B, P = 0.00077 for group A vs. C, P = 0.00047 for group B vs. D, P = 0.00035 for group C vs. D, P = 0.12 for group A vs. D, and P = 0.24 for group B vs. C. Catalase: P = 0.0003 for group A vs. B, P = 0.00071 for group A vs. C, P = 0.00033 for group B vs. D, P = 0.00025 for group C vs. D; P = 0.36 for group A vs. D, and P = 0.53 for group B vs. C; SOD: P = 0.00014 for group A vs. B, P = 0.0061 for group A vs. C, P = 0.0023 for group B vs. D, P = 0.027 for group C vs. D, P = 0.21 for group A vs. D, and P = 0.36 for group B vs. C; GPx: P = 0.00029 for group A vs. B, P = 0.00035 for group A vs. C, P = 0.037 for group B vs. D, P = 0.044 for group C vs D, P = 0.65 for group A vs. D, and P = 0.26 for group B vs. C.
cantly reduced these elevations in group D (MDA: P = 0.0051 for group C vs. A, P = 0.0075 for group C vs. D, P = 0.0057 for group D vs. B, P = 0.25 for group C vs. B, and P = 0.39 for group D vs. A; NO: P = 0.065 for group C vs. A, P = 0.029 for group C vs. D, and P = 0.066 for group D vs. B, P = 0.27 for group C vs. B, and P = 0.73 for group D vs. A). Conversely, the significant drop in concentrations of antioxidants GSH, catalase, SOD, and GPx in group B were slightly elevated in group C, but significantly improved in group D (GSH: P = 0.00031 for group A vs. B, P = 0.00042 for group A vs. C, P = 0.00019 for group B vs. D, P = 0.0084 for group D vs. C, P = 0.63 for group A vs. D, and P = 0.28 for group B vs. C; Catalase: P = 0.00041 for group A vs. B, P
= 0.00082 for group A vs. C, P = 0.00059 for group B vs. D, P = 0.0093 for group D vs. C, P = 0.52 for group A vs. D, and P = 0.47 for group B vs. C; SOD: P = 0.00021 for group A vs. B, P = 0.00032 for group A vs. C, P = 0.00039 for group B vs. D, P = 0.0054 for group D vs. C, P = 0.16 for group A vs. D, and P = 0.25 for group B vs. C; GPx: P = 0.00071 for group A vs. B, P = 0.00034 for group A vs. C, P = 0.00062 for group B vs. D, P = 0.00022 for group D vs.
C, P = 0.17 for group A vs. D, and P = 0.27 for group B vs. C). Fig.
1 summarizes the alterations in blood concentrations of oxidants and antioxidant defense system.
There was no significant change for tissue concentrations of oxidants and antioxidants within the right lobes among the groups in which the portal flows were interrupted (P
> 0.05 for all parameters). However, in the left lobes of the rats where the regeneration was induced, the protective effects of Ω3FAs supplementation to the TPN solution over the tissue measurements were comparable with the blood results. Ω3FA supplementation to the TPN solution infusion (group D) significantly corrected the increase of the oxidants and enhanced the impaired antioxidant defense where TPN infusion alone (group C) did not. (MDA: P = 0.00011 for group A vs. B, P = 0.00032 for group A vs. C, P = 0.00047 for group B vs. D, P = 0.0021 for group C vs. D, P = 0.17 for group A vs. D, and P = 0.66 for B vs. C; NO: P = 0.00069 for group A vs. B, P
= 0.00058 for group A vs. C, P = 0.00036 for group B vs. D, P = 0.0021 for group C vs. D, P = 0.43 for group A vs. D, and P = 0.26 for group B vs. C; GSH: P = 0.00021 for group A vs. B, P = 0.00077 for group A vs. C, P = 0.00047 for group B vs. D, P = 0.00035 for group C vs. D, P = 0.12 for group A vs. D, and P = 0.24 for group B vs. C. Catalase: P = 0.0003 for group A vs. B, P = 0.00071 for group A vs. C, P = 0.00033 for group B vs. D, P = 0.00025 for group C vs. D; P = 0.36 for group A vs. D, and P = 0.53 for group B vs. C; SOD: P = 0.00014 for group A vs. B, P = 0.0061 for group A vs. C, P = 0.0023 for group B vs. D, P = 0.027 for group C vs. D, P = 0.21 for group A vs. D, and P = 0.36 for group B vs.
C; GPx: P = 0.00029 for group A vs. B, P = 0.00035 for group A vs. C, P = 0.037 for group B vs. D, P = 0.044 for group C vs. D, P = 0.65 for group A vs. D, and P = 0.26 for group B vs. C). Fig.
2 summarizes the alterations in tissue concentrations of the
oxidants and the antioxidant defense system for the right and the left lobes separately.
In group B, serum concentrations of ALT were significantly increased with respect to the Sham Group (P = 0.043). Serum concentrations of ALT were significantly (P = 0.034) reduced when rats were supplemented with the TPN solution (group C) compared with saline infused rats (group B); however, Ω3FAs supplementation to the TPN (group D) did not show any additional benefit with regard to the hepatocyte injury (P = 0.17).
DISCUSSION
In the current study, Ω3FAs supplementation to the TPN solution alleviated the oxidative stress that resulted during the regeneration process of the liver. This is a promising result because oxidative stress is known to produce tissue injury and to activate various signaling pathways that may concern liver regeneration [16,17]. The negative impact of oxidative stress is mainly associated with the production of ROS that is assumed to mediate cell growth arrest and activate proteins that inhibit the cell cycle [18]. Furthermore, induced apoptosis and necrosis with high concentrations of ROS has been revealed [19]. Another important issue within oxidative stress is the lipid peroxidation, which is suggested to be a manifestation of free radical injury to biological membranes reducing membrane fluidity and impairing function [20]. Therefore, excess release of oxidants and decreased levels of antioxidants is a pathological rather than a physiological event. This is the central idea of the current article while considering the opinion that suggests a modulator role of lipid peroxidation on cell division and mediation of DNA damage, as mentioned in previous studies [21].
MDA and NO were the oxidants examined in the current study. MDA is a secondary product of lipid peroxidation and considered a marker of oxidative stress [22]. Persistantly higher levels of MDA in liver regeneration models are associated with hepatocyte injury where a delay in tissue growth is generally encountered. NO is a mediator of hepatic vasculature tone under various pathophysiological circumstances. Although the role of NO is controversial, enhanced release of this molecule during the early steps of regeneration has been suggested and its role in cell proliferation is regarded as responsible for induced lipid peroxidation, particularly in the presence of superoxide anion [23].
GSH, catalase, SOD, and glutathione peroxidase are the components of the antioxidant defense system acting as ROS scavengers at the cellular level [1,6]. The oxidative phospho
rylation reaction is initially catalyzed by SOD and it removes the superoxide anion generating H2O2, which is then reduced to water by glutathione peroxidase using GSH as the cofactor [1]. Catalase also accelerates the decomposition of H2O2 to
water and oxygen. Exposure to H2O2 reduces the proliferative capacity of the hepatocytes. Therefore, the oxidative damage as a consequence of an excess of oxidants can lead to cellular dysfunction and apoptosis [24].
Long chain Ω3FAs are derived from αlinolenic acid, which can not be synthesized de novo by mammalian cells. The metabolites of this essential fatty acid play important roles in various mechanisms concerning several processes in the liver and, therefore, must be supplied in adequate amounts from diet or intravenously under certain conditions. Long chain Ω3FAs yield antiinflammatory, antithrombotic, vasodilatory, and hypolipidemic features; therefore, they are considered as beneficial against microcirculatory failure after ischemia/
reperfusion injury, and protective against hepatocellular damage in the macrosteatotic liver. The antiinflammatory feature of the long chain Ω3FAs also include suppression of interleukin1 and tumor necrosis factor, which are considered as responsible for the retardation in liver regeneration [25]. Nevertheless, the data regarding the effects of long chain Ω3FAs against oxidative stress in the liver is very limited. One study investigating this issue on a regenerating liver found a reduction in ROS production and an improvement in the antioxidant system [6].
Another study dealing with Ω3FAs supplementation, which did not use a regeneration model, reported that this compound did protect against oxidative stress induced DNAdamage in the liver [7]. However, there are contradicting studies reporting negative effects of long chain Ω3FAs on regenerating [26] and normal liver [27] with diverse results on oxidative stress.
In these studies, the authors administered oral Ω3FAs supple mentation, therefore the effect of parenteral Ω3FAs supplementation is still ambiguous. Clarifying this inquiry is of utmost importance, because TPN may occasionally be a life
saving treatment for various conditions of intestinal failure.
On the other hand, a positive correlation between the harmful effects of TPN on liver function and the duration of TPN was also suggested previously [28]. Chronic TPN may provoke hepatic dysfunction, which can even progress to endstage liver disease and liver failure; and this damage is reported to be associated with oxidative stress and subsequent apoptosis [28]. In the current study, we carried out portal vein ligation for liver regeneration, which is a wellknown model used in various experimental studies [29]. Thus, we induced oxidative stress and measured the influences of TPN and Ω3FAs. In contrast with the previous studies, TPN did not exaggerate the oxidative stress in the current study. Moreover, it slightly corrected the elevated oxidant and decreased antioxi dant concentrations. This contradictory impact might be a con se
quence of the short duration of the study in which the rats were sacrificed on the third day. However, the rationale behind the selection of the third day to sacrifice and collect the samples was principally based on the previous data suggesting the
elevation of GSH levels up to 72 hours following an initial drop after the induction of regeneration [1]. Therefore, our study design was primarily carved out with respect to the dynamics of the mediators of oxidative stress. Nevertheless, Ω3FA supplementation to the TPN solution provided further amelioration on the oxidative stress markers in both serum and tissue samples. Briefly, the significant decreases of MDA and NO with the increases of GSH, catalase, SOD, and GPx in the Ω3FA supplemented group, indicate a substantial reversal of a mitochondriamediated pathological process. Firstly, this outcome may allow the interpretation where parenteral Ω3FA supplementation to TPN may reduce the liver damage associated with the duration of TPN wherein the duration is the major determinant of hepatic dysfunction related to artificial nutrition.
On the other hand, the importance of protecting the mito
chondria is more than maintaining the energy source of the cell; since this organelle has been involved in a range of other processes, such as signaling, cellular differentiation, cell death, as well as the control of the cell cycle and cell growth [30]. These processes are different from each other, and they individually can regulate the regeneration of the liver. Therefore, Ω3FA supplementation to TPN solutions may have a therapeutic effect in liver injury and regeneration.
The major drawback of the current study is that the concen
trations of long chain Ω3FAs like EPA, DPA, and DHA were not measured. This absence of data do not allow us to ascertain the exact amounts of EPA, DPA, and DHA required to affect ROS production and liver protection in accordance with the results of the current study. However, the dosage used in the study was arranged according to the maximum infusion rate recommended by the manufacturer while considering the warnings concerning serum triglyceride elevation and impairment of haemostatic mechanisms.
In conclusion, the current study demonstrated that right portal vein ligation in rats increased the production of ROS and decreased the concentrations of antioxidant defense system in the regenerating counter lobe. Ω3FA supplementation to TPN solution was associated with reduced oxidative stress in this experimental liver regeneration setting. The results of the current study supports the opinion that Ω3FAs enrichment of intravenous lipid emulsions may improve the regeneration of the liver after injury. These experimental results may also contribute to clinical trials investigating the impact of Ω3FAs on the liver following major hepatic surgery within the objectives of translational research.
CONFLICTS OF INTEREST
No potential conflict of interest relevant to this article was reported.
REFERENCES
1. Yang S, Tan TM, Wee A, Leow CK. Mito
chon drial respiratory function and anti
oxidant capacity in normal and cirrhotic livers following partial hepatec tomy. Cell Mol Life Sci 2004;61:2209.
2. Horimoto M, Fulop P, Derdak Z, Wands JR, Baffy G. Uncoupling protein2 defi
ciency promotes oxidant stress and delays liver regeneration in mice. Hepatology 2004;39:38692.
3. Hong JY, Lebofsky M, Farhood A, Jaeschke H. Oxidant stressinduced liver injury in vivo: role of apoptosis, oncotic necrosis, and cJun NH2terminal kinase activation.
Am J Physiol Gastrointest Liver Physiol 2009;296:G57281.
4. ElBadry AM, Graf R, Clavien PA. Omega 3 Omega 6: What is right for the liver? J Hepatol 2007;47:71825.
5. Kikugawa K, Yasuhara Y, Ando K, Koyama K, Hiramoto K, Suzuki M. Protective effect of supplementation of fish oil with high n3 polyunsaturated fatty acids against oxi dative stressinduced DNA damage of rat liver in vivo. J Agric Food Chem 2003;
51:60739.
6. Kirimlioglu V, Kirimlioglu H, Yilmaz S, Ozgor D, Coban S, Karadag N, et al.
Effect of fish oil, olive oil, and vitamin E on liver pathology, cell proliferation, and antioxidant defense system in rats subjected to partial hepatectomy.
Transplant Proc 2006;38:5647.
7. Marsman HA, de Graaf W, Heger M, van Golen RF, Ten Kate FJ, Bennink R, et al. Hepatic regeneration and functional recovery following partial liver resection in an experimental model of hepatic steatosis treated with omega3 fatty acids.
Br J Surg 2013;100:67483.
8. Silva RM, Malafaia O, Torres OJ, Czeczko NG, Marinho Junior CH, Kozlowski RK.
Evaluation of liver regeneration diet supplemented with omega3 fatty acids:
experimental study in rats. Rev Col Bras Cir 2015;42:3937.
9. Drabkin DL, Austin JH. Spectro pho to
metric studies. II. Preparations from
washed blood cells: nitric oxide hemo
glo bin and sulfhemoglobin. J Biol Chem 1935;112:515.
10. Lowry OH, Rosebrough NJ, Farr AL, Randall RJ. Protein measurement with the Folin phenol reagent. J Biol Chem 1951;
193:26575.
11. Baker MA, Cerniglia GJ, Zaman A.
Microtiter plate assay for the measure
ment of glutathione and glutathione disulfide in large numbers of biological samples. Anal Biochem 1990;190:3605.
12. Nebot C, Moutet M, Huet P, Xu JZ, Yadan JC, Chaudiere J. Spectrophotometric assay of superoxide dismutase activity based on the activated autoxidation of a tetracyclic catechol. Anal Biochem 1993;214:44251.
13. Deisseroth A, Dounce AL. Catalase: phy
sical and chemical properties, mechanism of catalysis, and physiological role. Physiol Rev 1970;50:31975.
14. GerardMonnier D, Erdelmeier I, Regnard K, MozeHenry N, Yadan JC, Chaudiere J.
Reactions of 1methyl2phenylindole with malondialdehyde and 4hydroxyalkenals.
Analytical applications to a colorimetric assay of lipid peroxidation. Chem Res Toxicol 1998;11:117683.
15. Ursini F, Maiorino M, Valente M, Ferri L, Gregolin C. Purification from pig liver of a protein which protects lipo somes and bio
membranes from peroxi dative de gra da
tion and exhibits gluta thione peroxi dase activity on phos phati dyl choline hydro
peroxides. Biochim Biophys Acta 1982;
710:197211.
16. Dragin N, Smani M, ArnaudDabernat S, Dubost C, Moranvillier I, Costet P, et al.
Acute oxidative stress is associated with cell proliferation in the mouse liver. FEBS Lett 2006;580:384552.
17. Ozsoy M, Gonul Y, Bal A, Ozkececi ZT, Celep RB, Adali F, et al. Effect of IL18 binding protein on hepatic ischemiare
per fusion injury induced by infrarenal aor tic occlusion. Ann Surg Treat Res 2015;
88:929.
18. Finkel T, Holbrook NJ. Oxidants, oxidative
stress and the biology of ageing. Nature 2000;408:23947.
19. DongYun S, YuRu D, ShanLin L, Ya
Dong Z, Lian W. Redox stress regulates cell proliferation and apoptosis of human hepatoma through Akt protein phos pho
rylation. FEBS Lett 2003;542:604.
20. Garcia JJ, LopezPingarron L, Almeida
Souza P, Tres A, Escudero P, GarcíaGil FA, et al. Pro tec tive effects of melatonin in reducing oxi dative stress and in preserving the flui dity of biological membranes: a review. J Pineal Res 2014;
56:22537.
21. Diesen DL, Kuo PC. Nitric oxide and redox regulation in the liver: part II. Redox bio
logy in pathologic hepatocytes and impli
ca tions for intervention. J Surg Res 2011;
167:96112.
22. Yoon SY, Kim CY, Han HJ, Lee KO, Song TJ. Protective effect of ischemic post con
di tioning against hepatic ischemic reper
fusion injury in rat liver. Ann Surg Treat Res 2015;88:2415.
23. Carnovale CE, Scapini C, Alvarez ML, Favre C, Monti J, Carrillo MC. Nitric oxide release and enhancement of lipid peroxi
dation in regenerating rat liver. J Hepatol 2000;32:798804.
24. Nandivada P, Cowan E, Carlson SJ, Chang M, Gura KM, Puder M. Mechanisms for the effects of fish oil lipid emulsions in the management of parenteral nutrition
associated liver disease. Prostaglandins Leukot Essent Fatty Acids 2013;89:1538.
25. Stulnig TM. Immunomodulation by polyunsaturated fatty acids: mechanisms and effects. Int Arch Allergy Immunol 2003;132:31021.
26. Melo JU, Santos JM, Kimura Ode S, Campos Junior MM, Melo RB, Vasconcelos PR. Effects of fatty acids on liver regenera
tion in rats. Rev Col Bras Cir 2010;37:3517.
27. Tsuduki T, Honma T, Nakagawa K, Ikeda I, Miyazawa T. Longterm intake of fish oil increases oxidative stress and decreases lifespan in senescenceaccelerated mice.
Nutrition 2011;27:3347.
28. Cai W, Wu J, Hong L, Xu Y, Tang Q, Shi C.
Oxidative injury and hepatocyte apop
tosis in total parenteral nutritionasso
ciated liver dysfunction. J Pediatr Surg 2006;41:16638.
29. Capussotti L, Muratore A, Baracchi F, Lelong B, Ferrero A, Regge D, et al. Portal vein ligation as an efficient method of increasing the future liver remnant volume in the surgical treatment of
colo rectal metastases. Arch Surg 2008;
143:97882.
30. McBride HM, Neuspiel M, Wasiak S.
Mitochondria: more than just a power
house. Curr Biol 2006;16:R55160.