Validation of the eighth edition of the American Joint Committee on Cancer staging system and proposal of an improved
staging system for pancreatic ductal adenocarcinoma
Min Young Park1, Sang Hyun Shin1,2, Ki Byung Song1, DaeWook Hwang1, Jae Hoon Lee1, Young-Joo Lee1, and Song Cheol Kim1
1Division of Hepato-Biliary and Pancreatic Surgery, Department of Surgery, Asan Medical Center, University of Ulsan College of Medicine, 2Department of Surgery, Samsung Medical Center,
Sungkyunkwan University School of Medicine, Seoul, Korea
Backgrounds/Aims: This study aimed to validate the eighth edition of the American Joint Committee on Cancer (AJCC) staging system for pancreatic adenocarcinoma and to propose an improved staging system for this disease. Methods:
Between 2000 and 2014, 1656 patients underwent surgical resection for pancreatic ductal adenocarcinoma at Asan Medical Center, Seoul, South Korea. The 1169 patients included in this study were recategorized according to the eighth edition of the AJCC staging system. Patients were also categorized according to a new staging system, based on tumor size and number of metastatic lymph nodes. Results: The seventh edition of the AJCC staging system catego- rized 93.7% of patients as having stage T3 tumors. Stages were distributed more evenly with the eighth edition. In the N0 group, classification according to the seventh edition showed no statistically significant differences in survival rate between patients with T1 and T2 (p=0.717) and with IA and IB (p=0.717) tumors. Survival rates classified according to the eighth edition differed significantly for all pairs of T stages (p<0.05). With both editions, N stages showed statisti- cally significant differences (p<0.05). Reanalysis showed that a staging system using a tumor size ≥3 cm and ≥1 metastatic lymph nodes was more predictive of survival rates. Conclusions: Compared with the seventh edition, the eighth edition of the AJCC staging system for pancreatic adenocarcinoma showed a more even distribution in T stage but marginal differences in other stages. The proposed system, using tumor size and number of metastatic lymph nodes, was better at predicting survival. (Ann Hepatobiliary Pancreat Surg 2019;23:46-55)
Key Words: Validation studies; Adenocarcinoma; Pancreas
Received: November 14, 2018; Revised: November 15, 2018; Accepted: November 15, 2018 Corresponding author: Song Cheol Kim
Division of Hepato-Biliary and Pancreatic Surgery, Department of Surgery, Asan Medical Center, University of Ulsan College of Medicine, 88 Olympic-ro 43-gil, Songpa-gu, Seoul 05505, Korea
Tel: +82-2-3010-3936; Fax: +82-2-474-9027; E-mail: [email protected]
Copyright Ⓒ 2019 by The Korean Association of Hepato-Biliary-Pancreatic Surgery
This is an Open Access article distributed under the terms of the Creative Commons Attribution Non-Commercial License (http://creativecommons.org/
licenses/by-nc/4.0) which permits unrestricted non-commercial use, distribution, and reproduction in any medium, provided the original work is properly cited.
Annals of Hepato-Biliary-Pancreatic Surgery ∙ pISSN: 2508-5778ㆍeISSN: 2508-5859
INTRODUCTION
Pancreatic ductal adenocarcinoma (PDAC) is a lethal disease with poor prognosis due to the lack of specific symptoms, late detection, and aggressive invasion.1-3 Efforts have been made to evaluate long-term survival prognostic factors in patients with PDAC. Among the factors re- ported to influence survival are patient age, tumor size, pathological differentiation, and lymph node metastases.4-6 PDAC stages are also regarded as prognostic factors and used to determine if additional adjuvant treatment is required.2,7
The cancer staging system of the American Joint
Committee on Cancer (AJCC) includes tumor size and ex- tent and the presence or absence of regional lymph nodes and distant metastases.8,9 Stage-specific treatments have undergone developments over time.10,11 To apply these treatments appropriately, tumor stage should be the stron- gest determinant of outcome. However, when patients with PDAC were classified in accordance with the sev- enth T and N staging system (Table 1), almost all patients were found to have stage T3 tumors (stages IIA and IIB), with survival rates varying in patients classified as having stage IIB tumors. Moreover, the survival rates at each stage were not evenly distributed, indicating that this stag- ing system did not effectively reflect patient prognosis.
Table 1. American Joint Committee on Cancer (AJCC) seventh edition staging system for pancreatic cancer
Primary tumor (T) Regional lymph nodes (N) Distant metastases (M)
T1 Tumor limited to the pancreas, <2 cm in greatest dimension
N0 No regional lymph node metastasis M0 No distant metastasis T2 Tumor limited to the pancreas, >2 cm in
greatest dimension
N1 Regional lymph node metastasis M1 Distant metastasis T3 Tumor extends beyond the pancreas but
without involvement of the celiac axis or the superior mesenteric artery
T4 Tumor involves the celiac axis or the superior mesenteric artery (unresectable primary tumor) Stage
Stage IA T1 N0 M0
Stage IB T2 N0 M0
Stage IIA T3 N0 M0
Stage IIB T1-T3 N1 M0
Stage III T4 Any N M0
Stage IV Any T Any N M1
Table 2. American Joint Committee on Cancer (AJCC) eighth edition staging system for pancreatic cancer
Primary tumor (T) Regional lymph nodes (N) Distant metastases (M)
T1 Maximum tumor diameter ≤2 cm N0 No regional lymph node metastasis M0 No distant metastasis T2 Maximum tumor diameter >2 cm but ≤4 cm N1 Metastasis to 1-3 regional lymph nodes M1 Distant metastasis T3 Maximum tumor diameter >4 cm N2 Metastasis to ≥4 regional lymph nodes
T4 Tumor involves the celiac axis or the superior mesenteric artery (unresectable primary tumor) Stage
Stage IA T1 N0 M0
Stage IB T2 N0 M0
Stage IIA T3 N0 M0
Stage IIB T1-T3 N1 M0
Stage III Any T
T4
N2 Any N
M0 M0
Stage IV Any T Any N M1
The eighth edition of the AJCC staging system for PDAC was recently described (Table 2).9 Compared with the seventh edition, the eighth edition classifies patients mainly by tumor size rather than by tumor extent, similar to staging systems for other cancers of the gastrointestinal tract. The AJCC seventh edition included only two N stages, based on the presence or absence of metastatic lymph nodes. By contrast, the AJCC eighth edition in- cludes three N stage categories, based on the number of metastatic lymph nodes. The purposes of this study were to validate the eighth AJCC T and N staging system for PDAC, to compare its predictive ability with that of the AJCC seventh edition, and to develop a staging system more effective than the eighth edition of the AJCC staging
system. In addition, this study identified factors other than TNM stage that affected survival rate.
MATERIALS AND METHODS
Between January 2000 and December 2014, 1656 pa- tients at Asan Medical Center, Seoul, South Korea, under- went surgical resection for PDAC. Patients with distant metastases (n=67), those who underwent R1 resection (n=349), and those who received neoadjuvant chemo- therapy (n=76) were excluded. Patients with stage T4 tu- mors (n=16) were also excluded because these tumors are clinically unresectable at this stage. After excluding these 487 patients, the validation study included 1169 patients.
Table 3. Demographics and clinicopathological features included in univariate analysis of factors prognostic of overall survival (n=1656)
Factors
Univariate analysis All patients,
n (%)
Median survival, months
p
Sex
Male 1009 (60.9)
Female 647 (39.1)
Age, yr
<65 1048 (63.3) 22.03 0.024
≥65 608 (36.7) 19.63
Tumor size, cm
≤2 236 (14.3) 33.00 Ref
>2 and ≤4 1085 (65.5) 21.57 <0.001
>4 335 (20.2) 16.50 <0.001
T stage (7th)
T1 29 (1.8) 47.63 Ref
T2 45 (2.7) 49.77 0.790
T3 1552 (93.7) 21.03 0.002
T4 30 (1.8) 14.67 <0.001
N stage (7th)
N0 694 (41.9) 29.07 <0.001
N1 962 (58.1) 17.83
M stage (7th)
M0 1589 (96.0) 22.67 <0.001
M1 67 (4.0) 13.10
T stage (8th)
T1 235 (14.2) 33.00 Ref
T2 1066 (64.4) 21.67 <0.001
T3 325 (19.6) 16.73 <0.001
T4 30 (1.8) 14.67 <0.001
N stage (8th)
N0 694 (41.9) 29.07 Ref
N1 725 (43.8) 18.60 <0.001
N2 237 (14.3) 15.83 <0.001
M stage (8th)
M0 1589 (96.0) 21.67 <0.001
M1 67 (4.0) 13.10
CA 19-9
Normal 534 (32.2) 28.30 <0.001
Elevated 1074 (64.9) 18.67
NA 48 (2.9)
CEA
Normal 1237 (74.7) 22.03 0.003
Elevated 247 (14.9) 18.40
NA 172 (10.4)
Adjuvant treatment
None 522 (31.5) 18.47 Ref
CTx 837 (50.5) 23.67 <0.001
CRTx 297 (17.9) 20.07 0.073
Surgery
PD/PPPD 992 (59.9) 22.13 Ref
DPS 466 (28.1) 25.20 0.159
TPS 198 (12.0) 12.50 <0.001
These patients were reclassified in accordance with the eighth edition of the AJCC staging system for PDAC.
T stage was validated with only N0 patients in both the seventh and eighth AJCC staging systems to reduce any bias associated with the presence or absence of lymph node metastasis. N stage was validated in the 1169 in- cluded patients. Staging was also validated in all 1656 pa- tients, including those categorized as T4 and M1 accord- ing to both staging systems, to compare all stages from IA to IV.
Prognostic factors, including staging system and clin- icopathological factors, were evaluated by multivariable regression analysis in all 1656 patients. To evaluate the proposed staging system, tumor size and number of meta- static lymph nodes were evaluated in the 1169 included patients.
This study was approved by Asan Medical Center Institutional Review Board. Our institutional review board waived the need for written informed consent from the participants.
Statistical analysis
Univariate analysis of factors associated with overall survival was performed using the Kaplan-Meier method and compared by the log-rank test. p-values <0.05 were considered statistically significant. Multivariate analysis of all factors found to be significant on univariate analysis was performed using a Cox proportional hazards model.
All statistical analyses were performed using SPSS ver- sion 18.0 (IBM SPSS).
RESULTS
Demographic and clinicopathological factors The demographic and clinicopathological factors of the 1656 patients are shown in Table 3. The 1656 patients included 1009 men (60.9%) and 647 women (39.1%), of median age 61 years (range, 22-88 years). Median tumor diameter was 3 cm (range, 0-17 cm).
Of the patients with PDAC who underwent surgical re- section, 992 (59.9%) underwent pancreaticoduodenectomy or pylorus-preserving pancreaticoduodenectomy. Pathological examination of the resected specimens showed that 1214 (73.3%) of the PDACs were moderately differentiated and that 372 (22.5%) had positive resection margins.
Table 3. Continued
Factors
Univariate analysis All patients,
n (%)
Median survival, months
p
Vessel invasion
None 1157 (69.9) 24.23 Ref
Venous invasion 380 (22.9) 16.57 <0.001 Arterial invasion 59 (3.6) 19.17 0.060
Both 60 (3.6) 15.83 <0.001
Differentiation
WD 179 (10.8) 34.07 Ref
MD 1214 (73.3) 21.37 <0.001
PD 218 (13.2) 12.47 <0.001
NA 45 (2.7)
Lymphovascular invasion
Negative 857 (51.8) 25.20 <0.001
Positive 799 (48.2) 17.83
Perineural invasion
Negative 330 (19.9) 25.43 <0.001
Positive 1326 (80.1) 21.03
Resection margin
Negative 1284 (77.5) 22.37 0.001
Positive 372 (22.5) 18.40
Lymph node metastasis
Negative 675 (40.8) 28.90 <0.001
Positive 981 (59.2) 17.87
CTx, chemotherapy; CRTx, chemoradiotherapy; PD/PPPD, pancreaticoduodenectomy/pylorus-preserving pancreaticoduo- denectomy; DPS, distal pancreatectomy with splenectomy;
TPS, total pancreatectomy with splenectomy; WD, well dif- ferentiated; MD, moderately differentiated; PD, poorly differ- entiated
Classification using the seventh edition of the AJCC staging system showed that 29 (1.8%) patients were clas- sified as T1, 45 (2.7%) as T2, 1552 (93.7%) as T3, and 30 (1.8%) as T4. Moreover, 694 (41.9%) were classified as N0 and 962 (58.1%) as N1. By contrast, classification using the eighth edition of the AJCC staging system showed that 235 (14.2%) patients were classified as T1, 1066 (64.4%) as T2, 325 (19.6%) as T3, and 30 (1.8%) as T4.
The 962 patients classified as N1 using the seventh edi- tion were reclassified according to the eighth edition into N1 and N2, with 725 (43.8%) classified as N1 and 237 (14.3%) as N2, in addition to the 694 (41.9%) classified as N0.
Validation
The eighth edition of the AJCC staging system was va-
lidated in the 1169 included patients. Using the seventh edition, 25 patients were classified as T1, 40 as T2, and 1104 as T3; and 535 were classified as N0 and 634 as N1. Thus, 20, 30, 485, and 634 patients were classified as having stage IA, IB, IIA, and IIB PDACs, respectively.
Using the eighth edition, however, 185 patients were clas- sified as T1, 763 as T2, and 221 as T3. Moreover, 535 patients were classified as N0, 493 as N1, and 141 as N2.
Thus, 118, 327, 90, 493, and 141 patients were classified as having stage IA, IB, IIA, IIB, and III PDACs, res- pectively.
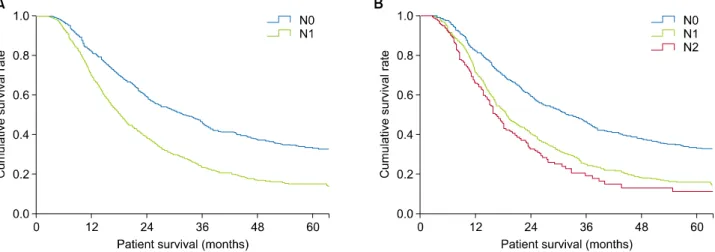
Of patients classified as N0 according to the seventh AJCC staging system, too few patients had T1 tumors to analyze median survival. The 5 year overall survival rate of the T1 group was 51.6%. The median survival periods in patients classified as T2 and T3 were 64.6 and 30.5 months, respectively, and their 5 year overall survival rates were 51.6% and 31.3%, respectively. The median survival of patients in the T1 and T2 groups did not differ significantly (p=0.717).
Using the eighth AJCC staging system, the median sur- vival periods of patients classified as T1, T2, and T3 were 43.2, 32.3, and 23.5 months, respectively, and their 5 year overall survival rates were 42.8%, 31.5%, and 27.3%, re- spectively, differing significantly but marginally between the T1 and T2 (p=0.045) and between the T2 and T3 (p=0.049) groups (Fig. 1).
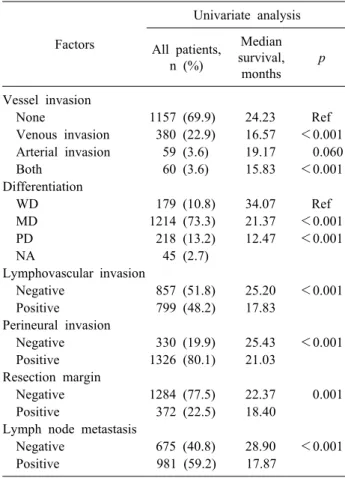
When analyzed by N stage according to the seventh staging system, the median survival periods of patients classified as N0 and N1 were 31.5 and 18.1 months, re- spectively, a difference that was statistically significant (p<0.001). The 5 year survival rates of these two groups were 33.3% and 15.1%, respectively. Using the eighth stag- ing system, the median survival periods of patients classi- fied as N0, N1, and N2 were 31.5, 18.6, and 16.2 months, respectively, differing significantly between the N0 and N1 groups (p<0.001) and significantly but marginally be- tween the N1 and N2 groups (p=0.042; Fig. 2). The 5 year overall survival rates of patients in the N0, N1, and N2 groups were 33.3%, 16.1%, and 11.0%, respectively. To reduce any bias associated with T stage, we compared sur- vival rates between the N stages after T stage was fixed.
We identified 757 patients as T2 stage using the eighth AJCC staging system; those with N0 and N1 according to the seventh staging system had median survival periods
Fig. 2. Overall survival in patients subcategorized by N stage (omitting those with T4, M1, and R1 and those who received neoadjuvant chemotherapy). (A) Overall survival of patients classified by N stage according to the seventh AJCC staging system.
Median survival differed significantly in patients classified as N0 and N1 (32.33 vs. 18.56 months, p<0.001). (B) Overall survival of patients classified by N stage according to the eighth AJCC staging system. Median overall survival in patients classified as N0, N1, and N2 was 32.33, 18.86, and 16.83 months, respectively, with pairwise differences between N0 and N1 (p<0.001) and between N1 and N2 (p=0.042) being statistically significant.
Fig. 1. Overall survival in N0 patients subcategorized by T stage (omitting those categorized as T4, M1, and R1 and those who received neoadjuvant chemotherapy). (A) Overall survival of patients classified by T stage according to the seventh AJCC staging system. Median survival was not assessed in the T1 group because the number of patients was too small. Median survival differed significantly in patients classified as T2 and T3 (64.6 vs. 30.46 months, p=0.026), but not in patients classified as T1 and T2 (p=0.717). (B) Overall survival of patients classified by T stage according to the eighth AJCC staging system. Median survival in patients classified as T1, T2, and T3 was 43.20, 32.32, and 23.46 months, respectively, with pairwise differences between T1 and T2 (p=0.045) and between T2 and T3 (p=0.049) being statistically significant.
of 32.3 and 18.6 months, respectively (p<0.001), and 5 year overall survival rates of 31.5% and 15.0%, respectively.
When N stage in these 757 patients was classified accord- ing to the eighth staging system, those classified as N0, N1, and N2 had median survival periods of 32.3, 18.9, and 16.8 months, respectively, with statistically significant differences between the N0 and N1 (p<0.001) and be- tween the N1 and N2 (p=0.027) groups (Fig. 2). Moreover, the 5 year overall survival rates of patients in the N0, N1,
and N2 groups were 31.5%, 16.4%, and 9.1%, respectively.
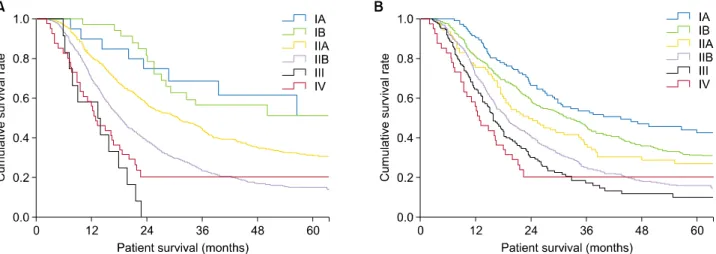
Survival was compared between each pair of stages, in- cluding T4 and M1 tumors. According to the seventh AJCC staging system, 21, 30, 510, 656, 16, and 44 patients were classified as stages IA, IB, IIA, IIB, III, and IV, res- pectively. The median survival period of patients with stage IA could not be determined because of the small number of patients. However, the median survival periods of patients with stages IB, IIA, IIB, III, and IV were 64.6,
Fig. 3. Overall survival in patients subcategorized by stages (omitting those with R1 and those who received neoadjuvant chemo- therapy). (A) Overall survival of patients classified by stage according to the seventh AJCC staging system. Median survival in patients with stage IA tumors was not determined because of the small number of patients. Median survival in patients classi- fied as stages IB, IIA, IIB, III, and IV was 64.6, 29.9, 18.4, 13.2, and 13.1 months, respectively, with pairwise differences between patients with stages IB and IIA (p=0.026), IIA and IIB (p<0.001), and IIB and III (p=0.002) being statistically significant. (B) Overall survival of patients classified by stage according to the eighth AJCC staging system. Median survival in patients classified as stages IA, IB, IIA, IIB, III, and IV was 44.4, 31.5, 22.3, 18.9, 15.9, and 13.1 months, with pairwise differences between patients with stages IA and IB (p=0.045), IB and IIA (p=0.049), IIA and IIB (p=0.022), and IIB and III (p=0.010) being statistically significant.
29.9, 18.4, 13.2, and 13.1 months, respectively, with each pairwise comparison being statistically significant (p<0.05;
Fig. 3) except between stages IA and IB (p=0.536). The 5 year overall survival rates of patients with stages IA, IB, IIA, IIB, III, and IV were 54.8%, 50.8%, 30.2%, 15.2%, 0%, and 26.3%, respectively.
According to the eighth AJCC staging system, 126, 341, 94, 513, 159, and 44 patients were classified as stages IA, IB, IIA, IIB, III, and IV, respectively. Their median over- all survival periods were 44.4, 31.5, 22.3, 18.9, 15.9, and 13.1 months, respectively, with each pairwise comparison being statistically significant (p<0.05) except between stages III and IV (p=0.764). The 5 year overall survival rates in patients classified as stages IA, IB, IIA, IIB, III, and IV were 41.7%, 30.4%, 26.1%, 16.2%, 9.9%, and 26.3%, respectively. The 5 year survival rate in patients with stage IV tumors was not reliable in both staging sys- tems because this group contained selected T4 and M1 pa- tients who underwent surgical treatment.
Analysis of prognostic factors
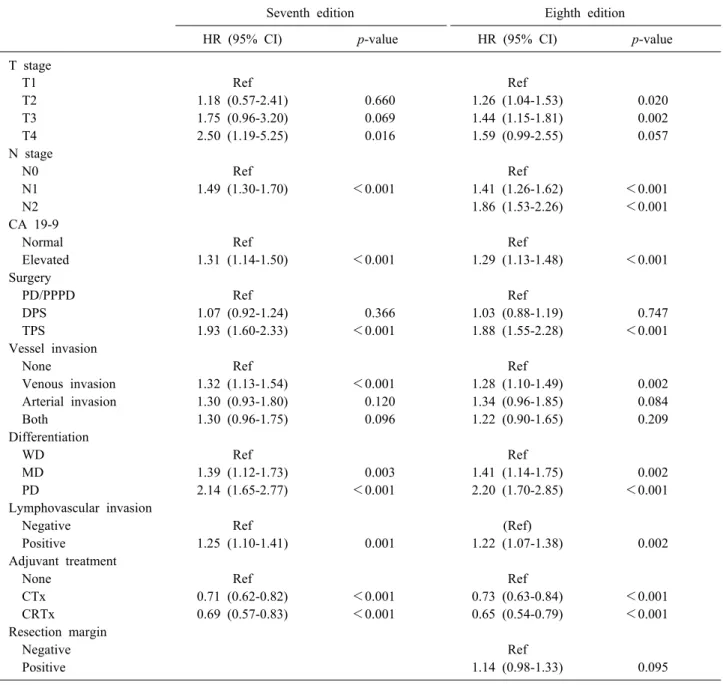
Multivariate analysis of factors associated with overall survival was performed in all patients (Table 4). Factors included in multivariate analysis, in patients grouped by both the seventh and eighth AJCC staging systems, in-
cluded T stage, N stage, serum CA 19-9 concentration, type of surgery, presence or absence of vessel invasion, pathological differentiation, presence or absence of lym- phovascular invasion, and use or nonuse of adjuvant chemotherapy. Using the seventh staging system, how- ever, only stage T4 was significantly associated with sur- vival (p=0.016). By contrast, according to the eighth stag- ing system, each T stage was significantly associated with overall survival. These findings indicated that the T stage of the seventh staging system was not prognostic of over- all survival.
Proposal for upgrading the staging system Although the eighth staging system showed a more even distribution of stages than the seventh staging sys- tem, the former had several limitations. First, the p-values between each pair of T stages were marginal. Second, the difference in median survival between the N1 and N2 groups was only 2 months. Overall survival of the 1169 patients was reanalyzed based on tumor size (Table 5).
Because median tumor size was 3 cm, it was used as a cutoff, with the mean survival differing significantly in patients with tumors <3 cm and ≥3 cm in diameter (p<0.001). Survival, however, varied greatly in patients with tumors >6 cm. We therefore classified the T1 and
Table 4. Multivariate analyses of factors prognostic for overall survival (n=1656)
Seventh edition Eighth edition
HR (95% CI) p-value HR (95% CI) p-value
T stage
T1 Ref Ref
T2 1.18 (0.57-2.41) 0.660 1.26 (1.04-1.53) 0.020
T3 1.75 (0.96-3.20) 0.069 1.44 (1.15-1.81) 0.002
T4 2.50 (1.19-5.25) 0.016 1.59 (0.99-2.55) 0.057
N stage
N0 Ref Ref
N1 1.49 (1.30-1.70) <0.001 1.41 (1.26-1.62) <0.001
N2 1.86 (1.53-2.26) <0.001
CA 19-9
Normal Ref Ref
Elevated 1.31 (1.14-1.50) <0.001 1.29 (1.13-1.48) <0.001
Surgery
PD/PPPD Ref Ref
DPS 1.07 (0.92-1.24) 0.366 1.03 (0.88-1.19) 0.747
TPS 1.93 (1.60-2.33) <0.001 1.88 (1.55-2.28) <0.001
Vessel invasion
None Ref Ref
Venous invasion 1.32 (1.13-1.54) <0.001 1.28 (1.10-1.49) 0.002
Arterial invasion 1.30 (0.93-1.80) 0.120 1.34 (0.96-1.85) 0.084
Both 1.30 (0.96-1.75) 0.096 1.22 (0.90-1.65) 0.209
Differentiation
WD Ref Ref
MD 1.39 (1.12-1.73) 0.003 1.41 (1.14-1.75) 0.002
PD 2.14 (1.65-2.77) <0.001 2.20 (1.70-2.85) <0.001
Lymphovascular invasion
Negative Ref (Ref)
Positive 1.25 (1.10-1.41) 0.001 1.22 (1.07-1.38) 0.002
Adjuvant treatment
None Ref Ref
CTx 0.71 (0.62-0.82) <0.001 0.73 (0.63-0.84) <0.001
CRTx 0.69 (0.57-0.83) <0.001 0.65 (0.54-0.79) <0.001
Resection margin
Negative Ref
Positive 1.14 (0.98-1.33) 0.095
PD/PPPD, pancreaticoduodenectomy/pylorus-preserving pancreaticoduodenectomy; DPS, distal pancreatectomy with splenectomy;
TPS, total pancreatectomy with splenectomy; WD, well differentiated; MD, moderately differentiated; PD, poorly differentiated;
CTx, chemotherapy; CRTx, chemoradiotherapy
T2 groups based on tumor size <3 cm and ≥3 cm.
When survival was analyzed based on the number of metastatic lymph nodes, we found the only difference be- tween patients having 0 and ≥1 metastatic nodes (p<0.001;
Table 6). Therefore, we suggest categorizing N stage as N0 and N1, as in the seventh AJCC staging system.
Analysis of overall survival using this T and N staging system yielded three significantly different groups, with group 1 being those staged as T1N0, group 2 being those
staged as T2N0 and T1N1, and group 3 being those stag- ed as T2N1 (Fig. 4). Comparisons showed statistically sig- nificant differences between patients staged as T1N0 and T2N0 (p<0.001) and T1N1 and T2N1 (p<0.001), but not between those staged as T2N0 and T1N1 (p=0.207).
Table 6. Median survival according to the number of meta- static lymph nodes (n=1169)
Number of LNs
Univariate analysis All patients,
n (%)
Median survival,
months p*
0 513 31.4
1 256 19.0 <0.001
2 140 18.7 0.965
3 95 16.3 0.408
4 53 16.8 0.597
5 33 17.2 0.500
6 14 13.4 0.254
7 15 11.6 0.843
≥8 25 16.2 0.813
LN, lymph node
*p-values compared with the previous group Table 5. Median survival according to tumor size in our data-
base (n=1169)
Tumor size
Univariate analysis All patients,
n (%)
Median survival,
months p*
0-1 cm 12 56.3
>1-2 cm 173 32.5 0.156
>2-3 cm 462 27.2 0.097
>3-4 cm 295 17.8 <0.001
>4-5 cm 111 17.6 0.425
>5-6 cm 59 19.1 0.490
>6-7 cm 19 24.6 0.809
>7-8 cm 9 14.6 0.053
>8 cm 23 15.4 0.740
*p-values compared with the previous group
Fig. 4. Overall survival in patients classified by suggested T and N stages (omitting those with T4, M1, and R1 tumors and those who received neoadjuvant chemotherapy). (A) Overall survival of suggested T stages based on tumor size
<3 cm vs. ≥3 cm (p<0.001). (B) Overall survival at newly suggested N stages based on number of distant metastases 0 vs. ≥1 (p<0.001). (C) Overall survival of each group as- sorted by suggested T and N stages. Three groups were iden- tified, consisting of patients with tumors staged as T1N0 (group 1), T2N0 and T1N1 (group 2), and T2N1 (group 3).
Differences between patients classified as T1N0 and T2N0 (p
<0.001) and those classified as T1N1 and T2N1 (p<0.001) were statistically significant, whereas those between patients classified as T2N0 and T1N1 (p=0.207) were not.
DISCUSSION
PDAC is known for its poor prognosis. Many efforts have been made to determine factors prognostic of surviv-
al in patients with PDAC and to predict prognosis. Among many prognostic factors tested, the TNM staging system has been used as a standard tool to determine the neces- sity for adjuvant treatment. This study was designed to
validate the eighth AJCC staging system for PDAC and to assess factors that may improve patient prognosis.
The eighth AJCC staging system was validated in 1169 patients, after excluding those with T4, R1, and M1 tu- mors and those who did not receive neoadjuvant chemo- therapy. Overall survival did not differ significantly in pa- tients staged as T1 and T2 according to the seventh AJCC staging system, but did differ significantly in each pair of T stage groups according to the eighth AJCC staging system. The eighth staging system showed a more even but marginal distribution of T stages than the seventh staging system.
Using both the seventh and eighth staging systems, we found that overall survival differed significantly between all pairs of N stages. However, overall survival differed marginally in patients staged as N1 and N2 according to the eighth AJCC staging system.
Overall survival did not differ significantly in patients classified as stages IA and IB according to the seventh staging system. However, overall survival in all pairs of stages classified according to the eighth staging system differed significantly. The difference in overall survival between stages III and IV according to both staging sys- tems was not statistically significant, but the result was clinically meaningless, as only patients who underwent surgical resection were included in the analysis, although stage III and IV tumors, which include T4 and M1 tu- mors, respectively, are clinically unresectable.
Multivariate analysis of overall survival in all patients tested many potentially prognostic factors, including T stage, N stage, CA 19-9 level, type of surgery, presence or absence of vessel invasion, pathological differentiation, presence or absence of lymphovascular invasion, and use or nonuse of adjuvant chemotherapy. According to the seventh AJCC staging system, only the results comparing stage T4 with other stages were statistically significant.
By contrast, when the eighth staging system was used, all pairwise comparisons of stages were statistically significant.
In contrast to the seventh staging system, the eighth staging system classifies T stage mainly by tumor size, regardless of tumor extent. Thus, we reanalyzed our data by tumor size, with 3 cm representing the median size.
Overall survival differed significantly in patients with tu- mors <3 cm (classified as T1) and ≥3 cm (classified as T2) in size. Although the eighth staging system classified
N stage into three groups, based on the number of meta- static lymph nodes, reanalysis of our data showed that the only difference in survival was between patients with 0 and ≥1 metastatic lymph nodes, suggesting that N stage should be classified as N0 and N1, as in the seventh stag- ing system. Analysis of overall survival using this modi- fied T and N staging system yielded three significantly different groups, consisting of patients classified as T1N0 (group 1), T2N0 and T1N1 (group 2), and T2N1 (group 3). This grouping system was a better predictor of overall survival than the eighth AJCC staging system.
This study had several limitations, including its analysis of patients from a single center, which may have in- troduced a selection bias. However, because surgical and therapeutic methods were standardized, the data from our center were consistent with those from other centers.
In conclusion, the eighth AJCC staging system showed a more even distribution of tumor stages than the seventh AJCC staging system. However, some differences were marginal, and this new staging system was not an effec- tive predictor of overall survival. Efforts are needed to up- grade the PDAC staging system, as shown by our use of tumor size (<3 cm vs. ≥3 cm) and number of metastatic lymph nodes (0 vs. ≥1). Data from multiple institutions are required to validate our staging system.
ACKNOWLEDGEMENTS
This study was supported by a grant of the Korean Health Technology R&D Project, Ministry of Health and Welfare, Republic of Korea (grant No. HI14C2640). The funders had no role in the study design, data collection and analysis, decision to publish, or preparation of the manuscript.
REFERENCES
1. Conlon KC, Klimstra DS, Brennan MF. Long-term survival after curative resection for pancreatic ductal adenocarcinoma.
Clinicopathologic analysis of 5-year survivors. Ann Surg 1996;223:273-279.
2. Sener SF, Fremgen A, Menck HR, Winchester DP. Pancreatic cancer: a report of treatment and survival trends for 100,313 pa- tients diagnosed from 1985-1995, using the National Cancer Database. J Am Coll Surg 1999;189:1-7.
3. Kindler HL. Pancreatic cancer: an update. Curr Oncol Rep 2007;9:170-176.
4. Geer RJ, Brennan MF. Prognostic indicators for survival after
resection of pancreatic adenocarcinoma. Am J Surg 1993;165:68-72; discussion 72-73.
5. Schnelldorfer T, Ware AL, Sarr MG, Smyrk TC, Zhang L, Qin R, et al. Long-term survival after pancreatoduodenectomy for pancreatic adenocarcinoma: is cure possible? Ann Surg 2008;247:456-462.
6. Nitecki SS, Sarr MG, Colby TV, van Heerden JA. Long-term survival after resection for ductal adenocarcinoma of the pancreas. Is it really improving? Ann Surg 1995;221:59-66.
7. Cleary SP, Gryfe R, Guindi M, Greig P, Smith L, Mackenzie R, et al. Prognostic factors in resected pancreatic ad- enocarcinoma: analysis of actual 5-year survivors. J Am Coll Surg 2004;198:722-731.
8. Edge SB, Compton CC. The American Joint Committee on Cancer: the 7th edition of the AJCC cancer staging manual and
the future of TNM. Ann Surg Oncol 2010;17:1471-1474.
9. Amin MB, Greene FL, Edge SB, Compton CC, Gershenwald JE, Brookland RK, et al. The eighth edition AJCC Cancer Staging Manual: continuing to build a bridge from a population-based to a more "personalized" approach to cancer staging. CA Cancer J Clin 2017;67:93-99.
10. Varadhachary GR, Tamm EP, Abbruzzese JL, Xiong HQ, Crane CH, Wang H, et al. Borderline resectable pancreatic cancer: defi- nitions, management, and role of preoperative therapy. Ann Surg Oncol 2006;13:1035-1046.
11. Bilimoria KY, Bentrem DJ, Ko CY, Tomlinson JS, Stewart AK, Winchester DP, et al. Multimodality therapy for pancreatic can- cer in the U.S. : utilization, outcomes, and the effect of hospital volume. Cancer 2007;110:1227-1234.