ISSN 2234-3806 • eISSN 2234-3814
https://doi.org/10.3343/alm.2017.37.5.371 www.annlabmed.org 371
https://doi.org/10.3343/alm.2017.37.5.371
Accuracy Assessment of Five Equations Used for Estimating the Glomerular Filtration Rate in Korean Adults
Tae-Dong Jeong, M.D.1, Eun-Jung Cho, M.D.2, Woochang Lee, M.D.2, Sail Chun, M.D.2, Ki-Sook Hong, M.D.1, and Won-Ki Min, M.D.2
Department of Laboratory Medicine1, College of Medicine, Ewha Womans University, Seoul; Department of Laboratory Medicine2, University of Ulsan College of Medicine and Asan Medical Center, Seoul, Korea
Background: We aimed to assess the performance of the five creatinine-based equations commonly used for estimates of the glomerular filtration rate (eGFR), namely, the creati- nine-based Chronic Kidney Disease Epidemiology Collaboration (CKD-EPIcr), Asian CKD- EPI, revised Lund–Malmö (revised LM), full age spectrum (FAS), and Korean FAS equa- tions, in the Korean population.
Methods: A total of 1,312 patients, aged 20 yr and above who underwent 51Cr-EDTA GFR measurements (mGFR), were enrolled. The bias (eGFR–mGFR) and precision (root mean square error [RMSE]) were calculated. The accuracy (P30) of four eGFR equations was compared to that of the CKD-EPIcr equation. P30 was defined as the percentage of pa- tients whose eGFR was within±30% of the mGFR.
Results: The mean bias (mL·min-1·1.73 m-2) of the five eGFR equation was as follows:
CKD-EPIcr, –0.6; Asian CKD-EPI, 2.7; revised LM, –6.5; FAS, –2.5; and Korean FAS, –0.2.
The bias of the Asian CKD-EPI, revised LM, and FAS equations showed a significant dif- ference from zero (P <0.001). The RMSE values were as follows: CKD-EPIcr, 15.6; Asian CKD-EPI, 15.6; revised LM, 17.9; FAS, 16.3; and Korean FAS, 15.8. There were no signif- icant differences in the P30 except for the Asian CKD-EPI equation: CKD-EPIcr, 76.6%;
Asian CKD-EPI, 74.7%; revised LM, 75.8%; FAS, 76.0%; and Korean FAS, 75.8%.
Conclusions: The CKD-EPIcr and Korean FAS equations showed equivalent analytical and clinical performances in the Korean adult population.
Key Words: Accuracy, Comparison, Creatinine, Equation, Glomerular filtration rate
Received: December 18, 2016 Revision received: February 8, 2017 Accepted: May 15, 2017
Corresponding author: Won-Ki Min Department of Laboratory Medicine, University of Ulsan College of Medicine and Asan Medical Center, 88 Olympic-ro 43-gil, Songpa-gu, Seoul 05505, Korea
Tel: +82-2-3010-4503 Fax: +82-2-478-0884 E-mail: wkmin@amc.seoul.kr
© Korean Society for Laboratory Medicine This is an Open Access article distributed under the terms of the Creative Commons Attribution Non-Commercial License (http://creativecom- mons.org/licenses/by-nc/4.0) which permits unrestricted non-commercial use, distribution, and reproduction in any medium, provided the original work is properly cited.
INTRODUCTION
The equation derived in the Modification of Diet in Renal Dis- ease (MDRD) study was recommended by the 2002 Kidney Dis- ease Outcomes Quality Initiative of the National Kidney Founda- tion practice guidelines for chronic kidney disease (CKD) to cal- culate the serum creatinine (Scr)-based estimated glomerular filtration rate (eGFR) in adults [1]. Following its introduction, many
clinical laboratories have calculated the eGFR in adults using the MDRD equation and have reported this value along with the Scr concentration via laboratory information systems (LISs). How- ever, the MDRD equation has a major disadvantage, in that bias is increased at higher GFRs [2]. To overcome this limitation, the Scr-based Chronic Kidney Disease Epidemiology Collaboration (CKD-EPIcr) equation was developed, and the eGFR equation recommended for adults in the current 2012 Kidney Disease:
2017-03-16 https://crossmark-cdn.crossref.org/widget/v2.0/logos/CROSSMARK_Color_square.svg
Jeong T-D, et al.
Accuracy of eGFR equations
372 www.annlabmed.org https://doi.org/10.3343/alm.2017.37.5.371 Improving Global Outcomes (KDIGO) guidelines for CKD has
been changed from the MDRD to the CKD-EPIcr equation [2-4].
According to the 2012 KDIGO guidelines for CKD, it is accept- able to use an alternative Scr-based eGFR equation instead of the CKD-EPIcr equation; however, the accuracy of the alterna- tive equation should be compared to that of the CKD-EPIcr equa- tion [4]. New eGFR equations, including the revised Lund–Malmö (revised LM) [5, 6] and full age spectrum (FAS) equations [7], were developed for use with Western (mainly Caucasian) popu- lations. Both equations reportedly produce accurate and precise eGFRs compared with those of the CKD-EPIcr equation [5, 7].
When estimating GFR using the Scr-based eGFR equation, the most significant factor is the Scr concentration, which reflects individual lean body mass that is in turn influenced by sex, age, body mass index (BMI), and race. In addition, laboratory-related factors can affect Scr levels, such as the calibrator used to mea- sure Scr concentration (isotope dilution mass spectrometry [IDMS]- traceable vs non-IDMS-traceable calibrator), type of test reagent (Jaffe vs enzymatic method), and the analytical performance of individual laboratories [8].
The recently introduced FAS and revised LM equations were developed from the Scr results for Caucasians obtained by us- ing an enzymatic method with an IDMS-traceable calibrator [5, 7]. Thus, it was necessary to evaluate whether these equations could be applied to Koreans. Ji et al [9] compared the revised LM equation with the MDRD and CKD-EPI equations for use in Koreans; however, the accuracy of the revised LM equation was not evaluated, because eGFR was not compared with measured GFR (mGFR) in that study. In addition, studies on the perfor- mance evaluation of the Asian CKD-EPI and FAS equations for Koreans are limited. Therefore, the purpose of this study was to assess the analytical and clinical performance of the eGFR equa- tions, including the revised LM and FAS equations, in Koreans.
METHODS
1. Study populationWe reviewed the electronic medical records of patients. The in- clusion criteria were as follows: (1) patients who underwent GFR measurements (mGFR); (2) age ≥20 yr; and (3) Scr concentra- tions measured on the same day of GFR measurement. In total, 3,019 patients underwent mGFR using 51Cr-EDTA between July 2009 and May 2016 at Asan Medical Center (Seoul, Korea).
Among these patients, 2,331 were adults aged 20 yr and above, 1,368 of whom had their Scr concentrations measured on the day of 51Cr-EDTA mGFR. Exclusion criteria were as follows: (1)
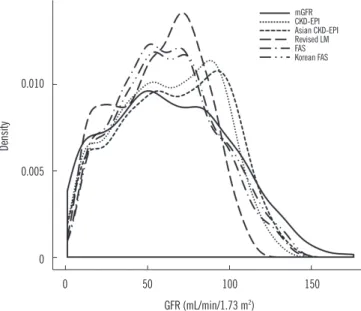
extreme BMI; and (2) a very low Scr concentration. Five sub- jects with a BMI<18.5 kg/m2 and 13 subjects with a BMI>30.0 kg/m2 were excluded. In addition, since most eGFR equations will largely overestimate the true GFR when the Scr concentra- tion is too low, 38 subjects with Scr concentrations lower than the lower limit of the population reference interval (0.73–1.18 mg/dL for Korean adult males and 0.52–0.90 mg/dL for Korean adult females) were excluded. The reference intervals for the Scr assay were established according to the CLSI document EP28-A3C [10] using data from the Korea National Health and Nutrition Examination Survey (KNHANES VI, 2013–2015; see Supplemental Table S1 and Table S2). Finally, a total of 1,312 subjects were included in the study. Of the 1,312 patients, 809 (61.7%) were males. The mean age was 61.8 yr, and the mean Scr concentration was 1.588 mg/dL. The mean 51Cr-EDTA GFR value was 63.4 mL·min-1·1.73 m-2. The detailed characteristics of the study groups and the sex-specific comparisons are pre- sented in Table 1. The distribution of GFR values is summarized in Fig. 1. This study was approved by the Institutional Review Board of Asan Medical Center (approval number: 2016-0535).
2. Measurement of 51Cr-EDTA GFR
GFR was measured by using the radioactive isotope 51Cr-EDTA.
The detailed measurement procedure has been described pre- viously [11]. 51Cr-EDTA GFR was taken as the reference GFR value.
3. Measurement of Scr
Scr concentrations were measured by a rate-blanked compen- sated kinetic Jaffe method (Roche Diagnostics, Indianapolis, IN, USA) using an IDMS-traceable calibrator (C.f.a.s calibrator; Roche Diagnostics). The mean within-laboratory imprecision (%CV) of the Scr assay during the study period was 2.8%.
4. Calculation of eGFR
The eGFR was calculated by using the following equations.
1) CKD-EPIcr equation [2]
eGFRCKD-EPIcr
Where: k, 0.7 for females and 0.9 for males α, –0.329 for females and –0.411 for males 4.1. CKD-EPIcr equation [2]
119
eGFR���������
120
� 1�1 � mi� �Scr
� , 1�
�
�ma� �Scr
� , 1�
������
���������
121
� 1��1� �if female�� 1�1�� �if �lac��
122
Where: �, 0.7 for females and 0.9 for males 123
�, 0.329 for females and 0.411 for males 124
125
4.2. Asian CKD-EPI equation [12]
126
eGFR����� �������
127
� 1�1 � mi� �Scr
� , 1�
�
� ma� �Scr
� , 1�
������
� ��������
128
� ����� �if female�� 1�1� �if �lac�� � 1��� �if ��ia��
129
� 1��1 �if �i��a�ic �r �a�i�e �merica��
130
Where: �, 0.7 for females and 0.9 for males 131
�, 0.328 for females and 0.412 for males 132
133
4.3. Revised LM equation [5]
134
eGFR������� ��� e��������������������� �����
135
Where X = 2.50 + 0.0121 × (150 – Scr) for females with Scr < 150 µmol/L 136
X = 2.50 – 0.926 × ln(Scr/150) for females with Scr ≥ 150 µmol/L 137
4.1. CKD-EPIcr equation [2]
119
eGFR���������
120
� 1�1 � mi� �Scr
� , 1�
�
�ma� �Scr
� , 1�
������
���������
121
� 1��1� �if female�� 1�1�� �if �lac��
122
Where: �, 0.7 for females and 0.9 for males 123
�, 0.329 for females and 0.411 for males 124
125
4.2. Asian CKD-EPI equation [12]
126
eGFR����� �������
127
� 1�1 � mi� �Scr
� , 1�
�
� ma� �Scr
� , 1�
������
� ��������
128
� ����� �if female�� 1�1� �if �lac�� � 1��� �if ��ia��
129
� 1��1 �if �i��a�ic �r �a�i�e �merica��
130
Where: �, 0.7 for females and 0.9 for males 131
�, 0.328 for females and 0.412 for males 132
133
4.3. Revised LM equation [5]
134
eGFR������� ��� e��������������������� �����
135
Where X = 2.50 + 0.0121 × (150 – Scr) for females with Scr < 150 µmol/L 136
X = 2.50 – 0.926 × ln(Scr/150) for females with Scr ≥ 150 µmol/L 137
https://doi.org/10.3343/alm.2017.37.5.371 www.annlabmed.org 373 2) Asian CKD-EPI equation [12]
eGFRAsian CKD-EPI
× 0.993 [if female] × 1.16 [if Black] × 1.05 [if Asian]
× 1.01 [if Hispanic or Native American]
Where: k, 0.7 for females and 0.9 for males α, –0.328 for females and –0.412 for males
3) Revised LM equation [5]
eGFRrevised LM=eX-0.0158×Age+0.438×ln(Age)
Where X= 2.50 + 0.0121×(150–Scr) for females with Scr<150 µmol/L
X= 2.50–0.926×ln(Scr/150) for females with Scr≥150 µmol/L
X= 2.56 + 0.00968×(180–Scr) for males with Scr<180 µmol/L
X= 2.56–0.926×ln(Scr/180) for males with Scr≥180 µmol/L
Table 1. Baseline characteristics of study subjects
Variable Total (N=1,312) Males (N=809) Females (N=503) P
Age (yr) 61.8±13.4 61.2±13.0 62.7±14.1 0.051
Height (cm) 163.3±8.4 167.7±5.8 155.4±6.2 <0.001
Weight (kg) 64.9±10.2 68.7±9.2 58.0±8.2 <0.001
Body mass index (kg/m2) 24.4±2.6 24.5±2.5 24.2±2.9 0.081
Creatinine (mg/dL) 1.588±1.431 1.743±1.514 1.339±1.246 <0.001
mGFR (mL·min-1·1.73 m-2) 63.4±36.4 64.4±36.2 61.8±36.8 0.210
mGFR, N (%) 0.523
≥90 326 (24.8) 200 (24.7) 126 (25.0)
60–89 348 (26.5) 224 (27.7) 124 (24.7)
45–59 195 (14.9) 126 (15.6) 69 (13.7)
30–44 168 (12.8) 100 (12.4) 68 (13.5)
15–29 133 (10.1) 74 (9.1) 59 (11.7)
<15 142 (10.8) 85 (10.5) 57 (11.3)
eGFR (mL·min-1·1.73 m-2)
CKD-EPIcr 62.8±30.5 62.0±29.8 63.9±31.5 0.279
Asian CKD-EPI 66.1±32.1 65.5±31.5 67.0±33.0 0.425
Revised LM 56.8±26.4 55.9±25.4 58.4±27.9 0.104
FAS 60.9±29.1 60.6±28.2 61.2±30.5 0.702
Korean FAS 63.2±30.2 64.4±30.0 61.2±30.5 0.066
Continuous variables are normally distributed and expressed as mean±standard deviation.
Abbreviations: CKD-EPIcr, creatinine-based Chronic Kidney Disease Epidemiology Collaboration; eGFR, estimated glomerular filtration rate; FAS, full age spec- trum; mGFR, measured glomerular filtration rate; Revised LM, revised Lund-Malmö.
Fig. 1. Kernel density plot of glomerular filtration rate (GFR).
Abbreviations: mGFR, measured GFR; FAS, full age spectrum equation; Ko- rean FAS, Korean version of FAS equation; CKD-EPIcr, creatinine-based Chronic Kidney Disease Epidemiology Collaboration equation; revised LM, revised Lund–Malmö equation.
0.010
0.005
0
0 50 100 150
GFR (mL/min/1.73 m2)
Density
mGFRCKD-EPI Asian CKD-EPI Revised LM FASKorean FAS
6
4.1. CKD-EPIcr equation [2]
119
eGFR���������
120
� 1�1 � mi� �Scr
� , 1�
�
�ma� �Scr
� , 1�
������
���������
121
� 1��1� �if female�� 1�1�� �if �lac��
122
Where: �, 0.7 for females and 0.9 for males 123
�, 0.329 for females and 0.411 for males 124
125
4.2. Asian CKD-EPI equation [12]
126
eGFR����� �������
127
� 1�1 � mi� �Scr
� , 1�
�
� ma� �Scr
� , 1�
������
� ��������
128
� ����� �if female�� 1�1� �if �lac�� � 1��� �if ��ia��
129
� 1��1 �if �i��a�ic �r �a�i�e �merica��
130
Where: �, 0.7 for females and 0.9 for males 131
�, 0.328 for females and 0.412 for males 132
133
4.3. Revised LM equation [5]
134
eGFR������� ��� e��������������������� �����
135
Where X = 2.50 + 0.0121 × (150 – Scr) for females with Scr < 150 µmol/L 136
X = 2.50 – 0.926 × ln(Scr/150) for females with Scr ≥ 150 µmol/L 137
Jeong T-D, et al.
Accuracy of eGFR equations
4) FAS equation [7]
Where Q is the median Scr value for the age- or sex-specific healthy populations listed in a previous report [7]. The Q-value of the FAS equation was determined with reference to that of a Belgian population, as follows: males aged >20 yr, 0.90 mg/dL (80 μmol/L); and females aged >20 yr, 0.70 mg/dL (62 µmol/L) [7].
To evaluate the Korean version of the FAS equation (Korean FAS), the Q-value for Koreans was calculated from the National Health and Nutrition Examination Survey VI (2013–2015) data.
The Q-value for Koreans was 0.96 mg/dL (85 μmol/L) for males aged >20 yr and was 0.70 mg/dL (62 μmol/L) for females aged
>20 yr (see Supplemental Table S3).
5. Statistical analysis
To assess analytical accuracy, the bias (eGFR–mGFR) of each eGFR equation was calculated, and the one-sample t-test was used to compare the average bias of each eGFR equation in dif- fering significantly from zero. To evaluate clinical accuracy, we calculated the fraction of 51Cr-EDTA GFR ±10% (P10) and ±30%
(P30) of each eGFR equation. The McNemar test was used to compare the P10 and P30 values between equations. The root mean square error (RMSE) was calculated to evaluate the preci- sion of the eGFR equations. Subgroup analyses were performed based on GFR (<60 vs ≥60 mL·min-1·1.73 m-2) and age (<70 vs ≥70 yr old).
The mGFR was divided into six categories (GFR category 1,
≥90; 2, 60–89; 3A, 45–59; 3B, 30–44; 4, 15–29; and 5,<15;
all values are expressed in mL·min-1·1.73 m-2) based on the 2012 KDIGO guidelines [4]. The overall group agreement between mGFR and eGFR categories and the Lin’s concordance correla- tion coefficient (CCC) for group agreement were assessed. Mc- Bride proposed the strength of agreement criteria for Lin’s CCC as follows: <0.90, poor; 0.90–0.95, moderate; 0.95–0.99, sub- stantial; and >0.99, almost perfect [13].
Statistical analyses were performed by using MedCalc (ver.
14.12.0; MedCalc Software, Ostend, Belgium) and Analyse-it for Microsoft Excel software (ver. 4.65.2; Analyse-it Software, Ltd., Leeds, UK). Continuous variables are expressed as mean±SD and categorical variables are expressed as percentages (%). P values<0.05 were considered statistically significant.
RESULTS
1. Accuracy of eGFR values
The mean±SD bias values (mL·min-1·1.73 m-2) of each eGFR equation, when applied to all patients, are shown in Table 2. The bias of the Asian CKD-EPI, revised LM, and FAS showed a sig- nificant difference from zero (P <0.001); however, the bias of the other two equations did not. All five eGFR equations showed a significant negative bias ranging from –15.7 to –2.0 mL·min-1· 1.73 m-2 in the mGFR ≥60 mL·min-1·1.73 m-2 group, whereas all eGFR equations showed a significant positive bias ranging from 3.2 to 7.7 mL·min-1·1.73 m-2 in the mGFR<60 mL·min-1·1.73 m-2 group. In the age-based analysis ( <70 vs ≥70 yr), there was a significant difference in the bias from zero for four of the equations except for the Korean FAS equation (Table 2).
When applied to males, the bias (mL·min-1·1.73 m-2) of the five eGFR equations was as follows: CKD-EPIcr, –2.3±15.5; Asian CKD-EPI, 1.2±15.3; revised LM, –8.5±16.6; FAS, –3.8±16.0;
and Korean FAS, 0.0±15.6. Except for the Korean FAS, the bias of the other four equations was significantly different from zero.
7
X = 2.56 + 0.00968 × (180 – Scr) for males with Scr < 180 µmol/L 138
X = 2.56 – 0.926 × ln(Scr/180) for males with Scr ≥ 180 µmol/L 139
140
4.4. FAS equation [7]
141
eGFR��� � 107.3 Scr Q
��r � � ��e � �0 �e�r�
142
eGFR��� � 107.3 Scr Q
� 0.����������� ��r ��e � �0 �e�r�
143
Where Q is the median Scr value for the age- or sex-specific healthy populations listed in a 144
previous report [7]. The Q-value of the FAS equation was determined with reference to that 145
of a Belgian population, as follows: males aged > 20 years, 0.90 mg/dL (80 μmol/L); and 146
females aged > 20 years, 0.70 mg/dL (62 µmol/L) [7].
147
To evaluate the Korean version of the FAS equation (Korean FAS), the Q-value for 148
Koreans was calculated from the National Health and Nutrition Examination Survey VI 149
(2013–2015) data. The Q-value for Koreans was 0.96 mg/dL (85 μmol/L) for males aged >
150
20 years and was 0.70 mg/dL (62 μmol/L) for females aged > 20 years (see Supplemental 151
Table S3).
152 153
5. Statistical analysis 154
To assess analytical accuracy, the bias (eGFR – mGFR) of each eGFR equation was 155
calculated, and the one-sample t-test was used to compare the average bias of each eGFR 156
equation in differing significantly from zero. To evaluate clinical accuracy, we calculated the 157
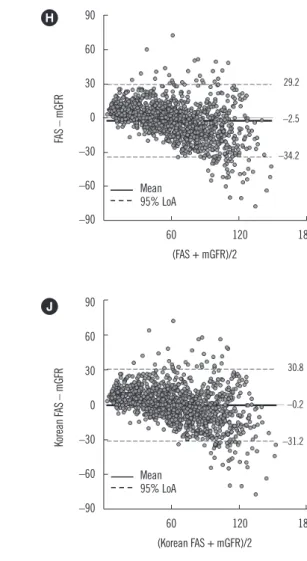
Table 2. Bias of five estimated glomerular filtration rate equations
Group N (%) Mean±SD bias (eGFR–mGFR), mL·min-1·1.73 m-2
CKD-EPIcr Asian CKD-EPI Revised LM FAS Korean FAS
All 1,312 (100) –0.6±15.6 2.7±15.4† –6.5±16.6† –2.5±16.2† –0.2±15.8
mGFR ≥60 mL·min-1·1.73 m-2 674 (51) –6.6±16.9† –2.0±16.9* –15.7±16.3† –10.4±16.6† –7.2±16.6† mGFR <60 mL·min-1·1.73 m-2 638 (49) 5.7±11.1† 7.7±11.6† 3.2±10.2† 5.8±10.6† 7.2±10.8†
Age <70 yr 920 (70) –2.0±16.9† 1.7±16.7* –8.2±17.9† –2.9±17.5† –0.2±17.1
Age ≥70 yr 392 (30) 2.5±11.5† 5.1±11.5† –2.6±12.2† –1.7±12.4* –0.2±12.3
*significant difference from zero, P <0.05; †significant difference from zero, P <0.001.
Abbreviations: CKD-EPIcr, creatinine-based Chronic Kidney Disease Epidemiology Collaboration; eGFR, estimated glomerular filtration rate; FAS, full age spectrum; mGFR, measured glomerular filtration rate; Revised LM, revised Lund-Malmö.
https://doi.org/10.3343/alm.2017.37.5.371 www.annlabmed.org 375 When applied to females, the bias (mL·min-1·1.73 m-2) of the five
eGFR equations was as follows: CKD-EPIcr, 2.1 ±15.3; Asian CKD-EPI, 5.2±15.2; revised LM, –3.4±16.1; FAS, –0.5±16.2;
and Korean FAS, –0.5 ±16.2. Except for the FAS and Korean FAS, the bias of the other three equations showed a significant difference from zero.
The mGFR P30 values are shown in Table 3, and these were similar among the eGFR equations in all subjects (74.7–76.6%).
The P30 of the Asian CKD-EPI equation was significantly lower than that of the CKD-EPIcr equation (P <0.05).
In the mGFR ≥60 mL·min-1·1.73 m-2 group, the P30 of the revised LM was significantly lower than that of the CKD-EPIcr equation (P <0.05), whereas the P30 of the revised LM was sig- nificantly higher than that of the CKD-EPIcr equation (P <0.001) in the mGFR<60 mL·min-1·1.73 m-2 group. The P30 of the Asian CKD-EPI was significantly lower than that of the CKD-EPIcr equa- tion (P <0.05) in the mGFR<60 mL·min-1·1.73 m-2 group.
The RMSE values of the eGFR equations are shown in Table 3, and these were similar for the five equations (range: 15.6–17.9).
2. Comparison between mGFR and eGFR
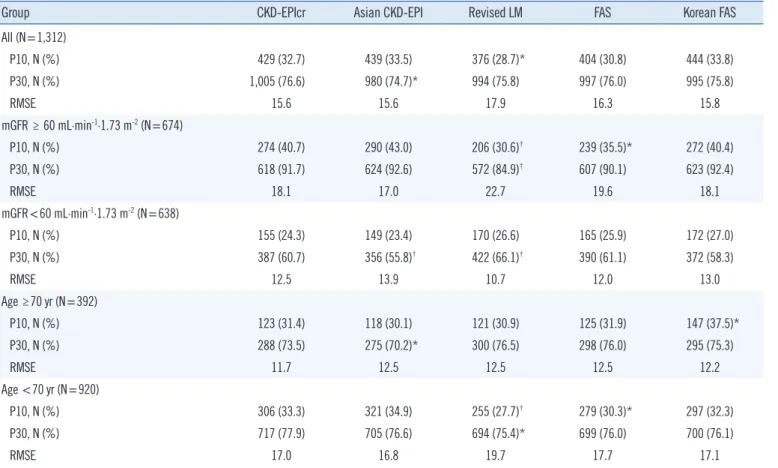
The Lin’s CCC (95% confidence interval) values between the numeric value of mGFR and that of each eGFR equation were as follows: CKD-EPI, 0.892 (0.881–0.902); Asian CKD-EPI, 0.897 (0.886–0.906); revised LM, 0.845 (0.833–0.857); FAS, 0.878 (0.866–0.888); and Korean FAS, 0.888 (0.877–0.898) (Fig. 2).
Table 4 shows the overall group agreement of the six GFR cat- egories between the mGFR and eGFR values of each equation, which were all >50%, with the highest agreement observed for CKD-EPI and Asian CKD-EPI, and the lowest observed for re- vised LM.
DISCUSSION
Although the bias of each eGFR equation varied depending on sex, mGFR, and age group, overall, the mean bias of the CKD- EPIcr and Korean FAS equations was not significantly different from zero. Moreover, among the five eGFR equations, the mean bias of the Korean FAS equation was nearest to zero and was Table 3. Accuracy and precision of five estimated glomerular filtration rate equations
Group CKD-EPIcr Asian CKD-EPI Revised LM FAS Korean FAS
All (N=1,312)
P10, N (%) 429 (32.7) 439 (33.5) 376 (28.7)* 404 (30.8) 444 (33.8)
P30, N (%) 1,005 (76.6) 980 (74.7)* 994 (75.8) 997 (76.0) 995 (75.8)
RMSE 15.6 15.6 17.9 16.3 15.8
mGFR ≥ 60 mL·min-1·1.73 m-2 (N=674)
P10, N (%) 274 (40.7) 290 (43.0) 206 (30.6)† 239 (35.5)* 272 (40.4)
P30, N (%) 618 (91.7) 624 (92.6) 572 (84.9)† 607 (90.1) 623 (92.4)
RMSE 18.1 17.0 22.7 19.6 18.1
mGFR<60 mL·min-1·1.73 m-2 (N=638)
P10, N (%) 155 (24.3) 149 (23.4) 170 (26.6) 165 (25.9) 172 (27.0)
P30, N (%) 387 (60.7) 356 (55.8)† 422 (66.1)† 390 (61.1) 372 (58.3)
RMSE 12.5 13.9 10.7 12.0 13.0
Age ≥70 yr (N=392)
P10, N (%) 123 (31.4) 118 (30.1) 121 (30.9) 125 (31.9) 147 (37.5)*
P30, N (%) 288 (73.5) 275 (70.2)* 300 (76.5) 298 (76.0) 295 (75.3)
RMSE 11.7 12.5 12.5 12.5 12.2
Age <70 yr (N=920)
P10, N (%) 306 (33.3) 321 (34.9) 255 (27.7)† 279 (30.3)* 297 (32.3)
P30, N (%) 717 (77.9) 705 (76.6) 694 (75.4)* 699 (76.0) 700 (76.1)
RMSE 17.0 16.8 19.7 17.7 17.1
P10 and P30 represent the eGFR within the range of ±10% and ±30% of the mGFR, respectively.
*P <0.05 for McNemar test (CKD-EPIcr equation vs each equation); †P <0.001 for McNemar test (CKD-EPIcr equation vs each equation).
Abbreviations: CKD-EPIcr, creatinine-based Chronic Kidney Disease Epidemiology Collaboration; eGFR, estimated glomerular filtration rate; FAS, full age spec- trum; mGFR, measured glomerular filtration rate; Revised LM, revised Lund-Malmö; RMSE, root mean square error.
Jeong T-D, et al.
Accuracy of eGFR equations
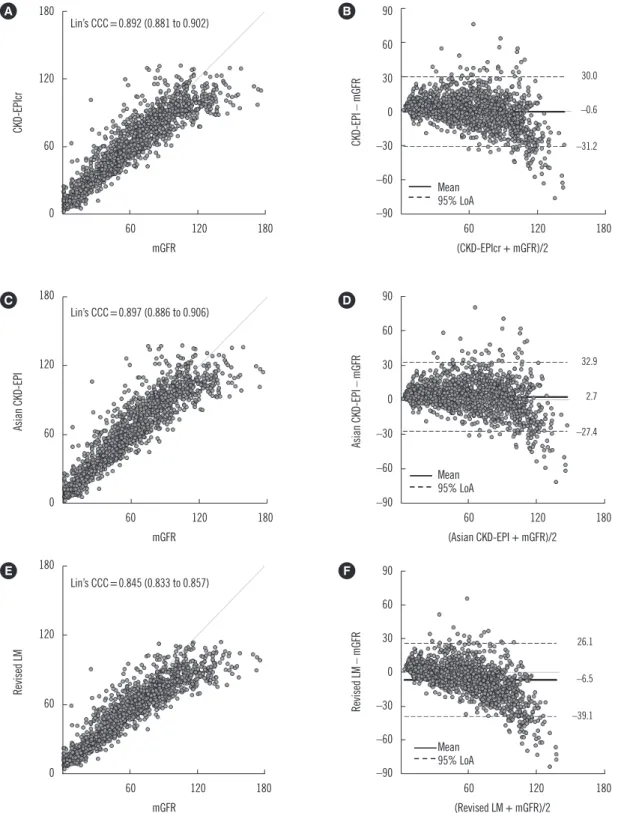
Fig. 2. Comparison between estimated glomerular filtration rate (eGFR) and measured GFR (mGFR). (A and B) Creatinine-based Chronic Kidney Disease Epidemiology Collaboration (CKD-EPIcr) equation; (C and D) Asian CKD-EPI equation; (E and F) Revised Lund–Malmö (Re- vised LM) equation; (G and H) Full-age spectrum (FAS) equation; (I and J) Korean FAS equation. The gray line in the scatter plot represents the identical line. Solid and dashed black lines in the Bland–Altman plot represent the mean and 95% limits of agreement (LoA) of bias, respectively.
Abbreviation: Lin’s CCC, Lin’s concordance correlation coefficient. (Continued to the next page) 180
120
60
0
60 120 180 mGFR
CKD-EPIcr
Lin’s CCC=0.892 (0.881 to 0.902)
A 90
60
30
0
–30
–60
–90
60 120 180 (CKD-EPIcr + mGFR)/2
CKD-EPI – mGFR
Mean95% LoA
30.0 –0.6 –31.2 B
90
60
30
0
–30
–60
–90
60 120 180 (Asian CKD-EPI + mGFR)/2
Asian CKD-EPI – mGFR
Mean 95% LoA
32.9 2.7 –27.4 180 D
120
60
0
60 120 180 mGFR
Asian CKD-EPI
Lin’s CCC=0.897 (0.886 to 0.906) C
180
120
60
0
60 120 180 mGFR
Revised LM
Lin’s CCC=0.845 (0.833 to 0.857)
E 90
60
30
0
–30
–60
–90
60 120 180 (Revised LM + mGFR)/2
Revised LM – mGFR
Mean95% LoA
26.1 –6.5 –39.1 F
https://doi.org/10.3343/alm.2017.37.5.371 www.annlabmed.org 377 smaller than that of the CKD-EPIcr equation (–0.2 vs –0.6). The
P30 values of the five eGFR equations ranged from 74.7% to 76.6%, with the highest value obtained for CKD-EPIcr, and the remaining four equations showing clinically irrelevant differences.
Both the CKD-EPIcr and Asian CKD-EPI equations showed the lowest RMSE value of 15.6; the RMSE values for the revised LM, FAS, and Korean FAS equations were 17.9, 16.3, and 15.8, respectively.
Comparison of the numeric values between mGFR and eGFR showed that although the Lin’s CCC values of the five eGFR equa- tions were all <0.90 (range 0.845–0.897), since both the mGFR and eGFR do not involve analytical chemistry measurement pro- cedures, we considered that a Lin’s CCC range of 0.85 to 0.90 is quite acceptable. Consequently, these results suggest that the Korean FAS equation has equivalent analytical and clinical per- formance to the CKD-EPIcr equation in Korean adults compared with the Asian CKD-EPI, revised LM, and FAS equations. Over-
all, both the CKD-EPIcr and Korean FAS were able to provide precise and accurate GFR estimates, but the other equations were also advantageous in the sub-group analysis. For example, the Asian CKD-EPI and revised LM equations showed the lowest bias for the mGFR ≥ 60 mL·min-1·1.73 m-2 group and for the mGFR<60 mL·min-1·1.73 m-2 group, respectively.
The performance of the eGFR equation could be improved by using coefficients specific for local ethnic groups [8, 12]. The Asian CKD-EPI equation, as one of the four-level race (White and other, Black, Asian, Native American and Hispanic) CKD- EPI equations, was modified from the CKD-EPIcr equation [12].
In a previous study, the bias (eGFR–mGFR, mL·min-1·1.73 m-2) of the Asian CKD-EPI equation was found to be significantly im- proved compared with the CKD-EPIcr equation (–0.8 vs –2.1, P <0.005) [12]. In the present study, however, the mean bias of the Asian CKD-EPI equation was significantly higher than that of the CKD-EPIcr equation (2.7 vs –0.6 mL·min-1·1.73 m-2, P <0.001).
Fig. 2. Continued.
180
120
60
0
60 120 180 mGFR
FAS
Lin’s CCC=0.878 (0.866 to 0.888)
G 90
60
30
0
–30
–60
–90
60 120 180 (FAS + mGFR)/2
FAS – mGFR
Mean 95% LoA
29.2 –2.5 –34.2 H
90
60
30
0
–30
–60
–90
60 120 180 (Korean FAS + mGFR)/2
Korean FAS – mGFR
Mean95% LoA
30.8 –0.2 –31.2 180 J
120
60
0
60 120 180 mGFR
Korean FAS
Lin’s CCC=0.888 (0.877 to 0.898) I
Jeong T-D, et al.
Accuracy of eGFR equations
In addition, the P30 of the Asian CKD-EPI equation was signifi- cantly lower than that of the CKD-EPIcr equation (74.7% vs 76.6%, P <0.05). These conflicting results may be explained by the following reasons. First, the Asian CKD-EPI equation may be less representative because it was developed from a relatively small group of participants (n=100) compared with the White and other (n =5,216), Black (n =2,585), or Native American and Hispanic (n=353) equations. Second, even the same Asian
individual may have different clinical characteristics depending on their local region of origin or residence. Third, several factors related to the above-mentioned Scr assay can have an influence on the results. In a previous study, we reported that the bias of the Korean version of the CKD-EPI equation was significantly smaller than that of the CKD-EPIcr equation (–2.3 vs –3.0 mL·
min-1·1.73 m-2, P <0.001) [11]. Therefore, the bias of the eGFR equation can vary depending on which equation is applied to Table 4. Group agreement between measured and estimated glomerular filtration rates
eGFR (mL·min-1·1.73 m-2) mGFR (mL·min-1·1.73 m-2) Overall group
agreement Lin’s CCC for group agreement (95% CI)
<15 15–29 30–44 45–59 60–89 ≥90
CKD-EPIcr <15 92 12 1 0 0 0 62.6% 0.904 (0.893–0.913)
15–29 45 68 13 0 0 0
30–44 2 41 84 40 5 0
45–59 2 9 58 91 43 0
60–89 1 2 12 59 248 88
≥90 0 1 0 5 52 238
Asian CKD-EPI <15 86 11 1 0 0 0 63.0% 0.903 (0.892–0.912)
15-29 48 60 9 0 0 0
30-44 5 50 80 24 3 0
45–59 2 9 60 93 29 0
60–89 1 2 18 72 229 48
≥90 0 1 0 6 87 278
Revised LM <15 90 11 1 0 0 0 55.2% 0.891 (0.880–0.901)
15–29 48 87 31 1 0 0
30–44 3 26 78 59 6 0
45–59 1 7 51 92 76 2
60–89 0 1 7 41 252 199
≥90 0 1 0 2 14 125
FAS <15 69 4 1 0 0 0 57.1% 0.888 (0.877–0.899)
15–29 65 63 9 1 0 0
30–44 6 54 96 39 1 0
45–59 1 9 53 106 90 0
60–89 1 2 9 46 224 135
≥90 0 1 0 3 33 191
Korean FAS <15 61 3 0 0 0 0 58.5% 0.889 (0.878–0.899)
15–29 73 55 8 1 0 0
30–44 6 62 89 29 1 0
45–59 1 10 59 105 64 0
60–89 1 2 12 55 242 111
≥90 0 1 0 5 41 215
Abbreviations: CI, confidence interval; CKD-EPIcr, creatinine-based Chronic Kidney Disease Epidemiology Collaboration; eGFR, estimated glomerular filtra- tion rate; FAS, full age spectrum; mGFR, measured glomerular filtration rate; Lin’s CCC, Lin’s concordance correlation coefficient; Revised LM, revised Lund- Malmö.
https://doi.org/10.3343/alm.2017.37.5.371 www.annlabmed.org 379 which study group [12, 14].
The revised LM equation showed a positive bias at lower GFR levels and a negative bias at higher GFR levels [5, 15, 16]. Our results are in accordance with these findings: the mean bias of the revised LM equation was lower than that of the CKD-EPIcr equation (3.2 vs 5.7), and the P30 value of the revised LM equa- tion was significantly higher (66.1% vs 60.7%, P <0.001) than that of the CKD-EPIcr equation at mGFR <60 mL·min-1·1.73 m-2. In contrast, the mean bias of the revised LM equation was higher at mGFR ≥60 mL·min-1·1.73 m-2 than that of the CKD- EPIcr equation (–15.1 vs –6.6), and the P30 of the revised LM equation was lower (84.9% vs 91.7%, P <0.001). In other words, the revised LM equation predicted GFR more precisely and ac- curately than the CKD-EPI equation at GFR<60 mL·min-1·1.73 m-2, and the opposite was true for GFR ≥60 mL·min-1·1.73 m-2.
In general, the performance of the eGFR equation reflects the characteristics of the subjects involved in the development of the corresponding eGFR equation. The revised LM equation was intended to improve performance at a lower GFR level, and the median GFR of the study group was 55 mL·min-1·1.73 m-2 [6]. By contrast, the CKD-EPIcr equation was developed to im- prove the performance at a higher GFR level, and the mean GFR of the study group was 68 mL·min-1·1.73 m-2 [2]. There- fore, the characteristics of these research groups are reflected in the performance evaluation conducted in the present study.
In addition to the characteristics of the study participants, per- formance evaluation of the eGFR equations may be influenced by the Scr concentration and GFR measurement methods [8].
For example, the revised LM equation used iohexol to measure GFR, whereas the CKD-EPIcr equation used iothalamate. For measurement of the Scr concentration, the revised LM equation used the enzymatic and modified Jaffe methods according to age, and the CKD-EPIcr equation used the enzymatic method.
These differences in measurement methods could have affected the analytical performance of the eGFR equations.
The FAS equation has a simple structure compared with that of the MDRD, CKD-EPIcr, and revised LM equations. It is very important that the Q-value is set appropriately for application to the FAS equation. Because the Q-value for the FAS equation was derived from a Belgian population, we determined the Ko- rean version of Q-values from a Korean population and com- pared the performance of the FAS equation with that of the Ko- rean FAS equation. Our results showed that the Q-value of Korean males was higher than that of Belgian males (85 vs 80 µmol/L), while the values for females were the same in both populations (62 µmol/L) [7]. This difference may be explained by the char-
acteristics of the population (Belgian vs Korean) or the analytical method used for Scr measurement (Jaffe vs enzymatic method).
In this study, the overall mean bias of the Korean FAS equation was significantly lower than that of the FAS equation (–0.2 vs –2.5, P <0.0001), according to the concept of population-based Scr. These results are consistent with the implications of the FAS equation. Although we did not evaluate children, the FAS equation has the advantage of being able to apply the same equa- tion to the age group of two years and older, unlike the CKD- EPIcr equation.
In conclusion, both the CKD-EPIcr and Korean FAS equations showed equivalent analytical and clinical performances, and thus may be the preferred choice for laboratories to report eGFR along with Scr in the Korean adult population.
Authors’ Disclosures of Potential Conflicts of Interest
No potential conflicts of interest relevant to this article were re- ported.
REFERENCES
1. National Kidney Foundation. K/DOQI clinical practice guidelines for chron- ic kidney disease: evaluation, classification, and stratification. Am J Kid- ney Dis 2002;39(2S1):S1-266.
2. Levey LS, Stevens LA, Schmid CH, Zhang YL, Castro AF 3rd, Feldman HI, et al. A new equation to estimate glomerular filtration rate. Ann In- tern Med 2009;150:604-12.
3. Inker LA, Astor BC, Fox CH, Isakova T, Lash JP, Peralta CA, et al. KDO- QI US commentary on the 2012 KDIGO clinical practice guideline for the evaluation and management of CKD. Am J Kidney Dis 2014;63:713- 35.
4. Kidney Disease: Improving Global Outcomes (KDIGO) CKD Work Group.
KDIGO 2012 Clinical Practice Guideline for the Evaluation and Manage- ment of Chronic Kidney Disease. Kidney Int Suppl (2011) 2013;3:1-150.
5. Nyman U, Grubb A, Larsson A, Hansson LO, Flodin M, Nordin G, et al.
The revised Lund-Malmö GFR estimating equation outperforms MDRD and CKD-EPI across GFR, age and BMI intervals in a large Swedish pop- ulation. Clin Chem Lab Med 2014;52:815-24.
6. Björk J, Grubb A, Sterner G, Nyman U. Revised equations for estimat- ing glomerular filtration rate based on the Lund-Malmö Study cohort.
Scand J Clin Lab Invest 2011;71:232-9.
7. Pottel H, Hoste L, Dubourg L, Ebert N, Schaeffner E, Eriksen BO, et al.
An estimated glomerular filtration rate equation for the full age spectrum.
Nephrol Dial Transplant 2016;31:798-806.
8. Earley A, Miskulin D, Lamb EJ, Levey AS, Uhlig K. Estimating equations for glomerular filtration rate in the era of creatinine standardization: a systematic review. Ann Intern Med 2012;156:785-95.
9. Ji M, Lee YH, Hur M, Kim H, Cho HI, Yang HS, et al. Comparing results of five glomerular filtration rate-estimating equations in the Korean gen- eral population: MDRD Study, revised Lund-Malmö, and three CKD-EPI
Jeong T-D, et al.
Accuracy of eGFR equations
equations. Ann Lab Med 2016;36:521-8.
10. CLSI. Defining, establishing, and verifying reference intervals in the clin- ical laboratory. Approved Guideline-Third Edition. CLSI document EP28- A3c. Wayne, PA: Clinical and Laboratory Standards Institute; 2008.
11. Jeong TD, Lee W, Yun YM, Chun S, Song J, Min WK. Development and validation of the Korean version of CKD-EPI equation to estimate glomer- ular filtration rate. Clin Biochem 2016;49:713-9.
12. Stevens LA, Claybon MA, Schmid CH, Chen J, Horio M, Imai E, et al.
Evaluation of the Chronic Kidney Disease Epidemiology Collaboration equation for estimating the glomerular filtration rate in multiple ethnici- ties. Kidney Int 2011;79:555-62.
13. McBride GB. A proposal for strength-of-agreement criteria for Lin’s con-
cordance correlation coefficient. 2005; NIWA Client Report: HAM2005- 062.
14. Delanaye P, Cavalier E, Mariat C, Krzesinski JM, Rule AD. Estimating glomerular filtration rate in Asian subjects: where do we stand? Kidney Int 2011;80:439-40.
15. Björk J, Grubb A, Sterner G, Back SE, Nyman U. Performance of GFR estimating equations stratified by measured or estimated GFR: Implica- tions for interpretation. Am J Kidney Dis 2015;66:1107-8.
16. Björk J, Grubb A, Larsson A, Hansson LO, Flodin M, Sterner G, et al.
Accuracy of GFR estimating equations combining standardized cystatin C and creatinine assays: a cross-sectional study in Sweden. Clin Chem Lab Med 2015;53:403-14.
https://doi.org/10.3343/alm.2017.37.5.371 www.annlabmed.org
SUPPLEMENTAL MATERIAL
To determine the reference interval and median serum creatinine concentration from the healthy Korean adult population, we used the Korea National Health and Nutrition Examination Survey (KNHANES VI, 2013-2015) data. The target population of the KNHANES comprises non-institutionalized Korean citizens residing in Korea. We selected healthy adults as the reference individuals using step-by-step selection criteria from the KNHANES VI data. In KNHANES VI, the serum creatinine concentration was measured using a rate-blanked compensated kinetic Jaffe method that is IDMS-traceable (Roche Diagnostics, Indianapolis, IN, USA) on a Hit- achi automatic chemistry analyzer (Hitachi, Tokyo, Japan).
Supplemental Table S1. Korean healthy adult selection process from the Korea National Health and Nutrition Examination Survey (KNHANES VI, 2013–2015) data
Step Exclusion criteria 2013 (N=8,018) 2014 (N=7,550) 2015 (N=7,380)
Number of excluded participants at each step
1 Age <20 yr old 1,990 1,653 1,525
2 Missing data (health questionnaire) 579 535 365
3 Missing data (serum creatinine) 513 570 350
4 Missing data (dipstick urinalysis) 301 263 219
5 History of hypertension 952 937 1,207
6 History of diabetes 161 140 157
7 History of dyslipidemia 237 253 283
8 History of stroke 15 24 18
9 History of acute myocardial infarction 7 5 10
10 History of angina 19 20 20
11 Current smoking 747 666 626
12 High blood pressure* 269 212 252
13 Hemoglobin A1c ≥ 6.5% 72 81 64
14 Body mass index >30.0 or <18.5 kg/m2 163 204 184
15 Proteinuria on dipstick ≥1† 11 6 14
16 Glucosuria on dipstick ≥1† 3 7 6
17 Outliers† 18 20 14
Total number of participants (%) 8,018 (100) 7,550 (100) 7,380 (100)
Total number of excluded participants (%) 6,057 (76) 5,596 (74) 5,314 (72)
Final enrollment (%) 1,961 (24) 1,954 (26) 2,066 (28)
*systolic blood pressure≥140 mm Hg or diastolic blood pressure≥90 mm Hg. †Three methods (visual inspection, D/R rule [absolute difference between ex- treme result and the next largest or smallest result/range of all observations including extreme results], and Tukey rule) were used to detect outliers accord- ing to the CLSI document EP28-A3C (CLSI. Defining, Establishing, and Verifying Reference Intervals in the Clinical Laboratory; Approved Guideline-Third Edi- tion. CLSI document EP28-A3c. Wayne, PA: Clinical and Laboratory Standards Institute; 2008.).
Jeong T-D, et al.
Accuracy of eGFR equations
Supplemental Table S2. Reference interval of serum creatinine in adult Koreans: data from the Korea National Health and Nutrition Exami- nation Survey (KNHANES VI, 2013–2015)
Year Males Females
N Lower (mg/dL) Upper (mg/dL) N Lower (mg/dL) Upper (mg/dL)
2013 601 0.74 1.18 1,360 0.53 0.90
2014 574 0.71 1.16 1,380 0.52 0.89
2015 670 0.75 1.19 1,396 0.51 0.92
Total 1,845 0.73 1.18 4,136 0.52 0.90
The reference interval was established according to the CLSI document EP28-A3C (CLSI. Defining, Establishing, and Verifying Reference Intervals in the Clinical Laboratory; Approved Guideline-Third Edition. CLSI document EP28-A3c. Wayne, PA: Clinical and Laboratory Standards Institute; 2008.).
Supplemental Table S3. Median serum creatinine concentrations in adult Koreans: data from the Korea National Health and Nutrition Ex- amination Survey (KNHANES VI, 2013–2015)
Year
Males Females
N Median serum creatinine
N Median serum creatinine
mg/dL µmol/L mg/dL µmol/L
2013 601 0.97 86 1,360 0.70 62
2014 574 0.94 83 1,380 0.69 61
2015 670 0.97 86 1,396 0.71 63
Total 1,845 0.96 85 4,136 0.70 62