ABSTRACT
Purpose: The American Joint Committee on Cancer 8th edition (AJCC8) prognostic stage (PS) was implemented January 1, 2018, but it is complex due to multiple permutations. A North American group proposed a simpler system using the anatomic stage with a risk score system (RSS) of 1 point each for grade 3 tumor and human epithelial growth factor receptor 2 (HER2) and estrogen receptor (ER) negativity. Here we aimed to evaluate this risk score system with our database of Asian breast cancer patients and compare it against the AJCC8 PS.
Methods: Patients diagnosed with breast cancer stage I–IV in 2006–2012 were identified in the SingHealth Joint Breast Cancer Registry. Five-year breast cancer-specific survival (CSS) and overall survival (OS) were calculated for each anatomic stage according to the risk score and compared with the AJCC8 PS.
Results: A total of 6,656 patients were analyzed. The median follow-up was 61 (interquartile range, 37–90) months. There was a high receipt of endocrine therapy (84.6% of ER+ patients), chemotherapy (84.3% of node-positive patients), and trastuzumab (86.0% of HER2+ patients).
Within each anatomic stage, there were significant differences in survival in all sub-stages except IIIB. On multivariate analysis, the hazard ratio for negative ER was 1.74 (1.48–2.06), for negative HER2 was 1.49 (1.26–1.74), and for grade 3 was 1.84 (1.55–2.19). On multivariate analysis controlled for age, ethnicity, and receipt of chemotherapy, the RSS (Akaike information criterion [AIC] = 10,649.45; Harrell's Concordance Index [C] = 0.85) was not inferior to the AJCC8 PS (AIC = 10,726.65; C = 0.84) for CSS, nor was the RSS (AIC = 14,714.4; C = 0.82) inferior to the AJCC8 PS (AIC = 14,784.69; C = 0.81) for OS.
Conclusion: The RSS is comparable to the AJCC8 PS for a patient population receiving chemotherapy as well as endocrine- and HER2-targeted therapy and further stratifies stage IV patients.
Keywords: Biomarkers; Breast neoplasms; Neoplasm staging prognosis; Survival
INTRODUCTION
The 8th Edition of the American Joint Committee on Cancer Staging Manual (AJCC8) was implemented on January 1, 2018. The AJCC8 represented a significant change from previous
Original Article
Received: Oct 15, 2018 Accepted: Mar 9, 2019 Correspondence to Ru Xin Wong
Department of Radiation Oncology, National Cancer Centre National Cancer Centre Singapore, 11 Hospital Dr, Singapore 169610.
E-mail: [email protected]
© 2019 Korean Breast Cancer Society This is an Open Access article distributed under the terms of the Creative Commons Attribution Non-Commercial License (https://
creativecommons.org/licenses/by-nc/4.0/) which permits unrestricted non-commercial use, distribution, and reproduction in any medium, provided the original work is properly cited.
ORCID iDs Yi Heng Seow
https://orcid.org/0000-0001-6743-0556 Ru Xin Wong
https://orcid.org/0000-0002-4973-7404 Weixiang Lian
https://orcid.org/0000-0002-5401-522X Yoon Sim Yap
https://orcid.org/0000-0002-0347-5066 Presentation
This study was presented in an abstract format at the Melbourne International Breast Congress October 2018 as abstract number 121.
Conflict of Interest
The authors declare that they have no competing interests.
Yi Heng Seow 1, Ru Xin Wong 2, John Heng Chi Lim3, Weixiang Lian 2, Yoon Sim Yap 4, Fuh Yong Wong2
1Lee Kong Chian School of Medicine, Nangyang Technological University of Singapore, Singapore
2Department of Radiation Oncology, National Cancer Centre Singapore, Singapore
3Clinical Trials and Epidemiological Sciences, National Cancer Centre Singapore, Singapore
4Department of Medical Oncology, National Cancer Centre Singapore, Singapore
Validation of a Risk Score Incorporating Tumor Characteristics into the
American Joint Committee on Cancer
Anatomic Stage for Breast Cancer
Author Contributions
Conceptualization: Wong RX, Wong FY;
Data curation: Seow YH, Wong RX, Lim JHC, Lian W; Formal analysis: Seow YH, Wong RX, Lim JHC, Lian W; Investigation: Wong RX, Lian W; Methodology: Wong RX; Project administration: Wong RX, Wong FY; Software:
Lim JHC, Lian W; Supervision: Wong RX, Yap YS, Wong FY; Validation: Seow YH, Wong RX, Lim JHC; Visualization: Wong RX, Lian W;
Writing - original draft: Seow YH, Wong RX, Yap YS, Wong FY; Writing - review & editing:
Seow YH, Wong RX, Yap YS, Wong FY.
editions as it incorporated biological markers into the prognostication of breast cancer [1].
Most validation studies have found that the new AJCC8 prognostic stage (AJCC8 PS) provides more accurate prognostication than the anatomic stage [2-5].
Notwithstanding the advantages provided by the new AJCC8 PS, many authors have expressed concerns regarding the complexity of the new system, which includes over 170 subgroups, making it impractical for routine use without references or electronic aids [5-8].
In 2017, Chavez-Macgregor et al. [9] proposed a simpler alternative to the AJCC8 PS in patients with breast cancer. The risk score system (RSS) calculated a risk score based on estrogen receptor (ER) status, human epithelial growth factor receptor 2 (HER2) receptor status, and tumor grade that was then incorporated into the anatomic stage for prognostication. Each anatomic stage would have 4 separate sub-stages with scores of 0–3. The authors verified the RSS using data from 43,938 patients in the California Cancer Registry and concluded that it provided accurate prognostic information. However, this alternative system has not yet been compared with the AJCC8 PS.
The present study was undertaken to determine the validity of the RSS, which has not been done using an external dataset at the time of this writing of this article, and explore the usefulness of the RSS compared to the AJCC8 PS.
METHODS
Study population
Patient information was obtained from the Singhealth Joint Breast Cancer Registry, a prospectively maintained database of patients from Singapore Health Services, a multi- institutional healthcare organization.
Patients diagnosed with invasive breast cancer between January 1, 2006, and December 31, 2014, were identified. This period was selected as routine HER2 testing and treatment with trastuzumab started in 2006. Patients for whom data were incomplete for ER status, HER2 receptor status, or tumor grade were excluded (n = 644). Those for whom data were missing for follow-up time, prognostic staging, or receipt of chemotherapy were also excluded (n = 114). Patients who received neoadjuvant chemotherapy were also excluded. Altogether, data for 6,656 patients were analyzed.
We defined ER, PR, and HER2 positivity in accordance with the recommendations of the 2010 and 2013 American Society of Clinical Oncology/College of American Pathologists [10,11].
Cancer-specific survival (CSS) was defined as the time from diagnosis to death from breast cancer, and deaths from other causes were assessed at the last follow-up. Overall survival (OS) was defined as time from diagnosis to death from any cause and assessed at the last follow-up.
Statistical analysis
Descriptive statistics were used to evaluate the characteristics of the study population.
A Cox proportional hazards model was used to identify factors independently associated with survival. The variables included were based on those previously identified by Chavez-
Macgregor et al. [9] (anatomic stage, ER receptor status, HER2 receptor status, tumor grade, age, ethnicity, and treatment received).
Patients were classified according to their anatomic stage based on the 7th edition of the AJCC [12]. Risk scores for each patient was calculated as per the method followed by Chavez- Macgregor et al. [9]: 1 point was allocated each for ER receptor-negative status, HER2 receptor- negative status, and grade 3 tumor (Table 1). These points are totaled for the calculation of a risk score of 0–3. Patients in each anatomic stage were thus subdivided into 4 ordinal categories (risk score, 0–3). Survival analysis was performed for CSS and OS using the Kaplan-Meier method based on the anatomic stage and risk score. Log-rank tests were then performed to identify differences between the categories (risk score, 0–3) at each anatomical stage.
Akaike information criterion (AIC) and Harrell's concordance index (C-index) were used to compare the RSS and the AJCC8 PS. Adjustments were made for age, ethnicity, and receipt of chemotherapy since these factors affect survival outcomes [13-15].
The level of significance was set at 5% for all statistical tests. All statistical analyses were performed using STATA 15.0 (StataCorp LLC, College Station, USA).
Ethics statement
All procedures performed in studies involving human participants were done so in
accordance with the ethical standards of the institutional and/or national research committee and with the 1964 Helsinki Declaration and its later amendments or comparable ethical standards. The study was approved by the Singapore Health Services Institutional Review Board (reference number 2017/2375). The institutional review board waived the need for informed consent due to the retrospective nature of this study.
RESULTS
Population characteristics
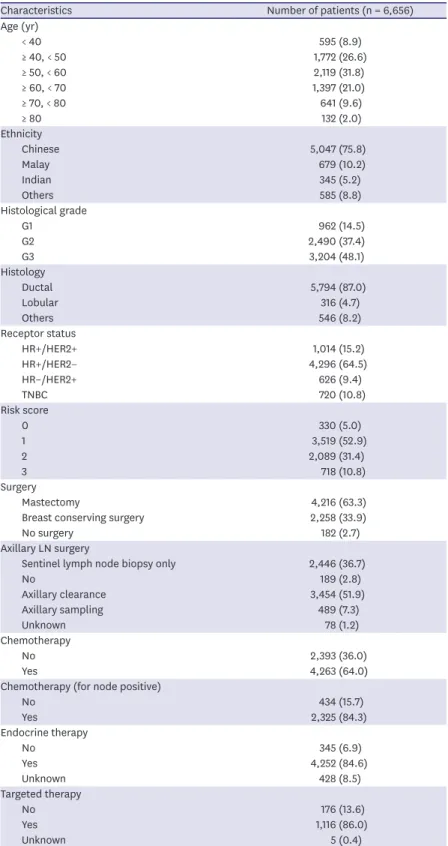
We analyzed a total of 6,656 patients from our database. Their clinicopathological characteristics are listed in Table 2. The median patient age at diagnosis was 54 (range, 19–97) years. The median follow-up was 61 (range, 0.1–43.0) months. Ductal carcinoma was the most common histology in the study cohort (87.0%). Overall, 64.0% of patients received chemotherapy and 84.3% of node- positive patients received adjuvant chemotherapy. Hormone receptor (HR) +/HER2− was the Table 1. Chavez-Macgregor et al. [9] risk score system components
Factors Risk score assigned
Tumour grade
1 0
2 0
3 1
ER status
ER+ 0
ER− 1
HER2 receptor status
HER2+ 0
HER2− 1
ER = estrogen receptor; ER+ = estrogen receptor positive; ER− = estrogen receptor negative; HER2 = human epidermal growth factor receptor 2; HER2+ = human epidermal growth factor receptor 2 positive; HER2− = human epidermal growth factor 2 negative.
Table 2. Patient characteristics and treatment information
Characteristics Number of patients (n = 6,656)
Age (yr)
< 40 595 (8.9)
≥ 40, < 50 1,772 (26.6)
≥ 50, < 60 2,119 (31.8)
≥ 60, < 70 1,397 (21.0)
≥ 70, < 80 641 (9.6)
≥ 80 132 (2.0)
Ethnicity
Chinese 5,047 (75.8)
Malay 679 (10.2)
Indian 345 (5.2)
Others 585 (8.8)
Histological grade
G1 962 (14.5)
G2 2,490 (37.4)
G3 3,204 (48.1)
Histology
Ductal 5,794 (87.0)
Lobular 316 (4.7)
Others 546 (8.2)
Receptor status
HR+/HER2+ 1,014 (15.2)
HR+/HER2− 4,296 (64.5)
HR–/HER2+ 626 (9.4)
TNBC 720 (10.8)
Risk score
0 330 (5.0)
1 3,519 (52.9)
2 2,089 (31.4)
3 718 (10.8)
Surgery
Mastectomy 4,216 (63.3)
Breast conserving surgery 2,258 (33.9)
No surgery 182 (2.7)
Axillary LN surgery
Sentinel lymph node biopsy only 2,446 (36.7)
No 189 (2.8)
Axillary clearance 3,454 (51.9)
Axillary sampling 489 (7.3)
Unknown 78 (1.2)
Chemotherapy
No 2,393 (36.0)
Yes 4,263 (64.0)
Chemotherapy (for node positive)
No 434 (15.7)
Yes 2,325 (84.3)
Endocrine therapy
No 345 (6.9)
Yes 4,252 (84.6)
Unknown 428 (8.5)
Targeted therapy
No 176 (13.6)
Yes 1,116 (86.0)
Unknown 5 (0.4)
All data are presented as number (%).
HR = hormone receptor; HR+ = hormone receptor positive; HR− = hormone receptor negative; HER2 = human epidermal growth factor receptor 2; HER2+ = human epidermal growth factor receptor 2 positive; HER2− = human epidermal growth factor 2 negative; LN = lymph node.
most common tumor subtype (64.5%), followed by HR+/HER2+ (15.2%), triple-negative breast cancer (TNBC; 10.8%), and HR−/HER2+ (9.4%). Of the ER+ patients, 84.6% received endocrine therapy, while 86.0% of HER2+ patients who had chemotherapy received targeted therapy.
Among our patients, 14.0% (n = 932) had ER+/PR− histology. Of these patients with discordant HR, 9.8% (n = 642) were ER+/PR−/HER2− and 4.4% (n = 290) were ER+/PR−/HER2+.
Survival analysis
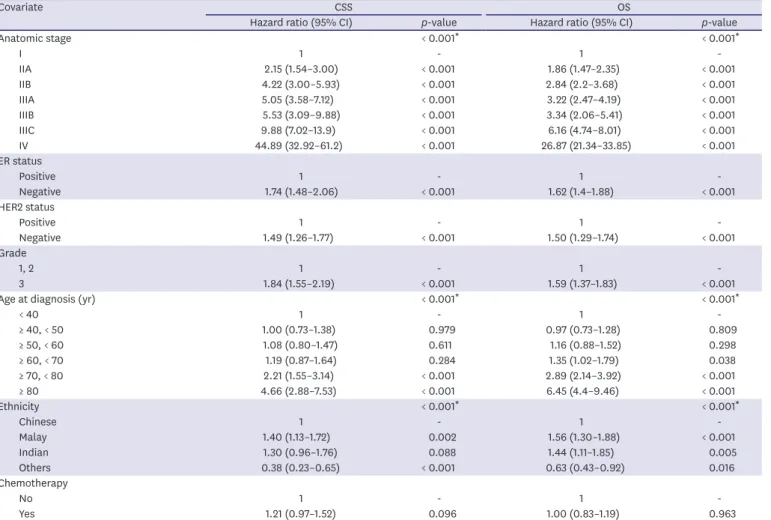
Table 3 shows that on performing multivariate Cox regression analysis, anatomic stage, ER status, HER2 status, and tumor grade were independent predictors of both CSS and OS. The hazard ratio for CSS and OS increased with anatomic stage (with reference to anatomic stage I). ER− patients, compared to ER+ patients, had a hazard ratio of 1.74 and 1.62, respectively, for CSS and OS (p < 0.001 for both). HER2− patients, compared to HER2+ patients, had a hazard ratio of 1.49 and 1.50, respectively, for CSS and OS (p < 0.001 for both). Grade III patients, compared to grade I and II patients, had a hazard ratio of 1.84 and 1.59, respectively, for CSS and OS (p < 0.001 for both).
The CSS and OS survival curves for anatomical stages I–IV stratified by risk scores are shown in Figures 1 and 2. On performing the log-rank test, the risk score stratified well for all stages (p < 0.05) except stage IIIB (p = 0.062 for CSS, p = 0.231 for OS).
Table 3. Cox proportional hazards model evaluating determinants of CSS and OS amongst patients in this study
Covariate CSS OS
Hazard ratio (95% CI) p-value Hazard ratio (95% CI) p-value
Anatomic stage < 0.001* < 0.001*
I 1 - 1 -
IIA 2.15 (1.54–3.00) < 0.001 1.86 (1.47–2.35) < 0.001
IIB 4.22 (3.00–5.93) < 0.001 2.84 (2.2–3.68) < 0.001
IIIA 5.05 (3.58–7.12) < 0.001 3.22 (2.47–4.19) < 0.001
IIIB 5.53 (3.09–9.88) < 0.001 3.34 (2.06–5.41) < 0.001
IIIC 9.88 (7.02–13.9) < 0.001 6.16 (4.74–8.01) < 0.001
IV 44.89 (32.92–61.2) < 0.001 26.87 (21.34–33.85) < 0.001
ER status
Positive 1 - 1 -
Negative 1.74 (1.48–2.06) < 0.001 1.62 (1.4–1.88) < 0.001
HER2 status
Positive 1 - 1 -
Negative 1.49 (1.26–1.77) < 0.001 1.50 (1.29–1.74) < 0.001
Grade
1, 2 1 - 1 -
3 1.84 (1.55–2.19) < 0.001 1.59 (1.37–1.83) < 0.001
Age at diagnosis (yr) < 0.001* < 0.001*
< 40 1 - 1 -
≥ 40, < 50 1.00 (0.73–1.38) 0.979 0.97 (0.73–1.28) 0.809
≥ 50, < 60 1.08 (0.80–1.47) 0.611 1.16 (0.88–1.52) 0.298
≥ 60, < 70 1.19 (0.87–1.64) 0.284 1.35 (1.02–1.79) 0.038
≥ 70, < 80 2.21 (1.55–3.14) < 0.001 2.89 (2.14–3.92) < 0.001
≥ 80 4.66 (2.88–7.53) < 0.001 6.45 (4.4–9.46) < 0.001
Ethnicity < 0.001* < 0.001*
Chinese 1 - 1 -
Malay 1.40 (1.13–1.72) 0.002 1.56 (1.30–1.88) < 0.001
Indian 1.30 (0.96–1.76) 0.088 1.44 (1.11–1.85) 0.005
Others 0.38 (0.23–0.65) < 0.001 0.63 (0.43–0.92) 0.016
Chemotherapy
No 1 - 1 -
Yes 1.21 (0.97–1.52) 0.096 1.00 (0.83–1.19) 0.963
CSS = cancer specific survival; OS = overall survival; CI = confidence interval; ER = estrogen receptor; HER2 = human epithelial growth factor receptor 2.
*Based on likelihood ratio test.
Years 0.2
0
CSS 0.40.6
0.81.0
5
A
1 2 3 4
Log rank p = 0.011
Years 0.2
0
CSS 0.40.6
0.81.0
5
B
1 2 3 4
Log rank p < 0.001
Years 0.2
0
CSS 0.40.6
0.81.0
5
C
1 2 3 4
Log rank p < 0.001
Years 0.2
0
CSS 0.40.6
0.81.0
5
D
1 2 3 4
Log rank p = 0.002
Years 0.2
0
CSS 0.40.6
0.81.0
5
E
1 2 3 4
Log rank p = 0.062
Years 0.2
0
CSS 0.40.6
0.81.0
5
F
1 2 3 4
Log rank p < 0.001
Years 0.2
0
CSS 0.40.6
0.81.0
5
G
1 2 3 4
Log rank p < 0.001 No. at risk
I risk score 0 47 41 39 34 13 0
I risk score 1 639 542 490 394 206 27
I risk score 2 209 165 147 116 64 4
I risk score 3 83 65 51 43 19 1
No. at risk
IIB risk score 0 15 12 9 8 5 0
IIB risk score 1 181 158 133 106 37 3
IIB risk score 2 149 120 99 81 43 6
IIB risk score 3 78 66 52 37 20 2
No. at risk
IIIB risk score 0 1 1 1 1 1 0
IIIB risk score 1 25 21 19 13 5 0
IIIB risk score 2 21 19 14 9 6 0
IIIB risk score 3 6 5 2 2 1 0
No. at risk
IV risk score 0 17 13 11 7 4 1
IV risk score 1 112 97 74 47 21 3
IV risk score 2 123 108 79 43 12 0
IV risk score 3 48 32 13 4 1 0
No. at risk
IIA risk score 0 24 23 17 14 8 0
IIA risk score 1 408 339 296 245 138 11
IIA risk score 2 280 233 203 167 87 5
IIA risk score 3 121 104 88 71 36 2
No. at risk
IIIA risk score 0 24 20 18 10 7 0
IIIA risk score 1 152 130 111 77 38 5
IIIA risk score 2 131 108 88 75 37 2
IIIA risk score 3 38 28 21 18 10 0
No. at risk
IIIC risk score 0 3 3 3 2 0 0
IIIC risk score 1 81 68 53 42 21 0
IIIC risk score 2 126 101 78 56 31 2
IIIC risk score 3 44 33 16 10 3 0
Figure 1. Five-year CSS according to stage (I–IV) stratified by risk score. (a) I, (b) IIA, (c) IIB, (d) IIIA, (e) IIIB, (f) IIIC, (g) IV.
CSS = cancer-specific survival.
Years 0.2
0
OS 0.40.6
0.81.0
5
A
1 2 3 4
Log rank p = 0.077
Years 0.2
0
OS 0.40.6
0.81.0
5
B
1 2 3 4
Log rank p < 0.001
Years 0.2
0
OS 0.40.6
0.81.0
5
C
1 2 3 4
Log rank p < 0.001
Years 0.2
0
OS 0.40.6
0.81.0
5
D
1 2 3 4
Log rank p = 0.001
Years 0.2
0
OS 0.40.6
0.81.0
5
E
1 2 3 4
Log rank p = 0.231
Years 0.2
0
OS 0.40.6
0.81.0
5
F
1 2 3 4
Log rank p < 0.001
Years 0.2
0
OS 0.40.6
0.81.0
5
G
1 2 3 4
Log rank p < 0.001 No. at risk
I risk score 0 47 41 39 34 13 0
I risk score 1 639 542 490 394 206 27
I risk score 2 209 165 147 116 64 4
I risk score 3 83 65 51 43 19 1
No. at risk
IIB risk score 0 15 12 9 8 5 0
IIB risk score 1 181 158 133 106 37 3
IIB risk score 2 149 120 99 81 43 6
IIB risk score 3 78 66 52 37 20 2
No. at risk
IIIB risk score 0 1 1 1 1 1 0
IIIB risk score 1 25 21 19 13 5 0
IIIB risk score 2 21 19 14 9 6 0
IIIB risk score 3 6 5 2 2 1 0
No. at risk
IV risk score 0 17 13 11 7 4 1
IV risk score 1 112 97 74 47 21 3
IV risk score 2 123 108 79 43 12 0
IV risk score 3 48 32 13 4 1 0
No. at risk
IIA risk score 0 24 23 17 14 8 0
IIA risk score 1 408 339 296 245 138 11
IIA risk score 2 280 233 203 167 87 5
IIA risk score 3 121 104 88 71 36 2
No. at risk
IIIA risk score 0 24 20 18 10 7 0
IIIA risk score 1 152 130 111 77 38 5
IIIA risk score 2 131 108 88 75 37 2
IIIA risk score 3 38 28 21 18 10 0
No. at risk
IIIC risk score 0 3 3 3 2 0 0
IIIC risk score 1 81 68 53 42 21 0
IIIC risk score 2 126 101 78 56 31 2
IIIC risk score 3 44 33 16 10 3 0
Figure 2. Five-year OS according to stage (I–IV) stratified by risk score. (a) I, (b) IIA, (c) IIB, (d) IIIA, (e) IIIB, (f) IIIC, (g) IV.
OS = overall survival.
The multivariate Cox model for CSS showed that compared to risk score 0, hazard ratio was 1.10, 1.91, and 3.73 for risk scores of 1, 2, and 3 respectively (Table 4). For OS, compared to risk score 0, hazard ratio was 1.28, 1.88, and 3.55 for risk scores of 1, 2, and 3, respectively (Table 5). The RSS and AJCC8 PS demonstrated excellent discrimination of CSS and OS for our study cohort. Thus, the RSS (AIC = 10,649.45; C-index = 0.85) is not inferior to the AJCC8 PS (AIC = 10,726.654; C-index = 0.84) for CSS, nor is the RSS (AIC = 14,714.4; C-index = 0.82) inferior to the AJCC8 PS (AIC = 14,784.69; C-index = 0.81) for OS.
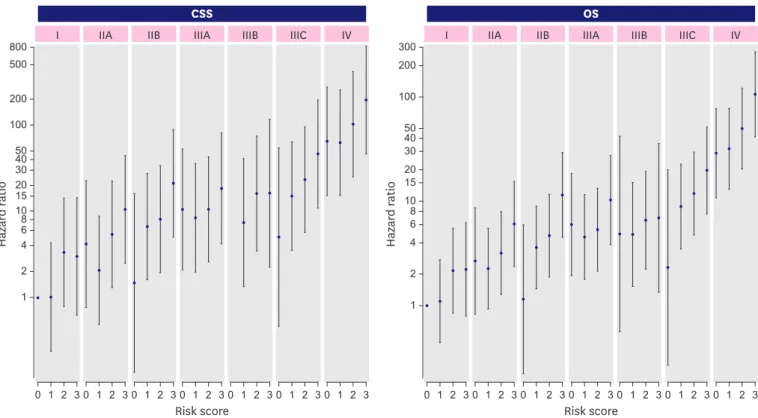
Figure 3 displays the hazard ratio estimates for each combination of anatomic staging and risk score produced by a Cox proportional hazards model adjusted for age, ethnicity, and receipt of chemotherapy. This demonstrated that with more risk factors, hazard ratios generally increased within an anatomic stage; however, a patient with a lower stage but more risk factors may have a higher risk of breast cancer-related death than another patient with a higher stage of disease but fewer risk factors.
Table 4. Multivariable Cox models for CSS
Clinical variables Prognostic stage Anatomic stage + Number of risk factors
Hazard ratio (95% CI) p-value Hazard Ratio (95% CI) p-value
Anatomic stage < 0.001*
I - - 1 -
IIA - - 2.15 (1.54–3.00) < 0.001
IIB - - 4.23 (3.01–5.94) < 0.001
IIIA - - 5.16 (3.67–7.27) < 0.001
IIIB - - 5.61 (3.14–10.02) < 0.001
IIIC - - 10.16 (7.22–14.3) < 0.001
IV - - 45.78 (33.6–62.36) < 0.001
Prognostic stage < 0.001*
I 1 - - -
IIA 2.86 (2.18–3.75) < 0.001 - -
IIB 4.04 (2.96–5.52) < 0.001 - -
IIIA 4.47 (3.33–6.00) < 0.001 - -
IIIB 6.30 (4.65–8.53) < 0.001 - -
IIIC 12.40 (9–17.09) < 0.001 - -
IV 30.75 (24.62–38.41) < 0.001 - -
Number of risk factors < 0.001*
0 - - 1 -
1 - - 1.10 (0.76–1.60) 0.619
2 - - 1.91 (1.32–2.77) 0.001
3 - - 3.73 (2.52–5.53) < 0.001
Age at diagnosis (yr) < 0.001* < 0.001*
< 40 1 - 1 -
≥ 40, < 50 1.00 (0.73–1.38) 0.989 1.01 (0.74–1.39) 0.938
≥ 50, < 60 1.06 (0.78–1.43) 0.720 1.10 (0.81–1.49) 0.558
≥ 60, < 70 1.19 (0.86–1.63) 0.293 1.21 (0.88–1.66) 0.245
≥ 70, < 80 2.27 (1.60–3.22) < 0.001 2.26 (1.59–3.22) < 0.001
≥ 80 4.69 (2.92–7.53) < 0.001 4.58 (2.83–7.41) < 0.001
Ethnicity < 0.001* < 0.001*
Chinese 1 - 1 -
Malay 1.50 (1.21–1.84) < 0.001 1.41 (1.15–1.74) 0.001
Indian 1.36 (1.01–1.84) 0.045 1.30 (0.96–1.76) 0.090
Others 0.39 (0.23–0.65) < 0.001 0.38 (0.23–0.64) < 0.001
Receipt of chemotherapy
No 1 - 1 -
Yes 1.49 (1.2–1.86) < 0.001 1.25 (1.00–1.57) 0.047
AIC 10,726.65 10,649.45
C-index 0.84 0.85
CSS = cancer-specific survival; CI = confidence interval; AIC = Akaike information criterion; C-index = Harrell's concordance index.
*Based on likelihood ratio test.
DISCUSSION
Our study of a large cohort of Asian breast cancer patients treated between 2006 and 2014 revealed that tumor grade, ER status, and HER2 receptor status were independent predictors of 5-year CSS and OS, supporting their use in the RSS. We further demonstrated that the addition of these risk factors into anatomical staging refines the prognostication of patients with breast cancer. These findings concur with those reported by Chavez-Macgregor et al. [9].
Chavez-Macgregor et al. [9] proposed a potentially simple and effective RSS, but it has not been validated by other datasets worldwide; thus, our study aimed to increase evidence of its usefulness.
To our knowledge, this is the first study comparing the RSS with the AJCC8 PS. Our analysis showed that the RSS is not inferior to the AJCC8 PS. This RSS may be a simpler and more Table 5. Multivariable Cox models for OS
Clinical variables Prognostic stage Anatomic stage + Number of risk factors
Hazard Ratio (95% CI) p-value Hazard Ratio (95% CI) p-value
Anatomic stage < 0.001*
I - - 1 -
IIA - - 1.86 (1.47–2.36) < 0.001
IIB - - 2.85 (2.21–3.69) < 0.001
IIIA - - 3.28 (2.52–4.27) < 0.001
IIIB - - 3.41 (2.1–5.51) < 0.001
IIIC - - 6.33 (4.87–8.23) < 0.001
IV - - 27.28 (21.67–34.35) < 0.001
Prognostic stage < 0.001*
I 1 - - -
IIA 2.17 (1.74–2.7) < 0.001 - -
IIB 2.78 (2.13–3.62) < 0.001 - -
IIIA 3.27 (2.57–4.16) < 0.001 - -
IIIB 4.22 (3.27–5.45) < 0.001 - -
IIIC 7.94 (5.99–10.53) < 0.001 - -
IV 19.95 (16.66–23.9) < 0.001 - -
Number of risk factors < 0.001*
0 - - 1 -
1 - - 1.28 (0.93–1.77) 0.135
2 - - 1.88 (1.36–2.6) < 0.001
3 - - 3.55 (2.52–5.01) < 0.001
Age at diagnosis (yr) < 0.001* < 0.001*
< 40 1 - 1 -
≥ 40, < 50 0.95 (0.72–1.27) 0.734 0.97 (0.73–1.3) 0.855
≥ 50, < 60 1.12 (0.86–1.47) 0.401 1.17 (0.89–1.53) 0.267
≥ 60, < 70 1.33 (1.01–1.76) 0.046 1.37 (1.03–1.81) 0.030
≥ 70, < 80 2.93 (2.17–3.96) < 0.001 2.93 (2.16–3.96) < 0.001
≥ 80 6.55 (4.48–9.55) < 0.001 6.34 (4.32–9.3) < 0.001
Ethnicity < 0.001* < 0.001*
Chinese 1 - 1 -
Malay 1.63 (1.36–1.96) < 0.001 1.56 (1.3–1.88) < 0.001
Indian 1.50 (1.17–1.93) 0.002 1.42 (1.1–1.83) 0.007
Others 0.63 (0.44–0.92) 0.017 0.62 (0.43–0.91) 0.013
Chemotherapy
No 1 - 1 -
Yes 1.18 (0.99–1.4) 0.064 1.01 (0.84–1.2) 0.949
AIC 14,784.69 14,714.40
C-index 0.81 0.82
OS = overall survival; CI = confidence interval; AIC = Akaike information criterion; C-index = Harrell's concordance index.
*Based on likelihood ratio test.
user-friendly alternative to the AJCC8 PS with similar discrimination in the prognostication of OS and CSS in breast cancer patients.
Our study did not manage to identify a statistically significant difference between stage IIIB patients. This is likely due to the small number of patients in our cohort with stage IIIB disease (n = 90). However, a visual analysis of the group revealed separation of the survival curves over 5 years.
While we obtained statistically significant results for the stage IIIA group of patients (p < 0.05) and there was good graphical discrimination for the first 4 years, stratification appeared to be lost at year 5. This is likely due to the small numbers of patients involved at year 5 (Figure 1).
An important distinction of the RSS compared to the AJCC8 PS is that stage IV patients are stratified into different subgroups, whereas these metastatic patients under the AJCC8 PS remain in the same group. This is clinically informative and reflects the observed differences in the survival of patients with metastatic breast cancer of different subtypes. It has been shown that that patients with metastatic disease of the HR+/HER2+ subtype have longer survival than those with the HR−/HER2− subtype [16-18].
As noted earlier, there have been challenges in the routine use of the AJCC8 PS. The RSS has several advantages as an alternative tool. First, it is simple and easy to calculate since it uses basic clinical information. Second, it capitalizes on the extensive knowledge of the anatomic staging system that underpins the common language between medical practitioners. It is simpler to build on this basis by incorporating the risk score into the anatomic stage rather
Risk score Risk score
50
0
Hazard ratio
100 200 500 800
1 2 3 I
4030 2015 108 6 4 2 1
0 1 2 3 IIA
0 1 2 3 IIB
0 1 2 3 IIIA
0 1 2 3 IIIB
0 1 2 3 IIIC
0 1 2 3 IV
50
Hazard ratio
100 200 300
4030 2015
108 6 4 2 1
CSS
0 1 2 3 I
0 1 2 3 IIA
0 1 2 3 IIB
0 1 2 3 IIIA
0 1 2 3 IIIB
0 1 2 3 IIIC
0 1 2 3 IV OS
Figure 3. Hazard ratios of breast cancer patients according to stage and risk score. Reference group was stage I risk 0; bars represent 95% confidence intervals.
Data are adjusted for age, ethnicity, and chemotherapy.
CSS = cancer-specific survival; OS = overall survival.
than the use of a cumbersome application to obtain the new AJCC8 PS. Third, it is easy to communicate risk and treatment to patients using this system. Clinicians can inform patients regarding the number of risk factors they have and could also associate treatment regimens such as endocrine therapy or targeted therapy with the risk factors. Finally, the RSS maintains a similar anatomic staging, allowing for comparison to previous legacy studies and registries.
Unfortunately, the RSS is not without its limitations. It does not incorporate the results of gene expression studies such as Oncotype DX™, unlike the AJCC8 PS [1]. Studies have verified the utility of gene expression studies in refining prognosis with potential implications on treatment [19,20]. This may result in difficulties applying the RSS in patients with the same anatomic score and risk factors but different Oncotype DX™ recurrence scores [21]. However, due to the current limited availability of results from these assays and the absence of long-term results from clinical trials, there is little evidence to guide the use of these assays in relation with risk factors [5]. Our study was limited by the lack of Oncotype DX™ data as well.
PR status was also not included in the current RSS. In our cohort, 14.0% (n = 932) of patients were ER+/PR−. Yi et al. [22] found that the staging system that included anatomic stage, grade, and ER had the highest C-index and lowest AIC. Other prognostic nomograms, the NHS predict for example, do not consider PR status either. On the other hand, the AJCC8 PS considers PR status, and in some circumstances, ER+ but PR− upstages a patient. St Gallens 2013 consensus recommended that ER+/PR−/HER2− patients be classified as luminal B, rather than A, reflecting the expert panel's opinion that ER+/PR− is a more aggressive variant [23,24]. Other studies have also shown that ER+ and PR− tumors generally have poorer outcomes. To complicate matters, Prat et al. [25] showed that more than 20% of PR-positive tumor cells were significant for predicting survival differences among luminal A patients.
There is controversy regarding the clinical utility of PR testing. Studies have shown that ER−/
PR+ tumors are not reproducible and that PR provides no actionable information for ER+
tumors such as reported by Hefti et al. [26]. It is beyond the scope of this study to decide whether PR should continue to be routinely tested. However, we have shown that even without PR, the RSS is not inferior to the AJCC8 PS.
The RSS is effective on the assumption that patients receive standard of care as per their biomarker status, e.g. a HER2+ patient should receive targeted therapy. HER2-positive status, which was initially recognized as a negative prognostic factor, has been reversed into a factor that prognosticates better survival with the advent of trastuzumab. Hence, this scoring system may not be applicable to cohorts of patients with HER2+ tumors who do not receive HER2-targeted therapy. This phenomenon has been observed in other studies as well, and it is a problem that the AJCC8 PS is not spared from [17,27]. This scoring system may also need to be modified in the future if there are any new breakthroughs that significantly improve the survival outcomes of subtypes associated with prognosis, such as the TNBC subtype.
The RSS does not re-stage a patient into a higher or low stage; hence, it is not immediately evident how comparable 2 patients are, such as one with a low anatomic stage but a high- risk scores and another with a high anatomic stage but lower risk scores. However, by simply building upon the existing anatomical staging system familiar to most oncologists, the RSS avoids the need for other inconvenient aids such as lengthy conversion tables, making it an attractive tool for everyday use.
We included age, ethnicity, and receipt of chemotherapy in the multivariate analysis as younger patients and Malay ethnicity have been shown in separate studies of the same cohort to be independent risk factors [13-15].
The strength of our study is that the database we used is prospectively maintained. Although not all patients received treatment, there was a high rate of chemotherapy (84.3% of node- positive patients received adjuvant chemotherapy), targeted agent therapy (86.0% of HER2+
breast cancer patients), and endocrine therapy (84.6% of ER+ breast cancer patients).
Our study is limited by its relatively short follow-up duration. We only included patients diagnosed after 2006 since our institution only started routine use of adjuvant trastuzumab for patients with HER2+ disease from that point onward. This is an issue since luminal cancer subtypes may relapse after a longer interval [28].
To allow for wider implementation, more centers should consider adopting the use of this RSS, which is simple yet accurate for refining the prognosis of stage I–IV breast cancers.
Since this is a novel system, we recommend the following nomenclature: anatomic stage IA (RS + 1), stage IV (RS + 2), etc.
The RSS provides a simpler way to integrate biomarkers with the prevalent common language of the anatomic stage in breast cancer patients. It is comparable to the more complex AJCC8 PS in its ability to stage patients by 5-year CSS and OS. Furthermore, it provides meaningful stratification for metastatic patients. Our findings support the use of RSS as a simpler alternative to the AJCC8 PS.
ACKNOWLEDGEMENTS
We thank the multi-disciplinary team involved in the care of these patients and their contribution to the Singhealth Joint Breast Cancer Registry.
REFERENCES
1. Giuliano AE, Connolly JL, Edge SB, Mittendorf EA, Rugo HS, Solin LJ, et al. Breast Cancer-Major changes in the American Joint Committee on Cancer eighth edition cancer staging manual. CA Cancer J Clin 2017;67:290-303.
PUBMED | CROSSREF
2. Hu H, Wei W, Yi X, Xin L, Liu Y. A retrospective analysis of clinical utility of AJCC 8th edition cancer staging system for breast cancer. World J Oncol 2017;8:71-5.
PUBMED | CROSSREF
3. Kim I, Choi HJ, Ryu JM, Lee SK, Yu JH, Kim SW, et al. Prognostic validation of the American joint committee on cancer 8th staging system in 24,014 Korean patients with breast cancer. J Breast Cancer 2018;21:173-81.
PUBMED | CROSSREF
4. Weiss A, Chavez-MacGregor M, Lichtensztajn DY, Yi M, Tadros A, Hortobagyi GN, et al. Validation study of the American Joint Committee on Cancer eighth edition prognostic stage compared with the anatomic stage in breast cancer. JAMA Oncol 2018;4:203-9.
PUBMED | CROSSREF
5. Wong RX, Wong FY, Lim J, Lian WX, Yap YS. Validation of the AJCC 8th prognostic system for breast cancer in an Asian healthcare setting. Breast 2018;40:38-44.
PUBMED | CROSSREF
6. Cserni G, Chmielik E, Cserni B, Tot T. The new TNM-based staging of breast cancer. Virchows Arch 2018;472:697-703.
PUBMED | CROSSREF
7. Li X, Zhang Y, Meisel J, Jiang R, Behera M, Peng L. Validation of the newly proposed American Joint Committee on Cancer (AJCC) breast cancer prognostic staging group and proposing a new staging system using the National Cancer Database. Breast Cancer Res Treat 2018;171:303-13.
PUBMED | CROSSREF
8. Weiss A, King TA, Hunt KK, Mittendorf EA. Incorporating biologic factors into the american joint committee on cancer breast cancer staging system: review of the supporting evidence. Surg Clin North Am 2018;98:687-702.
PUBMED | CROSSREF
9. Chavez-MacGregor M, Mittendorf EA, Clarke CA, Lichtensztajn DY, Hunt KK, Giordano SH.
Incorporating tumor characteristics to the American joint committee on cancer breast cancer staging system. Oncologist 2017;22:1292-300.
PUBMED | CROSSREF
10. Hammond ME, Hayes DF, Dowsett M, Allred DC, Hagerty KL, Badve S, et al. American Society of Clinical Oncology/College of American Pathologists guideline recommendations for immunohistochemical testing of estrogen and progesterone receptors in breast cancer. J Clin Oncol 2010;28:2784-95.
PUBMED | CROSSREF
11. Wolff AC, Hammond ME, Hicks DG, Dowsett M, McShane LM, Allison KH, et al. Recommendations for human epidermal growth factor receptor 2 testing in breast cancer: American Society of Clinical Oncology/
College of American Pathologists clinical practice guideline update. J Clin Oncol 2013;31:3997-4013.
PUBMED | CROSSREF
12. Edge SB. American Joint Committee on Cancer. AJCC Cancer Staging Handbook: from the AJCC Cancer Staging Manual. New York: Springer, 2010.
13. Lee MK, Varzi LA, Chung DU, Cao MA, Gornbein J, Apple SK, et al. The effect of young age in hormone receptor positive breast cancer. BioMed Res Int 2015;2015:325715.
PUBMED | CROSSREF
14. Xin WR, Kwok LL, Yong WF. Screening uptake differences are not implicated in poorer breast cancer outcomes among Singaporean Malay women. J Breast Cancer 2017;20:183-91.
PUBMED | CROSSREF
15. Wong FY, Tham WY, Nei WL, Lim C, Miao H. Age exerts a continuous effect in the outcomes of Asian breast cancer patients treated with breast-conserving therapy. Cancer Commun (Lond) 2018;38:39.
PUBMED | CROSSREF
16. Chia SK, Speers CH, D'yachkova Y, Kang A, Malfair-Taylor S, Barnett J, et al. The impact of new chemotherapeutic and hormone agents on survival in a population-based cohort of women with metastatic breast cancer. Cancer 2007;110:973-9.
PUBMED | CROSSREF
17. Lobbezoo DJ, van Kampen RJ, Voogd AC, Dercksen MW, van den Berkmortel F, Smilde TJ, et al. Prognosis of metastatic breast cancer subtypes: the hormone receptor/HER2-positive subtype is associated with the most favorable outcome. Breast Cancer Res Treat 2013;141:507-14.
PUBMED | CROSSREF
18. Savci-Heijink CD, Halfwerk H, Hooijer GK, Horlings HM, Wesseling J, van de Vijver MJ. Retrospective analysis of metastatic behaviour of breast cancer subtypes. Breast Cancer Res Treat 2015;150:547-57.
PUBMED | CROSSREF
19. Mamounas EP, Tang G, Fisher B, Paik S, Shak S, Costantino JP, et al. Association between the 21-gene recurrence score assay and risk of locoregional recurrence in node-negative, estrogen receptor-positive breast cancer: results from NSABP B-14 and NSABP B-20. J Clin Oncol 2010;28:1677-83.
PUBMED | CROSSREF
20. Sparano JA, Gray RJ, Makower DF, Pritchard KI, Albain KS, Hayes DF, et al. Adjuvant chemotherapy guided by a 21-gene expression assay in breast cancer. N Engl J Med 2018;379:111-21.
PUBMED | CROSSREF
21. Mittendorf EA, Chavez-MacGregor M, Vila J, Yi M, Lichtensztajn DY, Clarke CA, et al. Bioscore: A staging system for breast cancer patients that reflects the prognostic significance of underlying tumor biology.
Ann Surg Oncol 2017;24:3502-9.
PUBMED | CROSSREF
22. Yi M, Mittendorf EA, Cormier JN, Buchholz TA, Bilimoria K, Sahin AA, et al. Novel staging system for predicting disease-specific survival in patients with breast cancer treated with surgery as the first intervention:
time to modify the current American Joint Committee on Cancer staging system. J Clin Oncol 2011;29:4654-61.
PUBMED | CROSSREF
23. Goldhirsch A, Winer EP, Coates AS, Gelber RD, Piccart-Gebhart M, Thürlimann B, et al. Personalizing the treatment of women with early breast cancer: highlights of the St Gallen International Expert Consensus on the Primary Therapy of Early Breast Cancer 2013. Ann Oncol 2013;24:2206-23.
PUBMED | CROSSREF
24. Vasconcelos I, Hussainzada A, Berger S, Fietze E, Linke J, Siedentopf F, et al. The St. Gallen surrogate classification for breast cancer subtypes successfully predicts tumor presenting features, nodal involvement, recurrence patterns and disease free survival. Breast 2016;29:181-5.
PUBMED | CROSSREF
25. Prat A, Cheang MC, Martín M, Parker JS, Carrasco E, Caballero R, et al. Prognostic significance of progesterone receptor-positive tumor cells within immunohistochemically defined luminal A breast cancer. J Clin Oncol 2013;31:203-9.
PUBMED | CROSSREF
26. Hefti MM, Hu R, Knoblauch NW, Collins LC, Haibe-Kains B, Tamimi RM, et al. Estrogen receptor negative/progesterone receptor positive breast cancer is not a reproducible subtype. Breast Cancer Res 2013;15:R68.
PUBMED | CROSSREF
27. Dawood S, Broglio K, Buzdar AU, Hortobagyi GN, Giordano SH. Prognosis of women with metastatic breast cancer by HER2 status and trastuzumab treatment: an institutional-based review. J Clin Oncol 2010;28:92-8.
PUBMED | CROSSREF
28. Metzger-Filho O, Sun Z, Viale G, Price KN, Crivellari D, Snyder RD, et al. Patterns of Recurrence and outcome according to breast cancer subtypes in lymph node-negative disease: results from international breast cancer study group trials VIII and IX. J Clin Oncol 2013;31:3083-90.
PUBMED | CROSSREF