The Degree of Diabetic Retinopathy in Patients with Type 2
Diabetes Correlates with the Presence and Severity of Coronary Heart Disease
Both diabetic retinopathy (DR) and coronary heart disease (CHD) are clinically significant in diabetic patients. We investigated the correlation between the severity of DR and the presence and severity of CHD among type 2 diabetic patients. A total of 175 patients who were examined at the DR clinic and underwent dual-source computed tomography (DSCT) angiography within 6 months were included. The degree of DR was graded as no DR, nonproliferative DR (NPDR), and proliferative DR (PDR). The severity of CHD and the numbers of significant stenotic coronary artery on DSCT angiography according to DR grade were assessed. The mean Agatston Calcium Score (ACS) in patients with PDR was significantly higher than other groups (P < 0.001). The overall odds of an ACS increase were about 4.7-fold higher in PDR group than in no DR group (P < 0.001). In PDR group, in comparison with in no DR, the odds of having 1 or 2 arterial involvement were 3-fold higher (P = 0.044), and those of having 3 were 17-fold higher (P = 0.011). The c-index, one of the predictability values in regression analysis model, was not significantly increased when PDR was added to classical CHD risk factors (0.671 to 0.706, P = 0.111).
Conclusively, patients with PDR develop a greater likelihood of not only having CHD, but being more severe nature. PDR has no additional effect to classical CHD risk factors for predicting CHD.
Keywords: Coronary Heart Disease; Diabetic Retinopathy; Type 2 Diabetes Taewoong Um,1 Dong Hoon Lee,2
Joon-Won Kang,4 Eun Young Kim,5 and Young Hee Yoon3
1Department of Ophthalmology, 38th Fighter Group Medical Station, Gunsan, Korea; 2Department of Ophthalmology, Yonsei Eagle Eye Hospital, Seongnam, Korea; 3Department of Ophthalmology, Asan Medical Center, University of Ulsan, College of Medicine, Seoul, Korea; 4Department of Radiology, Asan Medical Center, University of Ulsan, College of Medicine, Seoul, Korea; 5Department of Radiology, Chonbuk National University Medical School and Hospital, Research Institute of Clinical Medicine, Jeonju, Korea
Received: 10 November 2015 Accepted: 11 May 2016 Address for Correspondence:
Young Hee Yoon, MD
Department of Ophthalmology, Asan Medical Center, University of Ulsan, College of Medicine, 88 Olympic-ro 43-gil, Songpa-gu, Seoul 05505, Korea
E-mail: [email protected]
Funding: This work was supported by Asan Institute for Life Science (08-084).
http://dx.doi.org/10.3346/jkms.2016.31.8.1292 • J Korean Med Sci 2016; 31: 1292-1299
INTRODUCTION
Coronary heart disease (CHD) is a leading cause of death in pa- tients with diabetes mellitus (1,2), and is one of the well-known macrovascular complications of diabetes. Diabetic retinopathy (DR) is also a well-known microvascular complication of dia- betes and a major cause of blindness in diabetes mellitus. Hence, both CHD and DR are clinically very significant with respect to the quality of life of patients with diabetes.
There have been concerns expressed by clinicians regarding the relationships between CHD and DR, and some studies have suggested that microvascular disease may play a prominent role in CHD development in diabetes (3-6). The findings of re- cent studies also suggest that retinopathy is an early sign of oth- er vascular complications and is strongly associated with the development of CHD (3,6-8). A previous study has reported that the patients with diabetes appear to have a higher preva- lence of silent myocardial ischemia and asymptomatic CHD (9,10).
In this regard, an interesting question that arises from a clini-
cal prospective is whether screening for CHD should be intro- duced for asymptomatic patients with DR. Until now, however, no consensus or guidelines have been established. Our present study aimed to quantitatively investigate the relationship be- tween DR and CHD using dual-source computed tomography (DSCT), a method which has gained in popularity in recent years.
MATERIALS AND METHODS
Among the patients with type 2 diabetes who visited the DR clinic of our hospital between January 2009 and July 2011, 194 patients who underwent DSCT within 6 months of these visits were selected for retrospective analysis. After excluding 19 pa- tients due to either a previous CHD event, defined as an inci- dence of myocardial infarction, a myocardial revascularization procedure (e.g., percutaneous coronary intervention or coro- nary artery bypass graft surgery), or incomplete medical records, 175 patients were included in the final study cohort. Informa- tion on the duration of diabetes, any history of smoking, and
any history of cardiac symptoms were obtained from the pa- tients’ medical records. Typical cardiac symptoms were defined as chest pain, dyspnea, fatigue, or diaphoresis on exertion which was relieved by rest. Systemic variables including glycated he- moglobin (HbA1c), systolic blood pressure (SBP), body mass index (BMI), lipid profile, proteinuria and glomerular filtration ratio (GFR) were also evaluated. This study was approved by the Institutional Review Board and Ethics Committee of our hospital and conformed to the tenets of the Declaration of Hel- sinki.
Assessment of DR grading
Fundus photography was performed using a standardized pro- tocol for both eyes of each patient using a 45 degree non-myd- riatic camera. Two photographic fields, centered on the optic disc and macula, were thereby obtained (11) and these retinal photographs were graded by two researchers in a blind man- ner. Disagreements between the researchers were evaluated by third assessor. DR grading was performed in accordance with the Early Treatment for Diabetic Retinopathy Study (ETDRS) severity scale and patients were thereby assigned into one of three possible groups: no DR, nonproliferative diabetic retino- pathy (NPDR), or proliferative diabetic retinopathy (PDR).
Dual-source computed tomography (DSCT) and Agatston calcium score (ACS)
Coronary CT scans were performed using a dual-source CT scan- ner (SOMATOM Definition and Somatom Definition Flash;
Siemens, Erlangen, Germany). Patients with no contraindica- tions for β-adrenergic blocking agents and with initial heart rates greater than 65 beats per minute received an oral dose of 2.5 mg bisoprolol (Concor, Merck, Darmstadt, Germany) 1 hour before the CT examination. Two puffs (2.5 mg) of isosorbide di- nitrate (Isoket Spray, UCB pharma, Monheim, Germany) were sprayed into the oral cavity before each CT examination.
Non-contrast CT scanning for calcium scoring was performed from 1 cm below the tracheal bifurcation to the diaphragm in a cranio-caudal direction. DSCT was performed in a prospective electrocardiogram (ECG)-triggering mode or retrospective ECG- gating mode with ECG-based tube current modulation. During CT acquisition, 60-80 mL of iodinated contrast (Iomeron 400;
Bracco S.P.A., Italy) was injected at 4 mL/second, followed by a 40-mL saline flush. A region of interest was identified in the as- cending aorta and image acquisition was automatically initiat- ed once a selected threshold (100 HU) had been reached using bolus tracking. A standard scanning protocol was then applied and tube voltage and tube current-time product were adjusted by body size as follows: 100 kVp or 120 kVp tube voltage, 240 to 400 mAs per rotation.
The severity of CHD was determined by the degree of calcifi- cation and the numbers of significant stenotic coronary arter-
ies. The Agatston calcium score (ACS) was used to quantify the degree of coronary artery calcification. ‘Significant’ stenosis was defined as a greater than 50% diameter on DSCT. The left main coronary artery (LM), the left anterior descending coro- nary artery (LAD), the left circumflex coronary artery (LCA), and the right coronary artery (RCA) were assessed in these experi- ments.
Statistical analysis
Patients were divided into three groups according to the severi- ty of DR. The mean and standard deviations were calculated for continuous variables, and comparisons between the groups were conducted using the Kruskal-Wallis test for non-continu- ous variables. The percentage of patients was reported for cate- gorical variables and group comparisons were done in these instances using χ2 test.
Multiple linear regression analyses were used to analyze the correlation between ACS and DR severity, adjusting for other attributing factors. The ACS does not follow a normal distribu- tion, so we analyzed these scores following log transformation.
Variables that showed statistically significant differences (at P < 0.05) by univariate analysis were then analyzed using mul- tivariate regression analyses. The duration of diabetes and the classical CHD risk factors such as age, sex, high LDL, low HDL, total cholesterol, high systolic blood pressure, smoking were considered in univariate analysis. In addition, a proportional odds model was used to analyze the risk factors affecting the increased ACS value by categorizing these results into five groups (ACS ≥ 400, 100 ≤ ACS < 400, 10 ≤ ACS < 100, 1 ≤ ACS < 10, or 0 ≤ ACS < 1).
To analyze the correlation between the severity of DR and the number of significant stenotic vessels, we categorized our patient subjects into three groups (no artery involved, 1 or 2 ar- teries involved, and 3 arteries involved). Multinomial logistic regression analyses were done to analyze the risk factors affect- ing the numbers of significant stenotic coronary arteries. The duration of diabetes and the classical CHD risk factors were also considered in univariate analysis.
We also analyzed the correlation between the ACS and the number of significant stenotic vessels using Spearman correla- tion analysis. We also calculated c-index, the predictability val- ue in multinomial logistic regression analysis, to know whether the DR could be an additional risk factor for predicting CHD.
We considered classical CHD risk factors such as age, sex, BMI, total cholesterol, low HDL, SBP, smoking, with or without DR.
P value < 0.05 was considered statistically significant. Statisti- cal analyses were performed using Statistical Analysis System (SAS) version 9.2 (SAS Inc., Cary, NC, USA).
Ethics statement
The study protocol was reviewed and approved by the institu-
tional review board of the Asan Medical Center, Seoul, Korea (IRB No. 2014-0815). Informed consent was waived by the board.
RESULTS
Baseline characteristics
Among the 175 patients we selected for analysis, 38 patients had no DR, and 88 NPDR, and 49 showed PDR. The baseline char- acteristics of each group are summarized in Table 1.
Among these three DR grading groups, there were significant differences in the duration of diabetes (P < 0.001) as well as their mean HbA1c level (P = 0.003). No age or gender differences were observed among groups. In addition, there were no differences in the mean systolic blood pressure (SBP) or the percentage of patients taking anti-hypertensive medication among groups. In addition, the body mass index (BMI), total cholesterol, low- den- sity lipoprotein (LDL), high-density lipoprotein (HDL), statin intake, smoking history, and aspirin intake were not significant- ly different among the three groups. However, nephropathy pa- rameters - the presence of proteinuria and the glomerular fil- tration ratio (GFR) - were found to be significantly related to the severity of DR (P = 0.001, and P < 0.001, respectively).
Interestingly, there were no significant differences in the ex- periencing of cardiac symptoms among the DR groups, when the patients were divided into three symptom categories; typi- cal cardiac symptoms, nonspecific symptoms, and no symptoms.
Forty-one patients (23%) complained of typical chest pain.
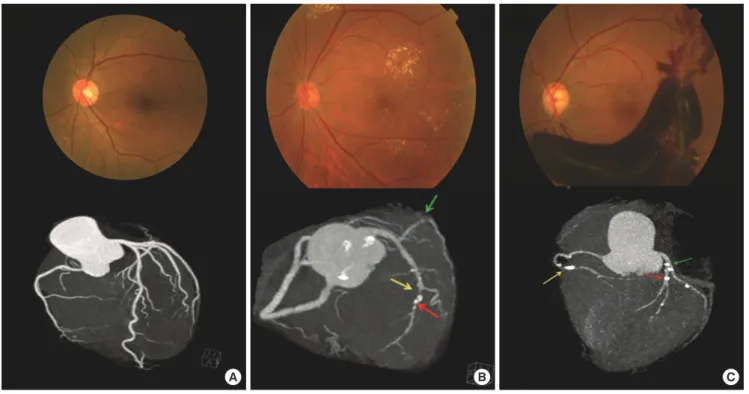
The representative case from each group is presented in Fig.
1. Fig. 1A shows the patient with no DR and no sign of coronary artery stenosis, and the total ACS was zero in this patient. Fig.
1B shows the patient with NPDR and significant stenosis in the mLAD artery (yellow arrow) and dLCX artery (green arrow).
Calcified plaques are evident in the LAD artery (red arrow) and the total ACS of this case as 159.2. Fig. 1C shows the patient with PDR showing significant stenosis in the dRCA (yellow arrow), LAD artery (red arrow) and pLCX artery (green arrow) with heavy calcified plaques. The total ACS in this patient was 374.6.
We also analyzed the relationship between cardiovascular state and cardiac symptoms, and between the ACS values and the number of significant stenotic coronary arteries. The num- ber of significant stenotic coronary arteries showed a significant relationship to the symptom severity (P = 0.019), but the asso- ciation between the ACS and severity of symptoms was not found to be significant (P = 0.309). The number of significant stenotic coronary arteries and the ACS had a significantly positive cor- relation in a Spearman correlation analysis (P < 0.001), with a correlation coefficient (r) of 0.586 (Table 2 and Fig. 2).
Relationship between the DR grading and DSCT findings When the DSCT findings for our patient subjects were analyzed and compared according to the severity of DR, we found a sig- nificant increase in the ACS (P < 0.001), as well as in the num- ber of significant stenotic vessels (P = 0.011), as the DR severity increased (Table 3).
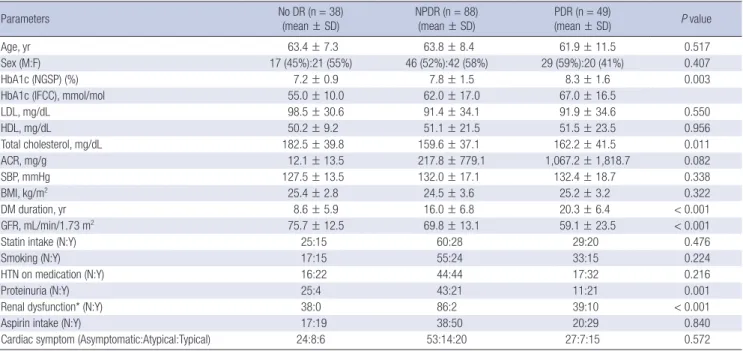
Table 1. Baseline characteristics of the study patients
Parameters No DR (n = 38)
(mean ± SD) NPDR (n = 88)
(mean ± SD) PDR (n = 49)
(mean ± SD) P value
Age, yr 63.4 ± 7.3 63.8 ± 8.4 61.9 ± 11.5 0.517
Sex (M:F) 17 (45%):21 (55%) 46 (52%):42 (58%) 29 (59%):20 (41%) 0.407
HbA1c (NGSP) (%) 7.2 ± 0.9 7.8 ± 1.5 8.3 ± 1.6 0.003
HbA1c (IFCC), mmol/mol 55.0 ± 10.0 62.0 ± 17.0 67.0 ± 16.5
LDL, mg/dL 98.5 ± 30.6 91.4 ± 34.1 91.9 ± 34.6 0.550
HDL, mg/dL 50.2 ± 9.2 51.1 ± 21.5 51.5 ± 23.5 0.956
Total cholesterol, mg/dL 182.5 ± 39.8 159.6 ± 37.1 162.2 ± 41.5 0.011
ACR, mg/g 12.1 ± 13.5 217.8 ± 779.1 1,067.2 ± 1,818.7 0.082
SBP, mmHg 127.5 ± 13.5 132.0 ± 17.1 132.4 ± 18.7 0.338
BMI, kg/m2 25.4 ± 2.8 24.5 ± 3.6 25.2 ± 3.2 0.322
DM duration, yr 8.6 ± 5.9 16.0 ± 6.8 20.3 ± 6.4 < 0.001
GFR, mL/min/1.73 m2 75.7 ± 12.5 69.8 ± 13.1 59.1 ± 23.5 < 0.001
Statin intake (N:Y) 25:15 60:28 29:20 0.476
Smoking (N:Y) 17:15 55:24 33:15 0.224
HTN on medication (N:Y) 16:22 44:44 17:32 0.216
Proteinuria (N:Y) 25:4 43:21 11:21 0.001
Renal dysfunction* (N:Y) 38:0 86:2 39:10 < 0.001
Aspirin intake (N:Y) 17:19 38:50 20:29 0.840
Cardiac symptom (Asymptomatic:Atypical:Typical) 24:8:6 53:14:20 27:7:15 0.572
The ACS, HbA1c, DM duration, and GFR and all other continuous variables were analyzed using the Kruskal Wallis test.
HbA1c, glycated hemoglobin; NGSP, national glycohemoglobin standardization program; IFCC, international federation of clinical chemistry; ACS, Agatston calcium score; LDL, low-density lipoprotein; HDL, high-density lipoprotein; ACR, albumin/creatinine ratio; SBP, systolic blood pressure; BMI, body mass index; GFR, glomerular filtration ratio; HTN, hypertension.
*Renal dysfunction was analyzed using the Fisher’s exact test. All other categorical variables were analyzed by a χ2 test.
Fig. 1. Fundus photographs and coronary CT images of representative cases in each diabetic retinopathy category. (A) A patient with no DR (top) and no sign of coronary artery stenosis. The total ACS was zero in this case. (B) A patient with NPDR (top) and significant stenosis in the mLAD artery (yellow arrow) and dLCX artery (green arrow). Calcified plaques are evident in the LAD artery (red arrow) and the total ACS of this case was 159.2. (C) A patient with PDR (top) showing significant stenosis in the dRCA (yellow arrow), LAD artery (red arrow) and pLCX artery (green arrow) with heavy calcified plaques. The total ACS in this patient was 374.6.
DR, diabetic retinopathy; NPDR, non-proliferative DR; PDR, proliferative DR; ACS, Agatston calcium score; mLAD, mid left anterior descending; dLCX, distal left circumflex;
dRCA, distal right coronary artery.
A B C
Table 2. Relationship between the cardiovascular state and cardiac symptoms
Cardiovascular state Asymptomatic Atypical Typical P value
ACS (mean ± SE) 88.0 ± 322.2 74.8 ± 245.2 93.0 ± 279.2 0.309
No. of significant stenotic coronary arteries (0:1:2:3) 65:16:14:9 23:4:1:1 21:6:3:11 0.019
The ACS was analyzed using the Kruskal-Wallis test, and the number of significant stenotic coronary arteries was analyzed with the Pearson χ2 test.
ACS, Agatston calcium score; SE, standard error.
Fig. 2. Correlation between the number of significant stenotic coronary arteries and the ACS.
ACS, Agatston calcium score.
ACS
# of significant stenotic coronary arteries 0 1 2 3 4 4,000
3,000 2,000 1,000 0
r = 0.586 The correlation between # of significant stenotic
coronary arteries and ACS Age, sex, and aspirin intake were found by univariate analysis
to be influencing factors for the ACS. We further found that as the patient age increased by one year, the odds increased by 1.053-fold (P = 0.001). In male patients, these odds were signifi- cantly higher (about 2.5-fold) compared with female cases (P = 0.001). In patients with aspirin intake, these odds were also sig- nificantly higher (2.134-fold) compared with patients with no aspirin intake (P = 0.007).
When multiple linear regression analysis was conducted in a comparison with no DR cases, the log-transformed ACS was significantly high (up to 1.952) in PDR patients (P < 0.001), but not in NPDR cases (P = 0.125). We also analyzed the possible risk factors for an increased ACS using a proportional odds mod- el. We categorized the patients into five ACS groups based on their scores (ACS ≥ 400, 100 ≤ ACS < 400, 10 ≤ ACS < 100, 1 ≤ ACS < 10, or 0 ≤ ACS < 1), and we calculated the overall odds ratio when the ACS increased from the lower level group to high- er level group.
The odds of a coronary arterial involvement in the PDR group were significantly higher (about 4.7-fold) than the no DR group
Table 3. Relationship between the cardiovascular state and DR severity
Cardiovascular state No DR (n = 38) NPDR (n = 88) PDR (n = 49) P value
ACS (mean ± SE) 170.0 ± 510.6 177.7 ± 311.1 364.9 ± 520.3 < 0.001
No. of significant stenotic coronary arteries (0:1:2:3) 30:4:3:1 58:14:8:8 21:9:7:12 0.011
DR, diabetic retinopathy; NPDR, non-proliferative DR; PDR, proliferative DR; ACS, Agatston calcium score; SE, standard error.
Table 4. Proportional odds model for risk factors affecting the increase in the ACS
Parameters OR 95% Confidence limits P value
Age, yr 1.053 1.021 1.087 0.001
Male 2.518 1.447 4.379 0.001
NPDR (vs. no DR) 1.617 0.807 3.242 0.275
PDR (vs. no DR) 4.747 2.139 10.534 < 0.001
Aspirin intake 2.134 1.233 3.692 0.007
ACS, Agatston calcium score; OR, odds ratio; DR, diabetic retinopathy; NPDR, non- proliferative DR; PDR, proliferative DR.
Fig. 3. The proportional odds ratio for increasing ACS between PDR, NPDR and no DR group, respectively.
ACS, Agatston calcium score; DR, diabetic retinopathy; NPDR, non-proliferative DR;
PDR, proliferative DR.
ACS
NPDR PDR
15
10
5
0
P = 0.275
P < 0.0001 Proportional OR for the increase of ACS
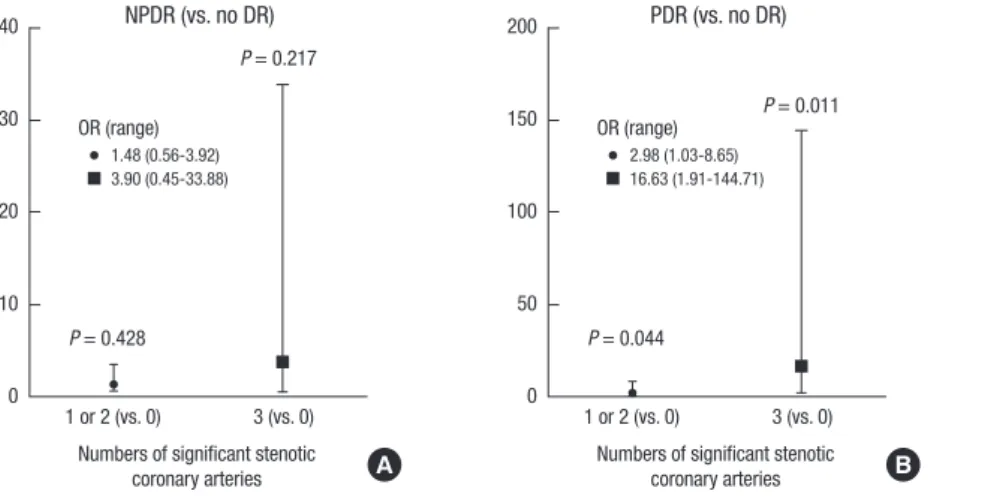
OR (95% CL) 1.617 (0.807-3.242) 4.747 (2.139-10.534) Fig. 4. Odds ratios for significantly stenotic coronary artery numbers among different DR states.
DR, diabetic retinopathy.
1 or 2 (vs. 0) 3 (vs. 0) Numbers of significant stenotic
coronary arteries 40
30
20
10
0
P = 0.428
P = 0.217 NPDR (vs. no DR)
OR (range) 1.48 (0.56-3.92) 3.90 (0.45-33.88)
A
1 or 2 (vs. 0) 3 (vs. 0) Numbers of significant stenotic
coronary arteries 200
150
100
50
0
P = 0.044
P = 0.011 PDR (vs. no DR)
OR (range) 2.98 (1.03-8.65) 16.63 (1.91-144.71)
B
1 or 2 (vs. 0) 3 (vs. 0) Numbers of significant stenotic
coronary arteries 15
10
5
0
P = 0.094
P = 0.008 PDR (vs. NPDR)
OR (range) 2.01 (0.88-4.59) 4.26 (1.45-12.51)
C
(P < 0.001), whilst the odds in the NPDR group were not signifi- cantly different from those in the no DR group (P = 0.275; Table 4 and Fig. 3).
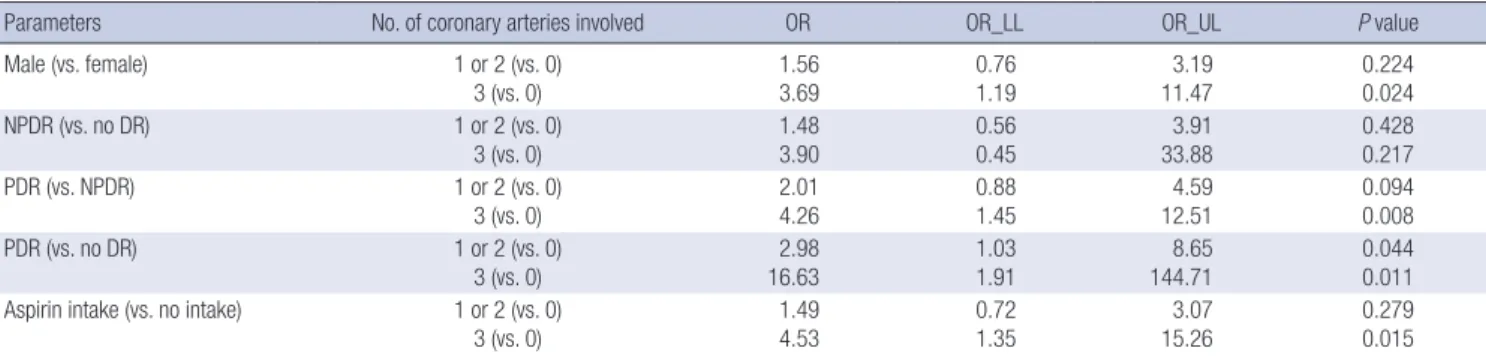
To analyze whether a correlation existed between the severi- ty of DR and the number of significant stenotic vessels, we cate- gorized the patients into three groups (no artery involved, 1 or 2 arteries involved, or 3 arteries involved). Sex and aspirin intake were found to be influencing factors for the number of coro- nary arteries involved, as assessed by univariate analysis. Male patients had increased odds of having three arteries involved compared with female patients (3.69-fold; P = 0.024) and pa- tients who were taking aspirin had increased odds of having three arteries involved compared with those not taking aspirin (4.53-fold; P = 0.015).
Using multinomial logistic regression analysis, the odds of patients with PDR having three artery involvement were 16.63- fold higher (P = 0.011), and those of having 1 or 2 arteries involv- ed were 2.98 times higher (P = 0.044), than no DR patients. When a comparison was made with NPDR patients however, the odds
of having three arteries involved were still significantly higher (4.26-fold higher; P = 0.008), but of having 1 or 2 arteries involv- ed was no longer significant (P = 0.094). In contrast, our NPDR patients did not show a significant increase in the odds of hav- ing a coronary artery involvement over the no DR patients (Ta- ble 5 and Fig. 4).
When we categorized ACS into five groups (ACS ≥ 400, 100
≤ ACS < 400, 10 ≤ ACS < 100, 1 ≤ ACS < 10, or 0 ≤ ACS < 1) and did multinomial logistic regression analysis, the c-index was not significantly increased from 0.671 (without PDR) to 0.706 (with PDR, P = 0.111) (Table 6).
DISCUSSION
It has been speculated that the pathologic processes that occur at the microvascular level may contribute to the pathogenesis of macrovascular complications such as CHD. One hypothesis in this regard is that retinal microvascular abnormalities may reflect an early subclinical coronary or cerebral microvascula- ture and predispose the development of clinical cardiovascular events (3). There have been findings in several studies support- ing the proposition that DR is significantly associated with CHD or increased cardiovascular events (3-6,9,12,13). A prospective cohort study by Cheung et al. (3) has reported that the presence of DR is associated with a 2-fold higher risk of CHD and 3-fold higher risk of fatal CHD and that this is independent of the gly- cemic level or other cardiovascular risk factors. Rosenson et al.
(4) have shown that microvascular diseases such as nephropa- thy, retinopathy and neuropathy can predict macrovascular episodes such as cardiovascular events in patients with type 2 diabetes.
Rong et al. (13) have reported from coronary 64-slice multi- detector computed tomography angiography analysis of Chi- nese patients with type 2 diabetes that DR is associated with coronary atherosclerosis (CAS). The incidence and progression
of DR were also associated with the severity and extent of CAS.
These authors further reported that CAS is significantly associ- ated with the presence of DR and that its prevalence, determin- ed by the number of CAS vessels, showed significant differenc- es among NPDR, pre-PDR and PDR patients.
Our current results are supportive of DR as a risk factor for CHD and that the severity of DR is strongly associated with an increased CHD risk. The major difference between the findings of our present study and those of previous studies is that we eval- uated the ACS and the number of stenotic coronary arteries as a CHD status using DSCT. This method allows the visualization of coronary arteries at raised heart rates and thus reduces the number of inaccessible coronary artery segments because of motion effects when using coronary 64-slice multidetector com- puted tomography angiograph (14,15). In addition, DSCT en- ables the coronary calcium score to be determined as is the case in other coronary CT angiography methods. The coronary cal- cium score is known as a strong predictor of incident CHD and affords more accurate predictive information beyond that pro- vided by standard risk factors (15).
Our current study findings show that the log ACS values were significantly higher (2-fold) in PDR patients compared with no DR patients (P < 0.001). Additionally, we categorized the ACS Table 6. The c-index in multinomial logistic regression analysis for predicting CHD*
Parameters Regression model with DR (c-index: 0.706) Regression model without DR (c-index: 0.671)
Estimate 95% CL P value Estimate 95% CL P value
Age 0.948 0.917-0.981 0.002 0.954 0.923-0.985 0.004
Male (vs. female) 0.311 0.153-0.633 0.001 0.28 0.139-0.563 < 0.001
BMI 1.021 0.935-1.116 0.642 1.01 0.925-1.102 0.828
Total cholesterol 0.998 0.99-1.006 0.642 1 0.992-1.007 0.965
HDL 1.007 0.992-1.021 0.376 1.007 0.992-1.021 0.371
SBP 0.993 0.976-1.011 0.453 0.994 0.977-1.011 0.479
Smoking 1.355 0.643-2.857 0.437 1.573 0.761-3.251 0.395
NPDR (vs. no DR) 0.697 0.325-1.494 0.165
PDR (vs. no DR) 0.215 0.09-0.515 < 0.001
ACS was categorized into five groups (ACS ≥ 400, 100 ≤ ACS < 400, 10 ≤ ACS < 100, 1 ≤ ACS < 10, or 0 ≤ ACS < 1).
CHD, coronary heart disease; ACS, Agatston calcium score; DR, diabetic retinopathy; CL, confidence limits; BMI, body mass index; HDL, high-density lipoprotein; SBP, systolic blood pressure; NPDR, non-proliferative DR; PDR, proliferative DR.
*c-index increase: 0.035, P value = 0.111.
Table 5. Multinomial logistic regression analysis of significantly stenotic coronary artery numbers
Parameters No. of coronary arteries involved OR OR_LL OR_UL P value
Male (vs. female) 1 or 2 (vs. 0)
3 (vs. 0) 1.56
3.69 0.76
1.19 3.19
11.47 0.224
0.024
NPDR (vs. no DR) 1 or 2 (vs. 0)
3 (vs. 0)
1.48 3.90
0.56 0.45
3.91 33.88
0.428 0.217
PDR (vs. NPDR) 1 or 2 (vs. 0)
3 (vs. 0) 2.01
4.26 0.88
1.45 4.59
12.51 0.094
0.008
PDR (vs. no DR) 1 or 2 (vs. 0)
3 (vs. 0) 2.98
16.63 1.03
1.91 8.65
144.71 0.044
0.011 Aspirin intake (vs. no intake) 1 or 2 (vs. 0)
3 (vs. 0)
1.49 4.53
0.72 1.35
3.07 15.26
0.279 0.015 OR, odds ratio; LL, lower limit; UL, upper limit; DR, diabetic retinopathy; NPDR, non-proliferative DR; PDR, proliferative DR.
values of our patients into five groups (ACS ≥ 400, 100 ≤ ACS <
400, 10 ≤ ACS < 100, 1 ≤ ACS < 10, or 0 ≤ ACS < 1) in accordance with a previous study (15). We then used a proportional odds model to calculate the overall odds ratio when the ACS increas- ed from the lower to higher level grouping. The odds of a coro- nary arterial involvement were significantly higher (4.7-fold) in the PDR group compared with the no DR group (P < 0.001), wher- eas these odds in the NPDR group did not differ significantly from those of the no DR group (P = 0.275). Based on these find- ings, PDR patients have not just a higher ACS but also a higher likelihood of being in a higher ACS group than patients without DR. In addition, the odds of having a 1 or 2 coronary artery in- volvement in the PDR group were found to be 3-fold greater than the no DR group (P = 0.044). Additionally, the odds of hav- ing a 3 coronary artery involvement were 17-fold higher in the PDR patients compared with the no DR cases (P = 0.011). In contrast, our NPDR patients did not show a significant increase in their odds having a 1, 2 or 3 coronary arterial involvement over the no DR group. Accordingly, our study findings indicate that patients with PDR have a higher probability of not only hav- ing CHD, but also developing more severe CHD compared with patients without DR.
We also investigated and compared the c-index, one of the predictability values in regression analysis model, between mod- els with classical CHD risk factors only and with PDR added as an additional risk factor, because we want to know whether PDR could have any additional effect to classical CHD risk factors for predicting CHD. In regression model with classical CHD risk fac- tors and PDR, PDR was also a significant and independent risk factor (P < 0.001) for predicting CHD, like results above already seen. But the c-index was not significantly increased (P = 0.111) when PDR was added to classical CHD risk factors. Our results indicate that PDR can be another independent risk factor for pre- dicting CHD compared with no DR, but PDR has no additional effect to increase the predictability of classical CHD risk factors.
With regard to aspirin intake, our current results indicated the patients in our study cohort who were taking this drug show- ed a higher risk of CHD than patients who were not. In general, many previous studies have reported that aspirin intake has a preventive effect in the case of CHD (16,17). We speculate that patients in our cohort with a higher risk of CHD might have been taking aspirin more often, which may have skewed our findings.
Silent ischemia is a serious medical problem that can poten- tially lead to death. The fact that patients with CHD in diabetes mellitus are commonly asymptomatic has been well document- ed in previous studies (9,10). In current study, 39 of our 104 as- ymptomatic patients (37.5%) had CHD, and 9 patients (8.7%) had three vessels disease. In addition, the ACS values in our as- ymptomatic patients were not found to be significantly differ- ent from those in the atypical or typical symptomatic patients.
Hence, the significance of CHD in asymptomatic patients is as
important as it is in symptomatic patients. At baseline, 104 of our patients (59.8%) were asymptomatic for CHD and no differ- ences in the symptom ratios were found among groups. Thus, we speculate that the DR status is important evidence to con- sider if recommending a screen for CHD, regardless of the pre- senting symptoms. In clinical situations, we contend that more attention needs to be paid in this regard to asymptomatic pa- tients with diabetes, particularly when they have PDR.
There have been some guidelines produced by the American Diabetes Association (ADA), the ALFEDIAM-SFC (French-speak- ing Societies for diabetes & cardiology) and CRI (Cardiac Radio- nuclide Imaging) for the screening of silent myocardial ischemia in asymptomatic patients with a normal resting electrocardio- gram in type 2 diabetes (1,18,19). In addition, Cosson et al. (20) have shown that the diagnostic value of these guidelines is im- proved by taking account of a male gender and the retinopathy status. However, the guidelines for the evaluation of CHD risk in diabetes have not been clearly defined yet. Since all patients with diabetes are recommended to have regular check-ups with ophthalmologists, we believed it would be beneficial for the pa- tients if the ophthalmologists could identify any predictors for CHD. In this regard, we speculate that the central finding of our current study of the correlation between DR grade and the se- verity of CHD could be a useful guideline in the future.
Our present report is a single-centered, retrospective, and cross-sectional study and has some limitations of note. The fun- dus photography, which we used to grade DR, is likely to have many errors, although it could be obtained and interpreted by following standardized protocols. Coronary CT angiography has become more popular to date, but only small proportion of patients with diabetes currently undergo this procedure, and it is especially rare for asymptomatic patients to do so. In addition, not all patients with diabetes are given an ophthalmologic exam.
Therefore, our patient number was small and a multi-centered prospective study with a larger cohort is needed in the future.
In summary, we find here that patients with type 2 diabetes and PDR have more severe coronary arterial calcification, and a greater likelihood of not only having CHD but being more se- vere nature than patients without DR. PDR has no additional effect to classical CHD risk factors for predicting CHD. We con- clude that PDR can be a predictor for CHD in asymptomatic patients with type 2 diabetes, and a screen for CHD in PDR pa- tients is reasonable and advisable.
DISCLOSURE
The authors have no potential conflicts of interest to disclose.
AUTHOR CONTRIBUTION
Concept and design: Um T, Lee DH, Yoon YH. Acquisition of
data: Um T. Analysis and interpretation of data: Um T, Lee DH, Kang JW, Kim EY, Yoon YH. Drafting manuscripts: Um T, Lee DH. Final approval: all authors.
ORCID
Taewoong Um http://orcid.org/0000-0001-9059-4751 Dong Hoon Lee http://orcid.org/0000-0002-7571-7749 Joon-Won Kang http://orcid.org/0000-0001-6478-0390 Eun Young Kim http://orcid.org/0000-0002-7280-8856 Young Hee Yoon http://orcid.org/0000-0002-2849-7528
REFERENCES
1. Consensus development conference on the diagnosis of coronary heart disease in people with diabetes: 10-11 February 1998, Miami, Florida. Amer- ican Diabetes Association. Diabetes Care 1998; 21: 1551-9.
2. Haffner SM, Lehto S, Rönnemaa T, Pyörälä K, Laakso M. Mortality from coronary heart disease in subjects with type 2 diabetes and in nondia- betic subjects with and without prior myocardial infarction. N Engl J Med 1998; 339: 229-34.
3. Cheung N, Wang JJ, Klein R, Couper DJ, Sharrett AR, Wong TY. Diabetic retinopathy and the risk of coronary heart disease: the Atherosclerosis Risk in Communities Study. Diabetes Care 2007; 30: 1742-6.
4. Rosenson RS, Fioretto P, Dodson PM. Does microvascular disease predict macrovascular events in type 2 diabetes? Atherosclerosis 2011; 218: 13-8.
5. Targher G, Bertolini L, Zenari L, Lippi G, Pichiri I, Zoppini G, Muggeo M, Arcaro G. Diabetic retinopathy is associated with an increased incidence of cardiovascular events in type 2 diabetic patients. Diabet Med 2008; 25:
45-50.
6. Tsujimoto T, Kajio H, Takahashi Y, Kishimoto M, Noto H, Yamamoto-Hon- da R, Kamimura M, Morooka M, Kubota K, Shimbo T, et al. Asymptomat- ic coronary heart disease in patients with type 2 diabetes with vascular complications: a cross-sectional study. BMJ Open 2011; 1: e000139.
7. Yoon KC, Mun GH, Kim SD, Kim SH, Kim CY, Park KH, Park YJ, Baek SH, Song SJ, Shin JP, et al. Prevalence of eye diseases in South Korea: data from the Korea National Health and Nutrition Examination Survey 2008-2009.
Korean J Ophthalmol 2011; 25: 421-33.
8. Kawasaki R, Cheung N, Islam FM, Klein R, Klein BE, Cotch MF, Sharrett AR, O’Leary D, Wong TY; Multi-Ethnic Study of Atherosclerosis. Is dia- betic retinopathy related to subclinical cardiovascular disease? Ophthal- mology 2011; 118: 860-5.
9. Koistinen MJ. Prevalence of asymptomatic myocardial ischaemia in dia-
betic subjects. BMJ 1990; 301: 92-5.
10. Ditchburn CJ, Hall JA, de Belder M, Davies A, Kelly W, Bilous R. Silent myo- cardial ischaemia in patients with proved coronary artery disease: a com- parison of diabetic and non-diabetic patients. Postgrad Med J 2001; 77:
395-8.
11. Wong TY, Klein R, Islam FM, Cotch MF, Folsom AR, Klein BE, Sharrett AR, Shea S. Diabetic retinopathy in a multi-ethnic cohort in the United States. Am J Ophthalmol 2006; 141: 446-55.
12. Klein R, Sharrett AR, Klein BE, Moss SE, Folsom AR, Wong TY, Brancati FL, Hubbard LD, Couper D; ARIC Group. The association of atheroscle- rosis, vascular risk factors, and retinopathy in adults with diabetes : the atherosclerosis risk in communities study. Ophthalmology 2002; 109:
1225-34.
13. Rong J, Yu CQ, Yang P, Chen J. Association of retinopathy with coronary atherosclerosis determined by coronary 64-slice multidetector comput- ed tomography angiography in type 2 diabetes. Diab Vasc Dis Res 2013;
10: 161-8.
14. Johnson TR, Nikolaou K, Wintersperger BJ, Leber AW, von Ziegler F, Rist C, Buhmann S, Knez A, Reiser MF, Becker CR. Dual-source CT cardiac imaging: initial experience. Eur Radiol 2006; 16: 1409-15.
15. Detrano R, Guerci AD, Carr JJ, Bild DE, Burke G, Folsom AR, Liu K, Shea S, Szklo M, Bluemke DA, et al. Coronary calcium as a predictor of coronary events in four racial or ethnic groups. N Engl J Med 2008; 358: 1336-45.
16. American Diabetes Association. Nutrition recommendations and princi- ples for people with diabetes mellitus. Diabetes Care 2000; 23 Suppl 1:
S43-6.
17. Final report on the aspirin component of the ongoing Physicians’ Health Study. Steering Committee of the Physicians’ Health Study Research Group.
N Engl J Med 1989; 321: 129-35.
18. Puel J, Valensi P, Vanzetto G, Lassmann-Vague V, Monin JL, Moulin P, Zic- carelli C, Mayaudon H, Ovize M, Bernard S, et al. Identification of myo- cardial ischemia in the diabetic patient. Joint ALFEDIAM and SFC rec- ommendations. Diabetes Metab 2004; 30: 3S3-18.
19. Rydén L, Standl E, Bartnik M, Van den Berghe G, Betteridge J, de Boer MJ, Cosentino F, Jönsson B, Laakso M, Malmberg K, et al. Guidelines on dia- betes, pre-diabetes, and cardiovascular diseases: executive summary.
The Task Force on Diabetes and Cardiovascular Diseases of the Europe- an Society of Cardiology (ESC) and of the European Association for the Study of Diabetes (EASD). Eur Heart J 2007; 28: 88-136.
20. Cosson E, Nguyen MT, Chanu B, Balta S, Takbou K, Valensi P. The report of male gender and retinopathy status improves the current consensus guidelines for the screening of myocardial ischemia in asymptomatic type 2 diabetic patients. Nutr Metab Cardiovasc Dis 2013; 23: 557-65.