Effects of different parities on productive performance of lactating sows
Minho Song
1, Do-Myung Kim
2, Kyu-Myung Choi
2, Seongwon Seo
3*
1
Department of Animal Science and Biotechnology,Chungnam National University, Daejeon 305-764, Korea
2
Gendocs, Inc., Daejeon 305-764, Korea
3
Department of Animal Biosystem Sciences, Chungnam National University, Daejeon 305-764, Korea
산차가 비유모돈의 생산성에 미치는 영향
송민호
1ㆍ김도명
2ㆍ최규명
2ㆍ서성원
3*
1충남대학교 동물자원생명과학과, 2(주)젠닥스, 3충남대학교 동물바이오시스템과학과
Received on 19 September 2012, revised on 21 September 2012, accepted on 22 September 2012
Abstract : Fast recovery of feed intake and milk production are very important in the management of lactating sows because they are directly related to sow and litter performance. It is also known that parity is one of factors affecting feed intake and milk yield during lactation. Therefore, the objective of this study was to evaluate effects of different parities on productive performance of lactating sows fed diets containing different levels of DDGS. A total of 245 sows were divided into 3 parity groups of 1 to 2, 3 to 5, and over 5 parities. Within each parity group, sows were allottedto 1 of 4 dietary treatments that were prepared by inclusion of 0, 10, 20, and 30% DDGS in lactation diets. Diets were fed to sows during lactation.Sows with parities 1-2 had lower (p < 0.05) initial sow body weight, sow feed intake, sow weight change, and sow backfat change during lactation than sows with parities 3-5 as well as parities over 5. However, sows with parities over 5 had lower (p < 0.05) litter size at weaning, litter birth weight, litter weaning weight, and piglet average daily gain and higher pre-weaning mortality than sows with parities 1-2 as well as parities 3-5. In conclusion, parity influences productive performance of lactating sows.
Key words : Lactating sow, Parity, Performance
*Corresponding author: Tel: +82-42-821-5787 E-mail address: [email protected]
I. Introduction
Recently, biofuel production has markedly increased and contributed to increase in price of corn and pro- duction of corn co-products (e.g. distillers grains with solubles (DDGS)).This change has led changes in increasing amounts of DDGS in swine diets as a partial replace- ment of common feed ingredients such as corn and soybean meal (Hoffman and Baker, 2011).
Stein and Shurson (2009) suggested that addition of up to 50% DDGS to gestation dietsand that of up
to 30% DDGS to lactation dietshave no negative effects on productive performance of sows based on the previous studies (Wilson et al., 2003; Greiner et al., 2008; Hill et al., 2008). However, the DDGS effect may be different among various parities of sows because it is known sow parity influence feed intake, energy and nutrient utilization, and productive performance (Koketsu et al., 1996; Etienne et al., 1998; Noblet et al., 1998; Eissen et al., 2000).
The objective of this experiment, therefore, was to
evaluate the effect of different parities on productive
performance of lactating sows fed diets containing
different levels of DDGS.
Table 1. Ingredient and nutrient composition of dietary treatments (as-fed basis).
Item Treatments
1CON DDGS10 DDGS20 DDGS30
Ingredient (g/kg)
Corn 662.0 622.9 587.8 549.5
Soybean meal, 47.5% 274.0 218.0 159.0 103.0
Distillers dried grains with solubles 0.0 100.0 200.0 300.0
Choice white grease 25.0 19.2 12.5 6.2
Dicalcium phosphate 23.8 21.4 18.7 15.9
Limestone 4.7 6.5 8.3 10.1
Salt 3.5 3.5 3.5 3.5
Sow Vit-Min premix
25.0 5.0 5.0 5.0
Biotin premix
32.0 2.0 2.0 2.0
L-Lysine HCl 0.0 1.5 3.2 4.8
Analyzed energy and nutrients
Gross energy (MJ/kg) 16.5 16.8 17.1 17.5
Metabolizable energy (MJ/kg)
414.2 14.2 14.2 14.2
Crude protein (g/kg) 180.4 182.6 177.0 175.7
Acid detergent fiber (g/kg) 87.6 107.6 117.9 145.6
Neutral detergent fiber (g/kg) 50.2 62.2 70.2 81.7
Calcium (g/kg) 9.2 9.8 9.7 9.3
Phosphorus (g/kg) 8.0 8.1 7.7 7.2
Total lysine (g/kg) 10.4 10.6 10.7 10.9
1
CON = control diet; DDGS10 = CON + 10% DDGS; DDGS20 = CON + 20% DDGS; DDGS30 = CON + 30% DDGS.
2
Premix supplied the following per kg of diet: Zn, 90.31 mg; Mn, 18.01 mg; Fe, 53.96 mg; Cu, 5.40 mg; Se, 0.30 mg; I, 2.20 mg; niacin, 55.07 mg; pantothenic acid, 33.04 mg; vitamin A, 11,013 IU; vitamin D, 2,753 IU; vitamin E, 55 IU; riboflavin, 9.9 mg; vitamin K, 4.41 mg; vitamin B12, 0.06 mg; choline, 495 mg; pyridoxine, 1.65 mg; folic acid, 1.65 mg; thiamine, 1.01 mg.
3
The premix supplied 0.51 mg of biotin per kg of diet.
4
Calculated value.
II. Materials and Methods
1. Animals, Housing, and Experimental Design
The experimental protocol was reviewed and approved by the Institutional Animal Care and Use Committee at the University of Minnesota. A total of 245 lactating sows (English Belle, GAP genetics, Winnipeg, MB, Canada) with different parities of 1 to 2 ( n = 62), 3 to 5 ( n = 102), and over 5 ( n = 81) were used in this experiment.
There were 6 farrowing groups. On d109 of gestation, sows were moved to farrowing stalls equipped with a feeder and waterer in farrowing rooms automatically
ventilated and maintained at 20°C. Feed and water were
available at all times. Dietary treatments were
corn-soybean meal-based diet (CON), CON + 10% DDGS
(DDGS10), CON + 20% DDGS (DDGS20), and CON +
30% DDGS (DDGS30). All diets were formulated to
meet or exceed National Research Council (1998)
estimate of nutrient requirements. The concentrations of
crude protein, metabolizable energy, and standardized
ileal digestible lysine were similar across 4 diets (Table
1). Sows were fed a common corn-soybean meal-based
gestation diet until d109 of gestation. When sows were
moved to farrowing rooms, they wererandomly assigned
to dietary treatments and fed 2.5 kg of diets from d109
of gestation until farrowing. After farrowing, sows were
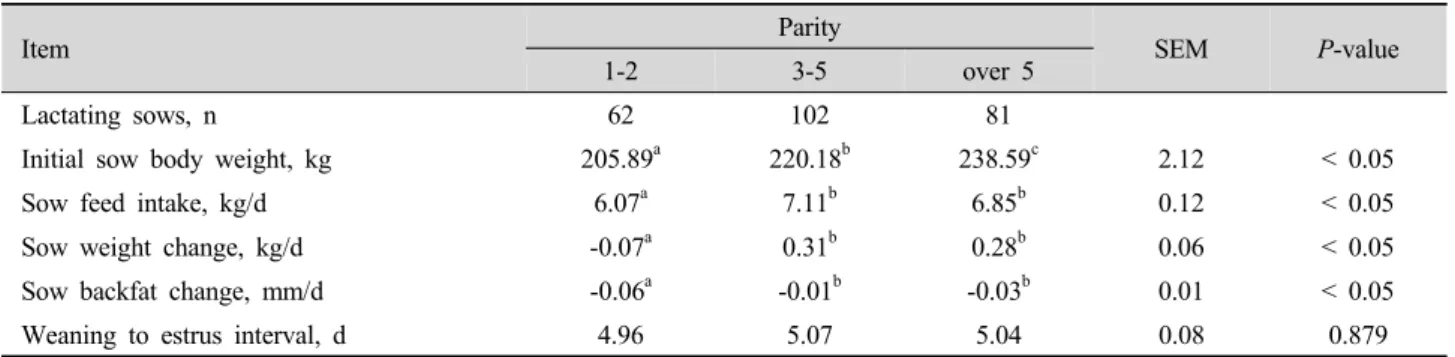
Table 2. Effects of different parities on sow performance of lactating sows.
Item Parity
SEM P-value
1-2 3-5 over 5
Lactating sows, n 62 102 81
Initial sow body weight, kg 205.89
a220.18
b238.59
c2.12 < 0.05
Sow feed intake, kg/d 6.07
a7.11
b6.85
b0.12 < 0.05
Sow weight change, kg/d -0.07
a0.31
b0.28
b0.06 < 0.05
Sow backfat change, mm/d -0.06
a-0.01
b-0.03
b0.01 < 0.05
Weaning to estrus interval, d 4.96 5.07 5.04 0.08 0.879
a-c
Means within a row with different letters are different at p<0.05.
provideddietary treatmentstwice daily as close to adlibitum intake until weaning.
2. Measurements and Data Collection
The amount of feed provided per sow was recorded daily and feed refusals were weighed and recorded at weaning.Piglets were weaned at 18.2 ± 1.2 d of age.
Body weight and ultrasonic backfat depth at the P2 position of sows as well as their litter weight were measured within 24 h after farrowing and at weaning.
Piglets were cross-fostered among sows within each dietary treatment group within 24 h after farrowing to adjust litter size to approximately 10 piglets per sow. Other productive performances were also measured:
litter size, number of dead piglets, interval between weaning to estrus.Diet samples were collected from each batch of manufactured feed and analyzed for gross energy that was measured by bomb calorimetry (Parr 1281 bomb calorimeter, Parr instrument Co., Moline, IL), crude protein (method 934.13; AOAC 2006), acid detergent fiber (method 973.18; AOAC 2006), neutral detergent fiber (Holst, 1973), calcium and phosphorus (method 958.01; AOAC 2006), and total lysine (method 982.30 E; AOAC 2006).
3. Statistical Analysis
Data were analyzed using the ProcGLM procedure (SAS Inst. Inc, Cary, NC) in a completely randomized
design. The experimental unit was the sow or litter.
The statistical model included effect of parity as a fixed effect and dietary treatment as a covariate.
Pair-wise comparisons were also performed when the effect of parityshowed significance or tendency. Statistical significance and tendency were considered at p<0.05 and 0.05≤p<0.10, respectively.
III. Results and Discussion
In short, Song et al. (2010) reported dietary effects of DDGS on performance and milk composition of lactating sows. This study indicated that addition up to 30% DDGS in lactating sow diets had no negative effect on sow and litter performance, energy and N digestibility, and milk composition. Based on the materials and methods as well as data from Song et al. (2010), the present study evaluated effects of different parities on productive performance of lactating sows fed diets containing different levels of DDGS by different statistical analysis.
Sows with parities 1-2 had lower (p<0.05) initial sow body weight, sow feed intake, sow weight change, and sow backfat change during lactation than sows with parities 3-5 as well as parities over 5 (Table 2). These results are in agreement with results from previous studies (O’Grady et al., 1985; Esbenshade et al., 1986;
Koketsu et al., 1996). In the management of lactating
sows, feed intake is very important because of the
provision of energy for milk production and
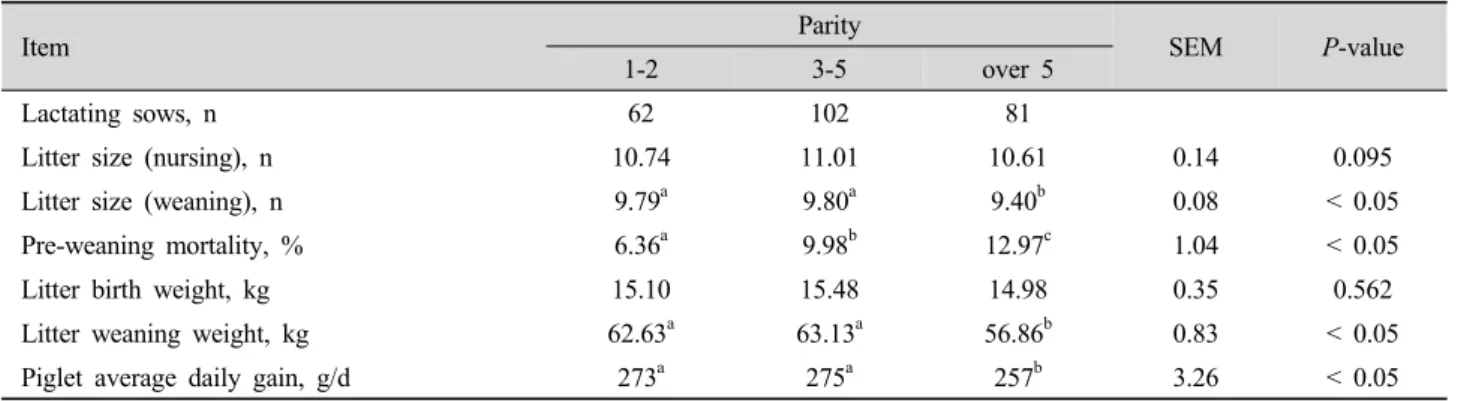
Table 3. Effects of different parities on litter performance of lactating sows.
Item Parity
SEM P-value
1-2 3-5 over 5
Lactating sows, n 62 102 81
Litter size (nursing), n 10.74 11.01 10.61 0.14 0.095
Litter size (weaning), n 9.79
a9.80
a9.40
b0.08 < 0.05
Pre-weaning mortality, % 6.36
a9.98
b12.97
c1.04 < 0.05
Litter birth weight, kg 15.10 15.48 14.98 0.35 0.562
Litter weaning weight, kg 62.63
a63.13
a56.86
b0.83 < 0.05
Piglet average daily gain, g/d 273
a275
a257
b3.26 < 0.05
a-c