DOI:http://dx.doi.org/10.5389/KSAE.2014.56.4.041
Measurement and Comparison of Overall Heat Transfer Coefficients for Greenhouse Covering Materials with Thermal Screens
온실용 피복재 및 보온재의 관류열전달계수 측정 및 비교
Diop, Souleymane*
․Lee, Jong Won
*․Lee, Hyun Woo
*,†소레이멘 디옵․이종원․이현우
ABSTRACT
천공복사를 구현할 수 있는 관류열전달계수 측정용 실내실험장치를 제작하고 국내에서 사용되고 있는 온실 피복재 및 보온재의 관류 열전달계수를 측정하여 실외실험에서 측정된 결과와 비교하여 타당성을 평가하였다. 외부피복은 0.1 mm 두께의 폴리에틸렌 필름을 사 용하여 일중 및 이중피복으로 처리하였다. 이중외부피복조건의 경우 4가지 종류의 보온재를 처리하여 총 6가지 피복처리에 대하여 실 험을 실시하였다. 모든 피복처리조건에 대하여 야간복사 유무에 따른 관류열전달계수 측정실험이 수행되었다. 천공복사의 유무에 따라 온실피복재의 관류열전달계수의 변화 경향이 크게 차이가 있었기 때문에 실내실험을 통해 관류열전달계수를 측정하기 위해서는 반드시 실제의 천공복사를 구현할 수 있는 실험장치가 필요할 것으로 판단된다. 실내 실험결과와 실외 실험결과가 비교적 잘 일치하였으며 실 내실험장치를 이용하여 관류열전달계수를 측정하는 것이 타당성이 있음을 확인할 수 있었다. 천공복사 유무에 따른 관류열전달계수의 차이는 핫박스 내외부의 온도차이가 증가함에 따라 감소하는 것으로 나타났다.
Keywords: Hot box; indoor experiment; night sky radiation; outdoor experiment; polyethylene film; shelter
I. INTRODUCTION*
In 2012, single-span greenhouses account for 87.7 % with the area of 42,009 ha while multi-span greenhouses account for 12.3 % with the area of 5,915 ha among horticultural facilities of 47,924 ha in Korea. Single-span greenhouses use multilayer coverings (34.2 %), blanket (25.8 %), water curtain facilities (13.4 %) and multilayer screens (11.1 %) as heat insulations, while multi-span greenhouses use non-woven fabric curtains (44.1 %), multilayer screens (33.1 %) and aluminum screens (7.1 %). Most of greenhouses are equipped with heat insulation facilities to lower heat loss and with 18,876 ha, the facility areas to be heated account for 35.2 % of the total facility area (MIFAFF, 2013). Solutions to reduce heating costs are seriously required since heating costs are significantly
* Department of Agricultural Engineering, Kyungpook National University
† Corresponding author Tel.: +82-53-950-5736 Fax: +82-53-950-6752
E-mail: [email protected] 2014년 6월 2일 투고 2014년 7월 15일 심사완료 2014년 7월 17일 게재확정
high, accounting for 30∼40 % of the total production costs of controlled horticulture, and all of heating oil rely on imported ones and it is a great disadvantage to Korea's vegetables international competitive edge in terms of exporting vegetables (RDA, 2008).
To optimize heating apparatus and heating operation of the greenhouse and evaluate the compliance of heating status, it is necessary to make an appropriate assessment on heating load and heating costs (Bailey and Chalabi, 1994;
Baille et al., 2006). Even though the amount of heat loss of the greenhouse, which may cause heating load, is calculated by adding the amount of overall heat loss through covering materials, the amount of heat loss before ventilation resulted from gaps on the greenhouse surface and the amount of heat loss before underground by heat exchange between indoor air and soil, the amount of overall heat loss is dominative among them, accounting for 60 through 100 % of the total amount of heat loss so that it is the most decisive element for calculating the amount of heating load (JGHA, 1994; Kim et al., 2000). The amount of overall heat loss is generally calculated by multiplying the overall heat transfer coefficient
by the difference in temperature between inside the greenhouse and outside of it, and the overall heat transfer coefficient depends on climate conditions such as external temperature, wind velocity and sky conditions, surface conditions of covering materials, convective heat transfer method of inside and outside surface of covering materials, the amount of long wave radiant heat exchange, the amount of ventilation gap, covering area, greenhouse type, greenhouse floor space and whether there is any thermal screen or not in the greenhouse, and this value consists of terms of heat conduction coefficient, convective heat transfer coefficient of inside and outside of covering materials and long wave radiant heat transfer coefficient (Papadakis et al., 2000). Since the overall heat transfer coefficient varies depending on various greenhouse conditions and environmental conditions, it is inevitable that different values are presented by researchers even for the same kind of covering materials (Abdel-Ghany and Kozai, 2006; Papadakis et al., 2000; Seginer et al., 1988; Njijskens et al., 1984; JGHA, 1994; Minagawa and Tachibana, 1982) It is reasonable to measure directly the overall heat transfer coefficient of covering materials under natural indoor and outdoor conditions (Papadakis et al., 2000).
Feuilloley and Inssanchou (1996) conducted an outdoor experiment to measure the overall heat transfer coefficient of one layer of covering materials in accordance with whether there is condensation or not by using two identical hotboxes.
Max et al. (2012) developed a hotbox that enable researchers to measure optical and physical properties of greenhouse covering materials and measured the overall heat transfer coefficient according to the combination of glass and film.
Diop et al. (2012) investigated the U values of greenhouse covering materials with thermal screens commonly used in Korea under ambient outdoor climatic conditions. However, because the measurement results of the outdoor experiment present only the overall heat transfer coefficient for the air environmental conditions during the measurement, it is necessary to mark values to be measured under the environmental conditions where the overall heat transfer coefficient is standardized in order to compare the overall heat transfer coefficient of various greenhouse coverings each other (Feuilloley and Inssanchou, 1996). Therefore, to measure the overall heat transfer coefficient under the standardized
environmental conditions, a measuring system is needed to keep external temperature, internal temperature, sky temperature and wind velocity constant.
Regarding to this matter, Geoola et al. (2009) developed an indoor measuring system to ensure that the overall heat transfer coefficient is measured according to the combination of greenhouse coverings and thermal screens, and measured the overall heat transfer coefficient in accordance with the combination of covering materials and thermal screens, difference in temperature between indoor and outdoor, condensation status and wind velocity. At this time, outdoor temperature was maintained at -1˚C and sky temperature was kept at 0˚C by using ice boxes.
However, since the actual sky temperature is significantly lower than ambient temperature on clear days (Duffie and Beckman, 1981; Ursula & Antoine, 2011), it is necessary to use an indoor experimental apparatus that enable the researcher to implement the actual sky temperature in order to obtain a more accurate overall heat transfer coefficient of covering materials and thermal screens, and it is difficult to find indoor experimental results regarding to this. Therefore, it is required to develop a measuring device to measure the overall heat transfer coefficient of greenhouse coverings and thermal screens, which is equipped with the implementation unit of sky temperature to ensure that the actual sky temperature is implemented.
Especially, since there is no standardized measuring system and measuring criteria for the overall heat transfer coefficient until now in Korea, any unified quantitative reference does not exist to compare the overall heat transfer's properties for covering materials and thermal screens recently developed and commercialized. Therefore, it is needed to develop a measuring system, measuring method and reference for the overall heat transfer coefficient of the standardized covering materials and thermal screens suitable to the domestic environment.
This study is conducted by producing an indoor experimental apparatus for measuring the overall heat transfer coefficient with which the actual sky temperature can be implemented and measuring greenhouse coverings and thermal screens available in Korea to compare the results with the measured results in the outdoor experiment and to assess their appropriateness.
II. MATERIALS AND METHODS
1. Experimental apparatus
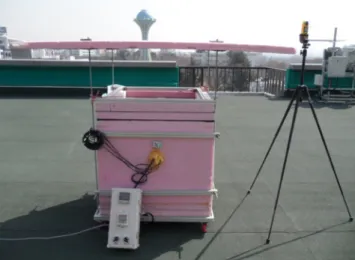
An isothermal hot box system and a cold chamber were constructed to create actual greenhouse conditions for measuring the U values of greenhouse coverings and thermal screens available in Korea. The outdoor experiment employed a hot box without shelter (Fig. 1a) and with shelter (Fig. 1b) from ambient night sky radiation to minimize the effects of night sky temperature (Diop et al., 2012; Lee et al., 2014).
Fig. 2 shows picture of the hotbox with shelter for the
(a) Without shelter
(b) With shelter
Fig. 1 Schematic diagram of the hot box for the outdoor experiment (unit: mm)
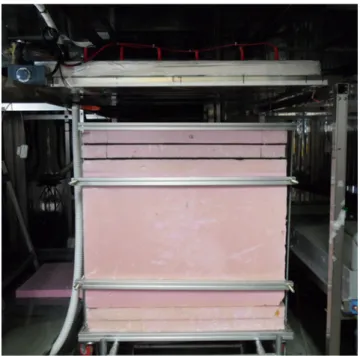
outdoor experiment. In the laboratory experiment, the hot box was installed in a cold chamber equipped with a night sky radiation simulator implementation unit (Fig. 3) (Lee et al., 2013). Fig. 4 shows picture of the hotbox in the cold chamber for the laboratory experiment. The dimensions of the hot box were 60×60×60 cm and a heating device (500 W capacity) was installed at the bottom of the box.
The temperature of the heating device was controlled by an on–off switch. The walls of the box consisted of 10 cmthick polystyrene foam for insulation. To assess the U values of the combined covering materials and thermal screens, four layers of 5-cm-thick polystyrene foam were installed on the top of the hot box at 5 cm intervals for attaching the test materials. The supplied heating energy was measured at 1 second intervals using a Power Manager wattmeter
Fig. 2 Picture of the hotbox with shelter for the outdoor experiment
Fig. 3 Schematic diagram of the hot box in the cold chamber for the laboratory experiment (unit: mm)
Fig. 4 Picture of the hotbox in the cold chamber for the laboratory experiment
(STC, Korea) and the measured values were saved on a PC (Diop et al., 2012). The thermal conductivity of the hot box walls was measured with a KD2 Pro sensor (Decagon Devices, USA) and was determined to be 0.0415 W·m·K-1. In the outdoor experiment, a shelter (5 cm thick polystyrene foam, 190×180 cm) was installed 50 cm above the top surface of the hot box to measure U values while minimizing exposure of samples to thermal radiation from the sky. The cold chamber used for the indoor experiment was 360×240×195 cm, and consisted of 20 cm thick polystyrene foam. A cooler was installed inside the cold chamber for automatic temperature control to -2˚C. A stainless steel unit (100×
100×7 cm) covered with aluminum foil was placed 20 cm above the surface of the hot box covering materials to simulate night sky radiation and assess radiative heat loss. U values were measured in the presence and absence of simulated night sky radiation. Copper pipe (Φ 15.8×0.9 mm) was placed in the unit and R22 coolant was injected into the pipe. The surface of the implementation unit could be cooled to -30˚C. This temperature was confirmed prior to beginning the experiment by testing with an IR02 pyrgeometer (Hukseflux, The Netherlands) equipped with a 21X-L data logger (Campbell, USA). According to Na et al. (2013), the difference between outside air temperature and sky
temperature is 18.7˚C at average at nights of clear days in Daegu. Therefore, the difference between air temperature and sky temperature is set to 20˚C for the indoor measurement experiment to compare with the results of the outside experiment measured in Daegu, and for this, the temperature in the cold chamber is kept at 0˚C and the sky temperature of the surface of the covering materials installed in the hotbox is maintained at about –20˚C.
2. Data acquisition
Outdoor experiments were conducted at night when the system was close to a steady state and the external climatic conditions were stable (usually between 01:00 and 05:00 hours) (Feuilloley and Issanchou, 1996). For indoor experiments, temperature and supplied energy were measured for 2 hours after a 12 hours(to stabilize the heat stream after initiating heat supply); the 2 hours measurements were repeated 1 hour after the inside temperature of the hot box increased (Geoola et al., 2009). Fig. 5 shows the location of surface and air temperature sensors. Heat loss through the hot box walls was calculated by measuring the inner and outer surface temperature of three walls using a UE-1530 sensor (USEEM, Korea) equipped with a ZFRM data logger (USEEM, Korea).
External wind speed was measured every 10 min, outside
Fig. 5 Location of surface and air temperature sensors
and inside the indoor cold chamber, with a Kestrel 4500 wind gauge (Nielsen-Kellerman, USA). A fan capable of producing wind speeds from 0 to 4.5 m·s-1 was used to investigate how wind affected U values. Temperatures at various locations inside and outside the hot box were measured using six HOBO temperature sensors (Onset, USA), and average values were calculated. Two additional temperature sensors were installed outside the hot box and their values were averaged to increase the accuracy of the measurements. The temperature at each compartment of the experiment was set via a connection to an on–off controller. Experiments were carried out from November 2011 to April 2013.
3. Calculation of overall heat transfer coefficients
If an experimental apparatus is insulated and heat transfer through the covering materials and thermal screens is stable, the heat stream will conform to the theoretical heat balance and the overall heat transfer coefficients of covering materials can be calculated using Eq. (1) (Geoola et al., 2009):
U ATi To
q (1)
where U is the overall heat transfer coefficient (W·m-2·K-1), q is the energy (W) required to heat the inside of the hot box, A is the area (m2) of the covering surface, Ti is the air temperature (˚C) below the thermal screen, and To is the air temperature (˚C) above the covering material.
Because the hot box is not a perfect insulator, heat loss through covering materials and walls is calculated using Eq. (2), which neglects heat loss by gap ventilation:
q qr qw (2)
where qr is the energy (W) supplied by the heating device and qw is the energy (W) lost through walls. Overall heat transfer through the actual covering materials can be calculated using Eq. (3):
U aTi To qr qw
(3) The amount of heat loss through the walls can be calculated
using Eq. (4):
qw Lw
SwTp Tx
(4)
where Sw is the surface area (m2) of the hot box walls and floor, λ is the thermal conductivity (W·m-2·K-1) of the insulation materials, Tp is the inside surface temperature (˚C) of walls, Tx is the outside surface temperature (˚C) of walls, and Lw is the wall thickness (m).
4. Experimental procedures
Table 1 lists the test conditions for 10 treatments that consisted of combined covering materials and thermal screens with and without shelter from night sky radiation. These tests were used to determine U values for outdoor experiments.
The covering material consisted of 0.1mmthick PE film applied in one layer (1L) or two layers (2L). Three kinds of thermal screen installation were applied: (1) one layer of multi-layer screen; (2) two layers of white polyester;
and (3) two layers of multi-layer screen. All tests were performed with and without shelter from night sky radiation. The temperature established inside the hot box was 15˚C. All temperatures and electricity (heater) inputs were recorded after a steady state was reached for each test. Each treatment was repeated more than five times. U values for each group were calculated using Eq. (3).
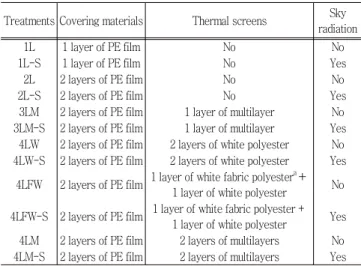
Table 2 lists the test materials and treatment conditions used to determine U values in indoor experiments. Experiments were conducted using 12 treatment conditions consisting of various combinations of covering materials and thermal screens and the presence or absence of simulated night sky radiation. One-or two-layer coverings were created with 0.1-mm-thick PE film. Four combinations of thermal screens were tested in the two-layer covering treatments:
(1) one layer of multilayer screen; (2) two layers of white polyester; (3) one layer of white fabric polyester and one layer of white polyester; and (4) two layers of multilayer screen. Experiments were conducted to determine U values for each of the four treatments with and without simulated night sky radiation. The temperature in the hot box was set to 10˚C, 20˚C, 30˚C, 40˚C, and 50˚C. Experiments were replicated more than three times for each treatment
Table 1 Test matrix of covering materials with thermal screens and shelter.
Treatment Covering material Thermal screen Shelter
1L-N 1 layer of PE film None None
1L-I 1 layer of PE film None Installed
2L-N 2 layers of PE film None None
2L-I 2 layers of PE film None Installed
3LM-Na 2 layers of PE film 1 layers of multilayers None 3LM-Ia 2 layers of PE film 1 layers of multilayers Installed 4LW-N 2 layers of PE film 2 layers of white polyesterb None
4LW-I 2 layers of PE film 2 layers of white polyester Installed 4LM-N 2 layers of PE film 2 layers of multilayersc None
4LM-I 2 layers of PE film 2 layers of multilayers Installed
a Only measured at low wind speed
b Apparent density 890.1 kg·m-2, thickness 0.4 mm, referred to as oxford 300×600 in the market (Kim et al., 2009)
c White polyester (thickness 0.4 mm) + polyethylene foam (thickness 1 mm) + white fabric polyester (thickness 0.25 mm, weight 40 g·m-2) + polyethylene foam (thickness 1 mm) + white polyester (thickness 0.4 mm).
Table 2 Test matrix of covering materials with thermal screens and simulated night sky radiation.
Treatments Covering materials Thermal screens Sky radiation
1L 1 layer of PE film No No
1L-S 1 layer of PE film No Yes
2L 2 layers of PE film No No
2L-S 2 layers of PE film No Yes
3LM 2 layers of PE film 1 layer of multilayer No 3LM-S 2 layers of PE film 1 layer of multilayer Yes 4LW 2 layers of PE film 2 layers of white polyester No 4LW-S 2 layers of PE film 2 layers of white polyester Yes
4LFW 2 layers of PE film 1 layer of white fabric polyestera+ 1 layer of white polyester No 4LFW-S 2 layers of PE film 1 layer of white fabric polyester +
1 layer of white polyester Yes 4LM 2 layers of PE film 2 layers of multilayers No 4LM-S 2 layers of PE film 2 layers of multilayers Yes
a Thickness 1.5 mm, weight 200 g·m-2
condition. U values were calculated using Eq. (3) and the average values were obtained.
III. RESULTS AND DISCUSSION
1. Variability in U values in outdoor experiments on clear days
U values varied with wind speed among the different test conditions (Fig. 6). High-wind conditions consisted of wind speeds >2 m·s-1 and low-wind conditions consisted of wind speeds <2 m·s-1. U values measured at high
Fig. 6 Overall heat transfer coefficients (U values) under different test conditions and wind speeds
wind speeds were greater than those measured at low wind speeds for all treatments. Coefficients measured at high wind speeds were greater by about 16% for 1L, by 19% for 2L, by 23% for two layers of covering material coupled with one layer of white polyester screen (3LM), and by 26% for two layers of covering material coupled with two layers of multi-layer screen (4LM), compared with those measured at low wind speeds. Although U values could not be directly compared because of differences in wind speed, wind-induced heat loss from covering materials without thermal screens was greater than that from covering materials coupled with thermal screens.
2. Variability in U values in indoor experiments
Fig. 7(a) presents the experimental results without simulated night sky radiation and Fig. 7(b) presents the results with simulated night sky radiation. All U values had a standard deviation of <0.2 W·m-2·K and increased nearly linearly with increasing temperature difference in the absence of simulated night sky radiation. This trend is consistent with a previous report (Geoola et al., 2009). The 1L covering exhibited the greatest rate of increase in U value with increasing temperature difference. When night sky radiation was simulated, U values were highest when the difference in temperature inside and outside the hot box was 10˚C.
(a) Without simulated night sky radiation
(b) With simulated night sky radiation
Fig. 7 Changes in overall heat transfer coefficients (U values) of each treatment according to the temperature difference between the inside and outside of the hot box
U values decreased significantly as the temperature difference approached 20˚C. No significant changes were observed in U values as the temperature difference exceeded 20˚C.
Changes in U values differed significantly from results obtained in the absence of simulated night sky radiation and were similar to those observed in previous outdoor experiments (Minagawa and Tachibana, 1982; Diop, 2013).
Therefore, accurate measurement of U values in a laboratory setting requires establishing a system that simulates night sky radiation.
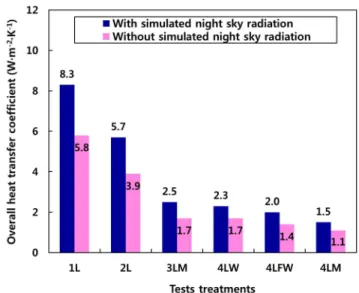
Fig. 8 presents U values for the six different treatments.
The temperature difference between the inside and outside of the hot box was about 20˚C during the experiment.
Fig. 8 Overall heat transfer coefficients (U values) for the six different treatments
The U value of the 1L cover was highest among all treatments, followed (in decreasing order) by the 2 L, 3 LM, 4 LM, and 4 LFW (the combination of one layer of non-woven fabric and one layer of polyester) treatments. In the presence of simulated night sky radiation, the U value of the 2 L treatment was about 31 % lower than that of the 1 L treatment, in agreement with a 32 % difference reported previously (Garzoli and Blackwell, 1987); the U values of the 3 LM and 4 LW treatments were about 70~72
% lower, that of the 4 LFW treatment was about 76 % lower, and the 4LM U value was about 82% lower compared with the 1L treatment. Average U values in the presence of simulated night sky radiation were 27~30%
greater than those without simulated radiation.
3. Amount of heat loss
Fig. 9 illustrates the difference in the overall heat transfer coefficient according to the temperature difference between inside and outside of the hotbox when sky radiation is implemented or when it is not implemented for each covering treatments in order to analyze changes in the amount of heat loss due to each sky radiation. It shows that the difference in the overall heat transfer coefficient according to whether sky radiation is implemented or not is higher for covering treatments whose overall heat transfer coefficient is higher while the difference in the overall heat transfer coefficient
Fig. 9 Differences in U values for different test treatments according to the temperature difference inside and outside the hot box when sky radiation is implemented or when it is not implemented for each covering treatments
is lower as the temperature difference between inside and outside of the hotbox is getting higher.
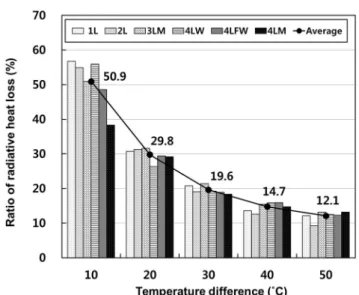
To analyze changes in the ratio of heat loss due to sky radiation, the ratio of heat loss is calculated by dividing the difference between the overall heat transfer coefficient when sky radiation is implemented and that when sky radiation is not implemented by the overall heat transfer coefficient when sky radiation is implemented, and Fig. 10 shows the ratio of heat loss according to the temperature difference between inside and outside of the hotbox for each covering treatments. There is any significant difference in the ratio of heat loss according to covering treatment conditions however it is found that the ratio of heat loss deceases as the temperature difference between inside and outside of the hotbox increases. This is in accord with the results of Kittas (1994) and the reason of it is considered that the ratio of radiant heat loss decreases relatively due to the increase in the total heat loss caused by the increase in convective heat loss even though there is no significant difference in radiant heat loss according to the increase of the temperature difference between inside and outside of the hotbox for the same covering treatments.
For the ratio of heat loss due to sky radiation, significantly lower values are obtained than those for the ratio of
Fig. 10 Variation in ratio of radiative heat loss for different test treatments according to the temperature difference between the inside and outside of the hotbox
radiant heat loss presented in existing studies. It shows that because even the results of the experiment in which sky radiation is not implemented contain the amount of radiant heat loss, the difference between the amount of heat loss when sky radiation is implemented and the amount of heat loss when sky radiation is not implemented does not mean all of the amount of radiant heat loss taken place by the implementation of sky radiation.
4. Variability in U values depending on wind speed
Fig. 11 indicates the variation of the overall heat transfer coefficient depending on the wind speed. Many researchers show the relationship of the overall heat transfer coefficient and the wind speed as a linear relationship (Hanan, 1998).
The results are analyzed by inducing the linear formula in this study. The variation of U values according to the temperature difference between the inside and outside of the hot box increases as the wind speed increases. Table 3 mentions the linear regression equations of the overall heat transfer coefficients according to the wind speed for each temperature difference between the inside and outside of the hot box. The increasing rate of the U value depending on the wind speed increases as the temperature difference between the inside and outside of the hot box increases.
Table 4 Comparison of U values between indoor and outdoor experiments Treatments
Indoor experiment Outdoor experiment
U value (W·m-2·K-1)
Temp.
difference (˚C)
Wind speed (m·s-1)
U value (W·m-2·K-1)
Temp.
difference (˚C)
Wind speed (m·s-1)
Without sky radiation
1L 5.8 19.6
0.4
5.9 18.2 0.1
2L 3.9 21.2 4.1 13.4 0.5
3LM 1.7 20.6 1.7 19.7 0.1
4LW 1.7 20.9 1.6 20.2 0.4
4LM 1.1 20.8 1.0 21.8 0.8
With sky radiation
1L 8.3 17.9
0.4
8.4 21.5 0.8
2L 5.7 19.7 5.9 15.6 0.3
3LM 2.5 20.1 2.6 17.9 0.6
4LW 2.3 20.3 2.3 26.6 0.6
4LM 1.5 20.6 1.4 24.9 0.5
Fig. 11 Relationship between the overall heat transfer coefficient and the wind speed for one layer plastic film
Table 3 Overall heat transfer equations according to the wind speed for one layer plastic film
Temperature difference (˚C) Equations R2
20 U = 0.1511Ws + 8.2626 0.9807
30 U = 0.3627Ws + 7.6624 0.9661
40 U = 0.4453Ws + 7.6983 0.9825
50 U = 0.5112Ws + 7.7141 0.9938
U = Overall heat transfer coefficient Ws = Wind speed
The results show a slope of 0.15 for 20˚C, 0.36 for 30˚C, 0.44 for 40˚C and 0.51 for 50˚C temperature difference respectively. We know that the slopes the of overall heat transfer coefficient depending on the wind speed are different.
Albright et al. (1985) suggests 0.5 for all kinds of coverings, Seginer et al. (1988) suggest 0.5 for single layer polyethylene covering greenhouse and 0.1 for double layers polyethylene
covering greenhouse. The present study results for the temperature difference 50˚C are similar to the result of Albright et al. (1985) but slightly different for temperature different lower than 50˚C. The coefficients of determination R2 as shown in Table 3 give the greatest indication of the strength of the relationship of the results.
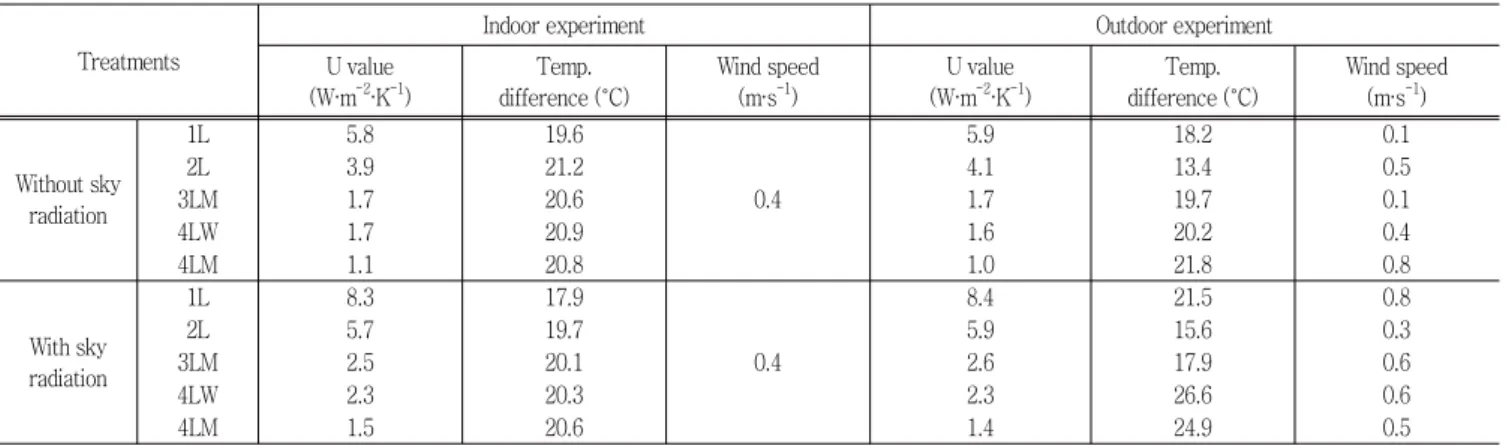
5. Comparison of U values between indoor and outdoor experiments
Table 4 presents measured U values for the indoor and outdoor experiments according to covering treatment and presence or absence of simulated night sky radiation. The average temperature difference between the inside and outside of the hot box in outdoor experiments was 20˚C and the average wind speed was 0.4 m·s-1, similar to the conditions created for the indoor experiment. U values in the absence of night sky radiation under outdoor climatic conditions were 2 % higher than those measured in the indoor experiment for 1 L, 5 % higher for 2 L, equal for 3 LM, 6 % lower for 4 LW, and 9 % lower for 4 LM. Thus, the differences in U values between the indoor and outdoor experiments were relatively small when night sky radiation was not a factor.
U values were also similar under simulated night sky radiation:
under outdoor conditions the coefficient was 1 %, 3 %, and 4 % higher than that measured in the indoor experiment for the 1 L, 2 L, and 3 LM treatments, respectively; values were equal for 4 LW and 7 % lower for 4 LM. Because the differences between the experiments were small, the experimental device used in this study can be considered reliable for measuring U values, and overall heat transfer coefficients
can be obtained in a laboratory setting using a night sky radiation simulator. These results demonstrate the feasibility of measuring the U values of greenhouse covering materials and thermal screens with indoor experiments.
IV. CONCLUSIONS
In this research, U values of greenhouse covering materials with thermal screens commonly used in Korea were investigated using a hot box under ambient outdoor climatic conditions and in a laboratory system in which night sky radiation was simulated. U values measured at high wind speeds in outdoor experiments were greater than those measured at low wind speeds for all treatments. U values in indoor experiments under simulated night sky radiation were highest when the temperature difference between the inside and outside of the hot box was 10 ˚C, and decreased and ceased to change significantly as the temperature difference approached 20 ˚C. In terms of quantity of heat loss, differences in U values was greater for covering treatments with higher U values, and decreased as the temperature difference between the inside and outside of the hot box increased.
Because the differences between the inside and outside experiments were small, the experimental device used in this study can be considered reliable for measuring U values, and overall heat transfer coefficients can be obtained in a laboratory setting using a night sky radiation simulator.
These results demonstrate the feasibility of measuring the U values of greenhouse covering materials and thermal screens with indoor experiments.
This research was supported by Advanced Production Technology Development Program, Ministry of Agriculture, Food and Rural Affairs. This work was carried out with support from the Cooperative Research Program for Agriculture Science & Technology Development (Project No. PJ00852601), Rural Development Administration, Republic of Korea.
REFERENCES
1. Abdel-Ghany A.M., and T. Kozai. 2006. On the determination
of the overall heat transmission coefficient and soil heat flux for a fog cooled, naturally ventilated greenhouse:
analysis of radiation and convection heat transfer.
Energy Conversion and Management
47: 2612-2628.2. Albright, L.D., I. Seginer, L.S. Marsh, and A. Oko, 1985.
In situ thermal calibration of unventilated greenhouse.
J. agric. Engng Res
. 31: 265-281.3. Bailey, B. J., and Z. S. Chalabi, 1994. Improving the cost effectiveness of greenhouse climate control.
Computers and Electronics in Agriculture
10: 203-214.4. Baille, A., J. C. Lopez, S. Bonachela, M. M. Gonzalez- Real, and J. I. Montero, 2006. Night energy balance in a heated low-cost plastic greenhouse.
Agricultural and Forest Meteorology
137: 107-118.5. Diop, S., 2013. Development of measuring system of the overall heat transfer coefficient of greenhouse covering materials with thermal screens. Ph.D. diss., Kyungpook National University.
6. Diop, S., J. W. Lee, W. H. Na, and H. W. Lee, 2012.
Overall heat transfer coefficient measurement of covering materials with thermal screens for greenhouse using the hot box method.
Journal of the Korean Society of Agriculture Engineers
54(5): 1-7.7. Duffie J.A and W.A. Beckman, 1981. Solar engineering of thermal processes.
Wiley Interscience Publication
, New York.8. Feuilloley, P., and G. Issanchou, 1996. Greenhouse covering materials measurement and modeling of thermal properties using the hot box method, and condensation effects.
J. agric. Engng Res
. 65: 129-142.9. Garzoli, K.V., and J. Blackwell, 1987. An analysis of the nocturnal heat loss from a double skin plastic greenhouse.
J. agri. Engng Res
. 36: 75-85.10. Geoola, F., Y. Kashti, A. Levi, and R. Brickman, 2009.
A study of the overall heat transfer coefficient of greenhouse cladding materials with thermal screen using the hot box method.
Polymer Testing
28: 470- 474.11. Hanan, J.J., 1998. Greenhouse advanced technology for protected horticulture.
CRC Press
, New York.12. Lee, H. W., J. W. Lee, and S. Diop, 2013. Measuring system of the overall heat transfer coefficient of greenhouse
covering materials with thermal.
Magazine of the Korean Society of Agriculture Engineers
55(4): 50-58 (in Korean).13. Lee, H. W., J. W. Lee, S. Diop, and O. H. Na, 2014.
Measurement of overall heat transfer coefficient of covering material with thermal screens for plastic greenhouse.
Acta Hort
. 1037: 219-223.14. Japan Greenhouse Horticulture Association (JGHA), 1994. Greenhouse horticulture handbook, 170-173. Tokyo, Japan (in Japanese).
15. Kim, M.G., S. W. Nam, W. M. Suh, Y. C. Yoon, S. G.
Lee, and H. W. Lee, 2000. Agricultural structural engineering. Hyangmunsa, Korea (in Korean).
16. Kim, Y.B., S. Y. Lee, and B. R. Jeong, 2009. Analysis of the insulation effectiveness of the thermal insulator by the installation methods.
Journal of Bio-Environmental Control
18(4): 332-340 (in Korean).17. Kittas, C., 1994. Determination du coefficient global de transmission de chaleur à travers la paroi d’une serre.
[Overall heat transfer coefficient of the greenhouse cover].
Agricultural and Meteorolgy
69: 205-221.18. Max, J.F.J., G. Reisinger, T. Hofmann, J. Hinken, H.J.
Tantau, A. Ulbrich, S. Lambrecht, B.V. Elsner, and U.
Schurr, 2012. Glass–film-combination: Opto-physical properties and energy saving potential of a novel greenhouse glazing system.
Energy and Buildings
50:298-307.
19. Minagawa, H., and K. Tachibana, 1982. The overall heat transfer of greenhouses covered with PE and PVC
single layer–The heat insulation efficiency of greenhouses and their covering materials (1).
J. Agr. Met
. 38(1):15-22 (in Japanese).
20. Ministry of Food, Agriculture, Forestry, and Fisheries (MIFAFF), 2013. Status of vegetable production in South Korea, Korea (in Korean).
21. Na, W.H., J. W. Lee, S. Diop, and H. W. Lee, 2013.
Calculation of night sky temperature according to cloudiness in Daegu.
Current Research on Agriculture and Life Sciences
31(1): 40-46 (in Korean).22. Nijskens, J., J. Deltour, S. Coutisse, and A. Nisen, 1984. Heat transfer through covering materials of greenhouses.
Agricultural and Forest Meteorology
, 33: 193-214.23. Papadakis, G., D. Briassoulis, G.S Mugnozza, G. Vox, P. Feuilloley J.A Stoffers, 2000. Radiometric and thermal properties of, and testing in methods for, greenhouse covering materials.
Journal of Agricultural Engineering Research
77(1): 7-38.24. Rural Development Administration (RDA), 2008. Energy saving technology for greenhouse, 1-26. Korea (in Korean).
25. Seginer, I., D. Kantz, U.M. Peiper, and N. Levav, 1988.
Transfer coefficients of several polyethylene greenhouse covers.
J. agri. Engng Res
. 39: 19 -37.26. Ursula, E., and D. Antoine, 2011. Photovoltaic-thermal collectors for night radiative cooling of buildings.