DOI https://doi.org/10.12791/KSBEC.2018.27.4.294 eISSN 2288-100X
Evaluation of Overall Heat Transfer Coefficient of Different Greenhouse Thermal Screens Using Building Energy Simulation
Adnan Rasheed
1, Jong Won Lee
2and Hyun Woo Lee
1,3*
1Department of Agricultural Engineering, Kyungpook National University, Daegu 702-701, Korea
2Department of Horticulture Environment System, Korea National College of Agriculture and Fisheries, 1515, Kongjwipatjwi-ro, Deokjin-gu, Jeonju-si, Jeollabuk-do 54874, Republic of Korea
3Institute of Agricultural Science & Technology, Kyungpook National University, Daegu 702-701, Korea
Abstract. In winter, thermal screens are widely used to reduce heat loss from greenhouse to save energy. Unfortu- nately, not much data are available to the farmer to compare thermal screens while selecting the one that meets their specific requirements. Thus, there is a need to investigate the thermal performance of thermal screens. To address this issue, the Building Energy Simulation (BES) model of a hot box was used to calculate the overall heat transfer coefficient (U-value) of the thermal screens. To validate the model, computed and experimental U-values of single- and double-layered polyethylene (PE) material were compared. This validated model was used to predict the U-val- ues of the selected thermal screens under defined weather conditions. We quantified the U-values of each selected material and significant changes in their U-values were noted in response to different weather conditions. Notably, the thermal properties of the tested screens were taken from the previous literature to calculate U-values using the BES model. The U-values of the thermal screens can help researchers and farmers evaluate their screens and make pre-design decisions that suit their investment capabilities.
Additional key words: heat loss, energy saving, greenhouse heating, night sky radiation, TRNSYS
Introduction
In winter, heating is the most important aspect of green- house farming, as it is required to achieve the desired tem- perature for crop growth. To serve this purpose, different heating systems are typically used inside greenhouses. This leads to a significant increase in energy consumption of the greenhouse, consequently affecting production costs. A previous report noted that the heating cost of greenhouses has increased by up to 40% of the total production cost (Yang et al., 2012). Various studies have focused on employing different renewable energy sources in green- houses to reduce their production cost (Rasheed et al., 2015). Besides applying different heating systems, researchers and farmers are concerned about reducing heat loss. Among the passive heating modes practiced in green- houses, thermal screens are widely used for reducing heat loss during nighttime, thus resulting in energy savings (Ghosal and Tiwari, 2004). While designing a greenhouse, selection of appropriate material can positively affect the
energy demand and fuel consumption (Rasheed et al., 2018).
Studies have evaluated the efficiency of greenhouse ther- mal screens under a laboratory setup (Kim et al., 2007;
Kim et al., 2009; Chung et al., 2009). Here, a box made of specific test materials is provided the same heat energy, and the temperature inside the box is then measured for com- parison. Moreover, some experimental studies (Kittas et al., 2003; Teitel et al., 2009; Park et al., 2015) have analyzed the thermal screen materials by observing the internal tem- perature of a greenhouse with and without the screens.
Many types of thermal screens are available in the market, and researchers have estimated their efficiencies using dif- ferent methods. Currently, farmers have few opportunities to obtain information pertaining to the performance of the thermal screens for pre-design decision making (Hemming et al., 2017). Understanding the amount of heat loss through these materials is very important as this informa- tion would assist farmers make comparisons among differ- ent screen materials, to reduce their initial and production costs.
Some studies estimated the overall heat transfer coeffi- cient of thermal screens of various combinations with a hot
*Corresponding author: [email protected]
*Received August 24, 2018; Revised September 11, 2018;
*Accepted September 20, 2018
box (Diop et al., 2012; Diop et al., 2014; Lee et al., 2015).
An experimental study proposed a setup to quantify screens’ properties and better estimate the heat loss under different defined conditions (Hemming et al., 2017). The results of these studies showed a valuable information about thermal screens and can make compar- ison between them before making investment. Many BES models have been developed, providing more ave- nues for conducting such simulations. Compared with experimental studies, BES modeling is also cost-effective (Rasheed et al., 2017).
TRNSYS (Transient System Simulation) is a BES(Build- ing Energy Simulation) program, a versatile component- based program. It is used for the simulation of thermal sys- tems and has been available for 40 years. The complete pack- age consists of a series of programs and add-ons to enable its use for simulations of projects with complex designs (Klein, 2012). This program can also be used in tandem with many other softwares (e.g., Excel, Matlab, and ANSYS). Thus, this program is very adaptable and easy to use.
In this study, we used a previously proposed BES model of a hot box (Rasheed et al., 2017) to calculate the overall heat transfer coefficient (U-value) of greenhouse thermal screens. A number of screen materials available in the South Korean market were selected for this investigation under different weather conditions. The BES model was validated by laboratory experiments.
Materials and Methods
1. Experimental hot box
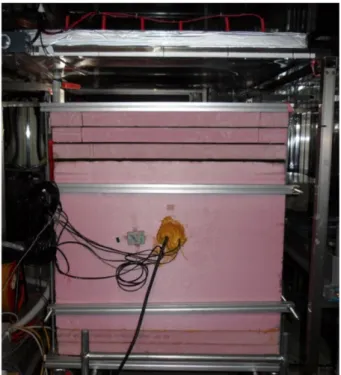
A calibrated laboratory hot box apparatus, designed in a previous study (Diop et al., 2014), can be seen in Fig. 1. It was used to measure the U-value of single- and double-lay- ered polyethylene (PE) for validation purposes. The whole apparatus was designed according to the American Society for Testing and Materials (ATSM) standards C-236-89 (ATSM, 1993). The dimensions of the hot box were 800
× 800×900mm3, with the base and walls made of 100-mm thick polystyrene insulation material. To achieve a desir- able internal temperature with reference to that outside the hot box, a heating device was introduced from the bottom.
The experiments were conducted during nighttime to observe the radiative heat loss during this time. A unit of dimensions 1000×1000mm2 was placed 200mm above the hot box. It was made of stainless steel, and coolant was
used inside the unit to achieve the desired sky temperature.
Fig. 2 shows the schematic of the hot box. Detailed infor- mation about its construction and setup can be found in (Diop et al., 2012).
Fig. 1. Laboratory experimental hot box.
Fig. 2. Schematic diagram of the hot box. (units: mm).
2. BES modeling
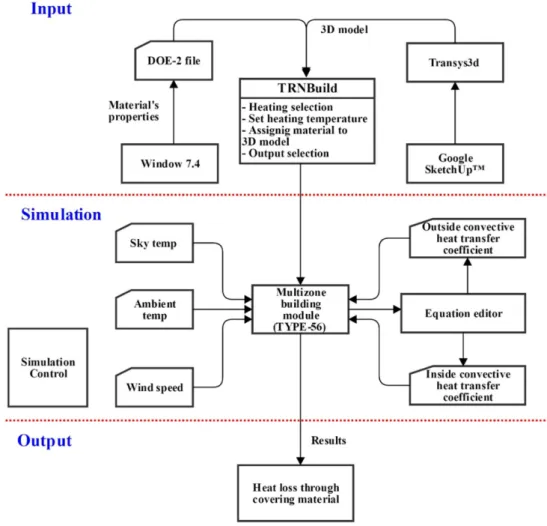
A BES model, designed and calibrated in our previous study (Rasheed et al., 2017) for the investigation of U-val- ues of the covering materials of the greenhouse, was used to run the simulations for the thermal screens. The model was developed by utilizing TRNSYS 18, as a BES pro- gram. For this study, we used following features of TRN- SYS 18, simulation studio, TRNBuild, and the following programs were applied for pre-processing the simulations:
Berkeley Lab Window 7.4 software, Google SketchUp™, and Trnsys3d. Fig. 3 shows the flow chart of the complete modeling process. Simulation Studio was used to link all the components by applying external weather conditions to the hot box using TYPE 56. TYPE 56 is a building compo- nent of TRNSYS, which opens in TRNBuild to capture basic information pertaining to the project. In addition, we added a 3D model of a greenhouse, prepared using Tran-
sys3d, a plugin for Google SketchUp™. To analyze the thermal screens, we prepared a DOE-2 file (readable by TRNBuild) using Berkeley Lab Window 7.4 software.
3. Simulation
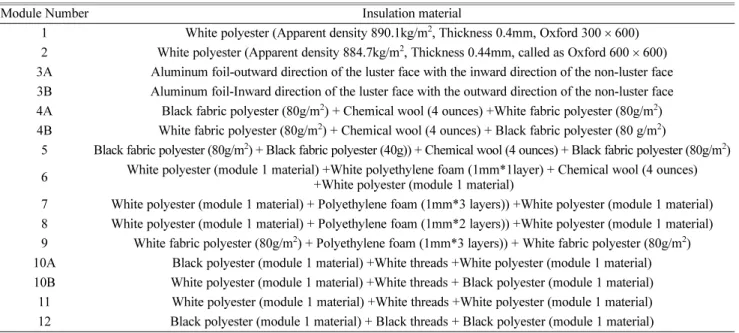
Table 1 shows the various components of the thermal screens. Table 2 shows the physical and thermal properties of the different thermal screens. Information about the tested thermal screens was sourced from (Kim et al., 2009).
The BES model was validated by comparing the simula- tion to the experimental results of the single- and double- layered PE material with and without night sky radiation.
The calibrated and validated model was then used to investigate the U-values of the single thermal screens pre- sented in Table 1, using the thermal properties shown in Table 2. Further investigations were conducted to calculate the U-values of the single thermal screens with combina- Fig. 3. Flow chart of BES procedure.
tions of single-layered PE material. The thermal properties of the PE material are shown in Table 3 (Valera et al., 2008).
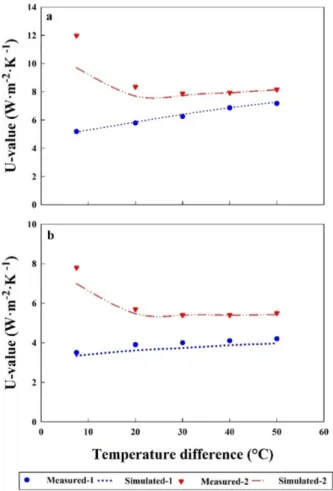
Figs. 4a and 4b show the computed and experimentally observed U-values of single- and double-layered PE, respectively. The outside temperature was fixed to 0oC, and the sky temperature was fixed to -20oC to observe night sky radiation effect. In addition, to simulate the effect of no night sky radiation, the sky temperature was fixed to 0oC, similar to the outside temperature. The results of both con- ditions were obtained for inside-to-outside temperature dif- ference ranging from 10 to 50oC. Table 4 shows the Table 1. Components of the thermal screens.
Module Number Insulation material
1 White polyester (Apparent density 890.1kg/m2, Thickness 0.4mm, Oxford 300× 600) 2 White polyester (Apparent density 884.7kg/m2, Thickness 0.44mm, called as Oxford 600× 600) 3A Aluminum foil-outward direction of the luster face with the inward direction of the non-luster face 3B Aluminum foil-Inward direction of the luster face with the outward direction of the non-luster face 4A Black fabric polyester (80g/m2) + Chemical wool (4 ounces) +White fabric polyester (80g/m2) 4B White fabric polyester (80g/m2) + Chemical wool (4 ounces) + Black fabric polyester (80 g/m2)
5 Black fabric polyester (80g/m2) + Black fabric polyester (40g)) + Chemical wool (4 ounces) + Black fabric polyester (80g/m2) 6 White polyester (module 1 material) +White polyethylene foam (1mm*1layer) + Chemical wool (4 ounces)
+White polyester (module 1 material)
7 White polyester (module 1 material) + Polyethylene foam (1mm*3 layers)) +White polyester (module 1 material) 8 White polyester (module 1 material) + Polyethylene foam (1mm*2 layers)) +White polyester (module 1 material) 9 White fabric polyester (80g/m2) + Polyethylene foam (1mm*3 layers)) + White fabric polyester (80g/m2) 10A Black polyester (module 1 material) +White threads +White polyester (module 1 material) 10B White polyester (module 1 material) +White threads + Black polyester (module 1 material) 11 White polyester (module 1 material) +White threads +White polyester (module 1 material) 12 Black polyester (module 1 material) + Black threads + Black polyester (module 1 material) Table 2. Physical and thermal properties of the thermal screens.
Module number Thickness (mm)
Conductivity
(W· m-1· K-1) Transmittance Reflectance Emittance
1 0.4 0.0123 < 0.001 0.116 0.884
2 0.44 0.0101 < 0.001 0.114 0.886
3A 1.05 0.0381 < 0.001 0.649 0.351
3B 1.05 0.0381 < 0.001 0.556 0.444
4A 6.40 0.0206 < 0.001 0.126 0.874
4B 6.40 0.0206 < 0.001 0.150 0.850
5 5.02 0.0226 < 0.001 0.128 0.872
6 3.96 0.0212 < 0.001 0.117 0.883
7 3.78 0.0338 < 0.001 0.135 0.865
8 2.59 0.0248 < 0.001 0.132 0.868
9 4.49 0.0388 < 0.001 0.116 0.884
10A 1.10 0.0237 < 0.001 0.114 0.886
10B 1.10 0.0237 < 0.001 0.119 0.881
11 1.53 0.0210 < 0.001 0.117 0.883
12 1.21 0.0231 < 0.001 0.113 0.887
Table 3. Polyethylene material properties.
Cover characteristics Greenhouse covering (PE)
Solar transmittance 0.86
Solar reflectance 0.10
Visible radiation transmittance 0.89 Visible radiation reflectance 0.08 Thermal radiation transmittance 0.18 Thermal radiation emission 0.79 Conductivity (W·m-1· K-1) 0.33
Thickness (mm) 0.10
validation results in terms of percentage error. The overall validation results show good agreement between the simu- lated and experimental findings. The minimum errors for the single- and double-layered PE in the absence of night sky radiation are 0 and 4%, whereas the maximum corre- sponding values are 1.3 and 8%, respectively. In the pres- ence of night sky radiation, the minimum error values are 0.3 and 0.2%, and the maximum values are 23 and 11%,
respectively. The higher errors occurred for night sky radia- tion, for the lower inside-to-outside temperature difference for both the single and double layers. This can be attributed to the fact that during the laboratory experiments, the sky temperature was not constant at the required temperature of -20oC; the distribution of night sky temperature on the screen ranged from -18 to -22oC. On the contrary, during the simulation, the sky temperature was fixed exactly to -20oC. In addition, while the radiative heat loss difference between the BES-computed values and the experimental values was the same for all the inside-to-outside tempera- ture differences, the difference between the validation results increased as the inside-to-outside temperature decreased (Rasheed et al., 2017).
The validation results point to the suitability of the pro- posed model for calculating the U-values of any material.
Furthermore, simulations were carried out for all the ther- mal screens detailed in Table 1. Figs. 5a and 5b show the U-values of the single-layer thermal screen. Figs. 5c and 5d show the U-values of the double-layered materials used in the greenhouse (i.e., the thermal screen combined with PE greenhouse covering). The results of both the single- and double-layered screens without night sky radiation showed an increasing trend for the U-value as the inside-to-outside temperature difference increased, as shown in Figs. 5a and 5c. This occurred because of the increasing convective heat transfer coefficient due to the increasing surface tempera- ture of the material. In addition, this increasing trend was similar to that observed in a previous study (Lee et al., 2015). Figs. 5b and 5d show variation in the U-values of the single- and double-layered thermal screens when the simulations were carried out for a sky temperature of -20°C (i.e., assuming the presence of night sky radiation). The results showed that for the lower inside-to-outside tempera- ture difference, the U-value was very high, and as the inside-to-outside temperature difference increased, the U- value started decreasing and became stabilized after reach- Fig. 4. Experimental versus simulated results for (a) single-lay-
ered PE and (b) double-layered PE. (In the legend, “1” indi- cates “with night sky radiation” and “2” indicates “without night sky radiation”.)
Table 4. Error percentage of validation results.
Material Condition Error (%)
Max Min
Single-layered With sky radiation 23 0.3
Without sky radiation 1.3 0
Double-layered With sky radiation 11 0.2
Without sky radiation 8 4.7
ing a temperature difference of 20oC. Moreover, the U- value of the thermal screens was high for all the inside-to- outside temperature differences in the presence of night sky radiation than without it. This trend is also in line with the findings of previous studies (Feuilloley and Issanchou, 1996; Diop et al., 2014).
Table 5 presents the U-values, of all tested single-lay- ered thermal screens at 30oC inside-to-outside temperature difference, sorted in ascending order. It includes consider- ation of the thickness, thermal conductivity, and emissivity of all the thermal screens. The results showed that materi- als in modules 4B and 4A show the lowest U-values. Thus, it can be concluded that the thickness and thermal conduc- tivity of the materials have a greater influence on their U- values; higher thickness and lower thermal conductivity caused less heat loss from the material. The U-value of material 6 is less than 10 even though its thickness is less than that of material 9, the reason being that the thermal conductivity of material 9 is higher than that of material 6.
The thermal conductivities of materials 1 and 2 are among
Fig. 5. U-values of thermal screens according to the inside-to-outside temperature difference for (a) single-layer thermal screen in the absence of night sky radiation, (b) single-layer thermal screen in the presence of night sky radiation, (c) double-layer thermal screen in the absence of night sky radiation, and (d) double-layer thermal screen in the presence of night sky radiation.
Table 5. Calculated U-value with material’s properties.
Module number
U-value (W· m-2· K-1)
Thickness (mm)
Conductivity
(W· m-1· K-1) Emissivity
4B 2.2 6.40 0.0206 0.874
4A 2.3 6.40 0.0206 0.850
5 2.7 5.02 0.0226 0.872
6 3.0 3.96 0.0212 0.883
9 3.8 4.49 0.0388 0.884
7 3.8 3.78 0.0338 0.865
8 3.9 2.59 0.0248 0.868
11 4.5 1.53 0.0210 0.883
3A 4.7 1.05 0.0381 0.351
3B 4.8 1.05 0.0381 0.444
12 4.9 1.21 0.0231 0.887
10A 5.1 1.10 0.0237 0.886
10B 5.1 1.10 0.0237 0.881
2 5.2 0.40 0.0101 0.884
1 5.5 0.44 0.0123 0.886
the lowest but due to their lower thicknesses, their U-val- ues are higher than those of all other materials. Moreover, thermal screens 4A and 4B have the same thickness and thermal conductivity, but their U-values are not the same because their emissivities are different. The same reason- ing applies to thermal screens 3A and 3B.
We compared the trend in U-values for the tested materi- als with the results of a previous study (Kim et al., 2009) conducted with the same materials. Kim et al. (2009) com- pared the variation in the inside temperature of the experi- mental box for each thermal screen material when the same heating was provided. They observed that material 7 recorded the highest inside temperature, and therefore, the lowest U-value. Material 7 had higher thermal conductiv- ity and was less thick than materials 4B, 4A, 5, 6, and 9.
Better performance has been noted for materials with low thermal conductivity (Kumar and Suman, 2013), and those with higher thickness will show less heat loss. We can con- clude that, materials 4B and 4A will show the better perfor- mance than others as the results noted less U-values than the others.
The U-value calculation by BES model is highly depen- dent on thermal properties of the material. Prior to this study, validated data for thermal screen properties were lacking. In this study, we used thermal properties of differ- ent thermal screen materials provided in a previous study and presented our results accordingly. Our future work will include measurements of the properties of different ther- mal screens available in the market and calculation of their U-values to help farmers select the best thermal material from among them.
Acknowledgement
This work was supported by the Korea Institute of Plan- ning and Evaluation for Technology in Food, Agriculture, Forestry and Fisheries (IPET) through the Agriculture, Food and Rural Affairs Research Center Support Program funded by the Ministry of Agriculture, Food and Rural Affairs (MAFRA) (717001-7).
Literature cited
ASTM, 1993. Standard test method for steady-state thermal performance of building assemblies by means of a guarded hot box. ASTM standards C236-89: 52-62.
Chung, S.W., D.K. Kim, S.G. Lee, S.H. Nam and Y.B. Lee.
2009. Heat insulation characteristics of multi layer materi- als for greenhouse. Journal of Bio-Environmental Control 18(4): 341-347 (in Korean).
Diop, S., J.W. Lee and H.W. Lee. 2014. Measurement and comparison of overall heat transfer coefficients for green- house covering materials with thermal screens. Journal of The Korean Society of Agricultural Engineers 56(4): 41-51.
Diop, S., J.W. Lee, W.H. Na and H.W. Lee. 2012. Overall heat transfer coefficient measurement of covering materials with thermal screens for greenhouse using the hot box method.
Journal of the Korean Society of Agricultural Engineers 54(5): 1-7.
Feuilloley, P. and G. Issanchou. 1996. Greenhouse covering materials measurement and modelling of thermal properties using the hot box method, and condensation effects. Journal of Agricultural Engineering Research 65(2): 129-142.
Ghosal, M.K. and G.N. Tiwari. 2004. Mathematical modeling for greenhouse heating by using thermal curtain and geo- thermal energy. Solar Energy 76(5): 603-613.
Hemming, S., E.B. Romero, V. Mohammadkhani and B. Van Breugel 2017. Energy saving screen materials: Measure- ment method of radiation exchange, air permeability and humidity transport and a calculation method for energy sav- ing. Wageningen University & Research, BU Greenhouse Horticulture.
Kim, Y.B., S.Y. Lee and B.R.J.J.O.B.-E.C. Jeong. 2009. Anal- ysis of the insulation effectiveness of the thermal insulator by the installation methods. Journal of Bio-Environmental Control 18(4): 332-340 (in Korean).
Kim, Y.B., J.C. Park, M.R. Huh, S.Y. Lee and S.W.J.J.O.B.- E.C. Jeong. 2007. Effectiveness of the aluminum thermal screens depending on the allocation type. Journal of Bio- Environmental Control 16(4): 284-290 (in Korean).
Kittas, C., N. Katsoulas and A. Baille. 2003. Influence of an aluminized thermal screen on greenhouse microclimate and canopy energy balance. Transactions of the ASAE 46(6):
1653-1663.
Klein, S.A. 2012. Trnsys, a transient system simulation pro- gram. Solar Energy Laborataory, University of Wisconsin-- Madison.
Kumar, A. and B.M. Suman. 2013. Experimental evaluation of insulation materials for walls and roofs and their impact on indoor thermal comfort under composite climate. Building and Environment 59: 635-643.
Lee, J.W., D.K. Kim and H.W. Lee. 2015. A numerical study for calculation of overall heat transfer coefficient of double layers covering and insulation material for greenhouse. Cur- rent Research on Agriculture and Life Sciences 33(2): 41-47 (in Korean).
Park, B.S., T.H. Kang and C.S. Han. 2015. Analysis of heat- ing characteristics using aluminum multi-layer curtain for protected horticulture greenhouses. Journal of Biosystems
Engineering 40(3): 193-200.
Rasheed, A., J. Lee and H. Lee. 2018. Development and opti- mization of a building energy simulation model to study the effect of greenhouse design parameters. Energies 11(8): 1- 19.
Rasheed, A., J.W. Lee and H.W. Lee. 2015. A review of greenhouse energy management by using building energy simulation. Protected Horticulture and Plant Factory 24(4):
317-325.
Rasheed, A., J.W. Lee and H.W. Lee. 2017. Development of a model to calculate the overall heat transfer coefficient of greenhouse covers. Spanish Journal of Agricultural Research. 15(4): 1-11.
Teitel, M., M. Barak and A. Antler. 2009. Effect of cyclic
heating and a thermal screen on the nocturnal heat loss and microclimate of a greenhouse. Biosystems Engineering.
102(2): 162-170.
Valera, M.D., A.F. Molina and M.A. Alvarez 2008. Protocolo de auditoría energética en invernaderos. Auditoría Energética De Un Invernadero Para Cultivo De Flor Cor- tada En Mendigorría, Madrid, Instituto Para La Diversifi- cación Y Ahorro De La Energía (in spanish).
Yang, S.H., C.G. Lee, W.K. Lee, A.A. Ashtiani, J.Y. Kim, S.D.
Lee and J.Y. Rhee. 2012. Heating and cooling system for utilization of surplus air thermal energy in greenhouse and its control logic. Journal of Biosystems Engineering. 37(1):
19-27.
BES를 이용한 온실용 보온커튼의 관류열전달계수 산정
라쉬드아드난
1· 이종원
2· 이현우
1,3*
1경북대학교 농업토목공학과,
2한국농수산대학 원예환경시스템학과,
3경북대학교 농업과학기술연구소
적 요. 겨울철에 열손실을 줄이기 위해 많은 온실에서 보온커튼을 사용하고 있다. 그러나 적절한 보온커튼을
선택할 때 판단 자료로 활용할 수 있는 명확한 기준이 없는 실정이며 이를 위해서는 보온재의 보온 특성에 대 한 정량적인 값이 필요하다. 본 연구에서는 BES를 사용하여 보온커튼의 관류열전달계수를 산정하는 시뮬레이 션 모델을 개발하였다. 일중 및 이중 PE필름 피복에 대한 관류열전달계수의 실험값을 사용하여 시뮬레이션 결 과를 검증하였다. 검증된 모델을 사용하여 문헌에서 제시된 각종 열적 특성을 가진 보온커튼에 대한 관류열전 달계수를 산정하고 비교분석하였다. 개발된 시뮬레이션 모델은 다양한 보온커튼의 관류열전달계수를 산정하는 데 활용될 수 있을 것이며, 제시된 관류열전달계수는 보온커튼의 성능을 정량적으로 비교하는데 유용하게 활용 될 수 있을 것으로 판단된다.
추가주제어 :야간천공복사, 열손실, 온실난방, 에너지절감, 트랜시스