Randomized, Sham Controlled Trial of Transcranial Direct Current Stimulation for
Painful Diabetic Polyneuropathy
Yon Joon Kim, MD
1, Jeonghun Ku, PhD
2, Hyun Jung Kim, MD
1, Dal Jae Im, MD
1, Hye Sun Lee, MS
3, Kyung Ah Han, MD
4, Youn Joo Kang, MD
11
Department of Rehabilitation Medicine, Eulji Hospital, Eulji University School of Medicine, Seoul;
2Department of Biomedical Engineering, Keimyung University, Daegu;
3Department of Biostatistics, Yonsei University College of Medicine, Seoul;
4
Department of Medicine, Eulji Hospital, Eulji University School of Medicine, Seoul, Korea
Objective To investigate the analgesic effect of transcranial direct current stimulation (tDCS) over the primary motor (M1), dorsolateral prefrontal cortex (DLPFC), and sham tDCS in patients with painful diabetic polyneuropathy (PDPN).
Methods Patients with PDPN (n=60) were divided randomly into the three groups (n=20 per group). Each group received anodal tDCS with the anode centered over the left M1, DLPFC, or sham stimulation for 20 minutes at intensity of 2 mA for 5 consecutive days. A blinded physician rated the patients’ pain using a visual analog scale (VAS), Clinical Global Impression (CGI) score, anxiety score, sleep quality, Beck Depression Inventory (BDI), and the pain threshold (PT) to pressure.
Results After the tDCS sessions, the M1 group showed a significantly greater reduction in VAS for pain and PT versus the sham and DLPFC groups (p<0.001). The reduction in VAS for pain was sustained after 2 and 4 weeks of follow-up in the M1 group compared with the sham group (p<0.001, p=0.007). Significant differences were observed among the three groups over time in VAS for pain (p<0.001), CGI score (p=0.01), and PT (p<0.001). No significant difference was observed among the groups in sleep quality, anxiety score, or BDI score immediately after tDCS.
Conclusion Five daily sessions of tDCS over the M1 can produce immediate pain relief, and relief 2- and 4-week in duration in patients with PDPN. Our findings provide the first evidence of a beneficial effect of tDCS on PDPN.
Keywords Transcranial direct current stimulation, Chronic pain, Diabetic neuropathy
Annals of Rehabilitation Medicine
Ann Rehabil Med 2013;37(6):766-776 pISSN: 2234-0645 • eISSN: 2234-0653 http://dx.doi.org/10.5535/arm.2013.37.6.766
INTRODUCTION
Diabetes mellitus (DM) is a chronic disease causing injury from the peripheral nerves to the brain. About 30% of diabetic patients experience neuropathic pain [1].
Painful diabetic polyneuropathy (PDPN) is characterized by persistent pain that substantially affects the quality of life of diabetic patients. It can lead to moderate-to-severe
Received May 31, 2013; Accepted August 19, 2013 Corresponding author: Youn Joo Kang
Department of Rehabilitation Medicine, Eulji Hospital, 68 Hangeul
biseongro, Nowongu, Seoul 139711, Korea
Tel: +8229708315, Fax: +8229798268, Email: [email protected] This is an openaccess article distributed under the terms of the Creative Commons Attribution NonCommercial License (http://creativecommons.
org/licenses/bync/3.0) which permits unrestricted noncommercial use, distribution, and reproduction in any medium, provided the original work is properly cited.
Copyright © 2013 by Korean Academy of Rehabilitation Medicine
unremitting lower limb pain in over 70% of sufferers [2].
Not surprisingly, those affected experience a reduction in their daily activities and loss of employment, which can result in profound depression and poor quality of life [3]. The management of PDPN can be challenging for the clinician and the patient because the pain is often unre- sponsive, or only partially responsive to existing pharma- cological approaches [4].
Previous research on PDPN has focused on peripheral nervous system dysfunction. Injury to peripheral nerves causes functional and biochemical changes at the site of injury [5]. However, recent studies have suggested that central neuropathic mechanisms can also contribute to the pain experienced with diabetes [6]. Furthermore, recent studies revealed that the central nervous system (CNS) is involved during even in the early stages of PDPN [7]. During the progression of PDPN, higher-order neu- rons within the spinal cord and brain are affected [8].
Advances in neuroimaging methods have resulted in a better understanding of how PDPN affects the CNS. Mag- netic resonance spectroscopy has demonstrated thalamic dysfunction in patients with DM [9]. In experimental models, neurons in the ventral posterolateral thalamus can become hyperexcitable, firing at abnormally high fre- quencies and generating aberrant spontaneous activity [10].
Non-invasive brain stimulation (NBS) may modulate neuropathic pain that is refractory medical treatment.
Repetitive transcranial magnetic stimulation (rTMS), cra- nial electrotherapy stimulation, and transcranial direct current stimulation (tDCS) are effective in reducing neu- ropathic pain [11]. In tDCS, the cerebral cortex is non- invasively and painlessly stimulated using a weak direct current in non-invasive and painless manner. Further- more, tDCS may have some advantages in that it may lead to longer-lasting modulatory effects on cortical function, is easy to administer and perform, less expensive, and provides a reliable sham-stimulation condition to assess the specificity of the effects compared with other meth- ods [11,12].
Several trials have demonstrated that tDCS applied over the primary motor cortex (M1) may relieve chronic pain in spinal cord injury, trigeminal neuralgia, and multiple sclerosis [13-15]. To our knowledge, no previous study has used tDCS in PDPN and no consensus about the ap- propriate electrode position has been reached. Thus, we
sought to assess whether anodal tDCS stimulation on M1 or the dorsolateral prefrontal cortex (DLPFC) is associ- ated with a clinical reduction of pain and other benefits, such as improvements in physical function, anxiety, and depression, as compared with sham stimulation in patients with PDPN. The M1 and DLPFC were chosen as targets because previous studies revealed that stimu- lation of M1 induces a significant analgesic effect, and DLPFC stimulation is associated with a significant anal- gesic or anti-depressive effect [16,17].
MATERIALS AND METHODS Subjects
Seventy two patients with type 2 DM presenting with chronic, drug-resistant neuropathic pain were enrolled.
All patients were selected from inpatient services at the Diabetes Mellitus Center of the Department of Endocri- nology at our hospital. They were regarded as suitable to participate if they fulfilled the following criteria: 1) DM diagnosis by blood sugar levels [18], 2) PDPN diagnosis by electrodiagnostic tests or neuropathy total symptom score (NTSS) >6 [19], 3) score ≥4 or higher (0=‘no pain’
and 10=‘worst possible pain’) on a visual analog scale (VAS) for pain perception at treatment baseline, 4) stable chronic pain for at least 3 preceding months, and 5) per- sistent pain after taking medications, such as non-steroi- dal anti-inflammatory drugs, tramadol, antidepressants, antiepileptic drugs, or opioids.
We excluded patients with PDPN who had 1) any un- controlled clinical disease (as evaluated by each patient’s clinician), such as thyroid, cardiovascular, pulmonary, hematological, pulmonary, or renal disease or psychiatric disorder; 2) history of substance abuse or neuropsychi- atric comorbidity; 3) implanted devices for pain control, such as vagal or deep brain stimulators; 4) pain attribut- able to other causes, such as spinal stenosis, peripheral blood vessel disease, lower extremity edema-related pain, and neuropathic pain due to a brain lesion or pe- ripheral nerve injury; 5) contraindication for tDCS, such as an intracranial or orbital metallic implant or pacemak- er; 6) Parkinson disease; 7) alcoholism; and/or 8) severe cognitive deficit on the Mini-Mental Status Examination (MMSE) score <24).
Patients who were receiving medication for pain were
not excluded. Pharmacological therapies that showed
no or limited positive effects or side effects at high dos- ages were observed in all patients. We selected patients receiving stable doses of analgesics for at least 2 months prior to the beginning of this study. No changes in the medication regimens for pain were permitted throughout the trial.
All patients who consented to participate in this study were informed about tDCS and the experimental pro- tocol, which was approved by the Institutional Review Board of our hospital.
The sample size for a mixed model (repeated-measures analysis of variance [ANOVA]) was calculated according to the primary end points. We considered three groups and four time repetitions to detect differences by VAS.
A sample size of 51 participants was sufficient to detect an effect value of 0.25 (Cohen’s medium effect size) and correlation among repeated measures of 0.3 at a signifi- cance level of 0.05 (two-sided) with 90% power, using the G*Power software (ver. 3.0.10; http://www.psycho.uni- duesseldorf.de/abteilungen/aap/gpower3). We thus de- termined a sample size of 72 participants, considering a 30% drop-out rate.
Experimental design
The randomized, sham-controlled, single-center trial was designed to evaluate the efficacy and safety of tDCS
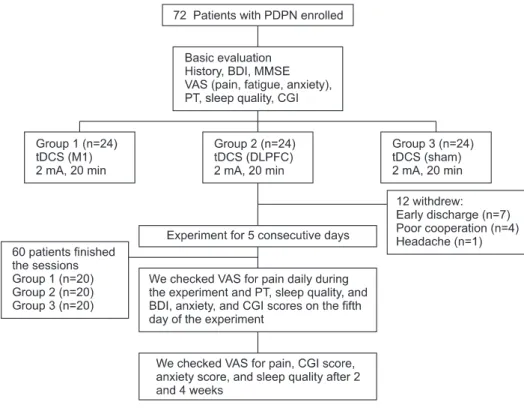
sessions in PDPN. All patients were divided into three groups: M1, sham, and DLPFC (Fig. 1). Randomization was performed using the order of entry into the study and a computer-generated randomization chart with random blocks of six patients each. This study consisted of a 5-day period of tDCS treatment; the number of stimulation sessions was established on the basis of previous studies that showed the efficacy of tDCS in the treatment of other causes of chronic pain [13,20]. Patients and the assess- ing physicians were blinded to group allocation, whereas the treating physician, who set the tDCS according to the protocol, was aware of the stimulation condition. To minimize communication among patients, the treating physician was instructed not to talk to patients or the as- sessing physicians regarding the experiment protocol.
This study had three phases: 1) baseline evaluation consisting of the administration of a VAS for pain, Clini- cal Global Impression (CGI), BDI, and pain threshold (PT) using a pressure algometer; 2) a period of daily treatment sessions with tDCS for 5 consecutive days; and 3) follow- up evaluations conducted after 2 and 4 weeks. The as- sessing physician conducted baseline evaluations of all patients, including the measurement of glycated hemo- globin (HbA1c) concentration, calculation of the NTSS score [19], determination of the durations of DM and PDPN, MMSE score, and collection of the medication
Fig. 1. Patient flow diagram. Twel ve patients withdrew from the study:
seven had early discharge dur- ing stimulation sessions and five withdrew after the third se ssion of stimulation because of poor coop- eration (n=4) or headache (n=1).
PDPN, painful diabetic polyneu- ropathy; BDI, Beck Depression Index; MMSE, Mini-Mental State Examination; VAS, visual analog scale; PT, pain threshold; CGI, Clinical Global Impression; tDCS, transcranial direct current stimula- tion; M1, primary motor cortex;
DLPFC, dorsolateral prefrontal
cortex.
history for pain (type and mean dose). The assessing phy- sicians also administered the VAS for pain daily after the tDCS session, determined CGI, anxiety, and BDI scores, assessed sleep quality in terms of subject reported total sleep time and number of awakenings during sleep [21], and measured the PT after 5 days of tDCS sessions. VAS for pain, CGI, anxiety score, and sleep quality were also assessed after 2 and 4 weeks by telephone. The CGI re- flects the severity of illness and is rated on a seven-point scale ranging from 1 to 7, where 1 indicates normal (not ill) and 7 indicates the most severe illness. The severity of illness item requires the physician to rate the severity of a patient’s illness at the time of assessment relative to the physician’s past experience with patients who had the same diagnosis [22]. We measured the domains of depression using BDI and VAS for anxiety because both can be important confounders in pain improvement. The BDI is a 21-item test presented in multiple-choice format, which measures the presence and the degree of depres- sion in adults [23]. The VAS for anxiety is a self evaluation scale ranging from 0 to 10, where 0 indicates no anxiety and 10 indicates the worst possible anxiety.
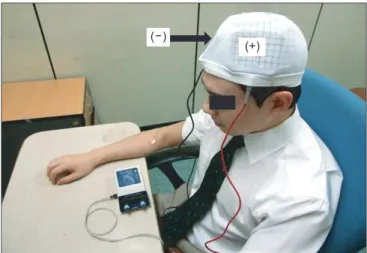
tDCS
A Phoresor II PM850 anodal tDCS was used (IOMED, Salt Lake City, UT, USA). For M1 anodal stimulation, the anode (saline-soaked electrodes, 5×5cm) was placed over C3 (EEG 10/20 system) and the cathode over the contra- lateral supraorbital area (Fig. 2). For anodal stimulation in the DLPFC group, the anode was placed over F3 (EEG 10/20 system) and the cathode over the contralateral su- praorbital area. This method of DLPFC localization has been used and has been confirmed to be relatively accu- rate by neuro-navigation [24,25]. A constant current with an intensity of 2 mA was used for a single 20-minute ses- sion. This protocol is safe and effective in patients with neuropathic pain [13]. For sham stimulation, the same electrode positions were used as in anodal M1 stimula- tion, but the stimulator was on for only 30 seconds. The patients felt the initial itching sensation but received no current for the rest of the stimulation period. This meth- od of sham stimulation is reliable [12,14].
Evaluation of PT
The blinded assessing physician evaluated PT before and after five sessions of tDCS. PT recordings involved
applying an increasing amount of blunt pressure using the 1 cm
2hard rubber end of a Commander algometer (JTECH Medical Industries, Salt Lake City, UT, USA). Sev- eral discrete pressures were applied successively to the more painful (right or left) sole region at an approximate rate of 2 lb/s until the subject reported perceiving pain, at which point the device was removed and the PT value was recorded [26]. This procedure was repeated three times and then averaged for analysis. If patients com- plained of pain equally on both soles, PT was checked on the right or left side randomly three times and the values were averaged.
Adverse effects
Patients were queried after each session of tDCS and in the follow-up whether they had experienced adverse ef- fects and how these effects were related to the tDCS treat- ment. Known adverse effects during and/or after applica- tion of tDCS are a tingling sensation, moderate fatigue, a light itching sensation under the stimulation electrodes, headache, nausea, and insomnia [27].
Statistical analyses
For statistical analyses, a linear mixed model for a repeated-measures covariance pattern model with un- structured covariance within subjects was used. Two
Fig. 2. Anodal tDCS. The anode was positioned over the
M1 or DLPFC and the cathode over the contralateral su-
praorbital region (2 mA for 20 minutes on 5 consecutive
days). tDCS, transcranial direct current stimulation; M1,
primary motor cortex; DLPFC, dorsolateral prefrontal
cortex.
fixed effects were included: one between-subjects group effect (M1, sham, and DLPFC) and one within-subject time effect (four times: baseline, 5 days, 2 weeks, and 4 weeks). Possible difference variables (VAS for pain, CGI, anxiety score, sleep quality, BDI score, and PT) in the groups across time were analyzed according to time × group interactions. Likewise, dates of maximal pain re- duction (VAS for pain) were analyzed among subjects to determine time effects at eight time points (baseline; 1, 2, 3, 4, and 5 days; and 2 and 4 weeks) using a mixed model.
When a significant difference among the three groups was noted across time, a post-hoc Bonferroni multiple- comparisons test was also used. We divided the three groups into two categories according to reduction in VAS for pain on the fifth day (>30% and <30%) and performed
chi-square tests to identify correlations among the three groups. We also used one-way ANOVA for baseline com- parisons among the three groups (p<0.05) and Student t-test for comparisons of analgesic effect and other base- line characteristics (age, sex, pain duration, baseline PT and baseline BDI, anxiety, and CGI scores). All data were analyzed using the SAS ver. 9.2 software (SAS Institute, Cary, NC, USA). Unless stated otherwise, all results are presented as mean±standard deviation and statistical significance refers to a two-tailed p-value <0.05.
RESULTS
Twelve (15%) subjects dropped out during the experi- ment (four each in the M1, DLPFC, and sham groups).
Table 1. Clinical and demographic characteristics of the 60 subjects
Characteristic M1 tDCS
(n=20) Sham tDCS
(n=20) DLPFC tDCS
(n=20) p-value
Gender, male 9 (45) 8 (40) 8 (40)
Age (yr) 59.60±13.15 61.60±10.27 63.50±8.75 0.848
Duration of DM (yr) 14.00±7.42 15.75±7.97 13.45±6.32 0.286
NTSS 9.78±2.70 9.29±1.75 9.30±1.76 0.671
Pain location
Hand 4 4 3
Foot 20 20 20
Both 4 4 3
Duration of pain (yr)
>5 10 10 11
2–5 10 10 9
<2 0 0 0
Baseline
VAS for pain 5.75±0.71 5.55±0.78 5.70±0.73 0.692
BDI score 10.60±2.95 11.10±3.55 8.75±1.94 0.774
PT (Ib) 3.19±0.70 3.29±0.62 3.44±0.52 0.993
CGI 4.45±0.99 4.70±1.13 4.35±1.09 0.507
HbA1c (%) 9.81±1.95 9.84±2.15 9.80±1.68 0.998
MMSE 27.00±2.69 27.05±2.12 27.30±2.32 0.204
Fasting BST (mg/dL)
1st day
a)137.75±39.95 131.10±36.32 134.05±39.93 0.858
5th day
b)135.40±39.30 129.00±31.69 130.10±19.91 0.667
Values are presented as mean±standard deviation or number (%).
tDCS, transcranial direct current stimulation; M1, primary motor cortex; DLPFC, dorsolateral prefrontal cortex; DM, diabetes mellitus; NTSS, Neuropathy Total Symptom Score; VAS, visual analog scale; BDI, Beck Depression Inventory;
PT, pain threshold; CGI, Clinical Global Impression; MMSE, Mini-Mental State Examination; BST, blood sugar test.
a)
BST at baseline,
b)BST at the end of tDCS sessions.
The reasons were early discharge in seven patients, poor cooperation in four, and headache in one patient. Sixty patients underwent five consecutive tDCS treatment sessions with no significant adverse effects. The mean ages of the three groups were 59.6±13.15 years in the M1 group, 61.6±10.27 years in the sham group, and 63.5±8.75 years in the DLPFC group (Table 1).
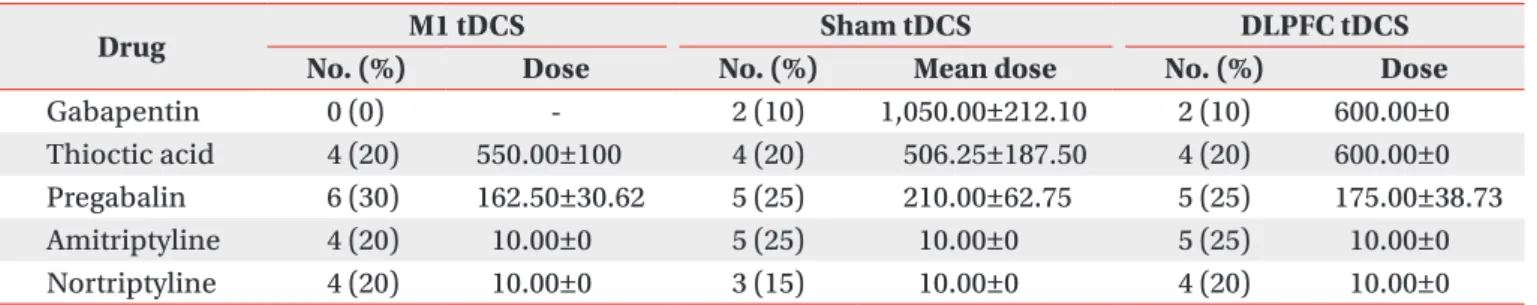
No baseline difference among the three groups was observed in terms of age, sex, duration of DM, duration of pain, HbA1c concentration, severity of NTSS, VAS for pain, PT, medication characteristics, or BDI, CGI, or MMSE score (Tables 1, 2). The most common sites of pain were the lower extremities (100%), upper extremi- ties (18.3%), and both (18.3%). No changes were evident in the three groups concerning changes in fasting glucose levels on day 1 and 5 of tDCS application (Table 1). The patients were given routine medical treatment according to the guidelines of our pain clinic using pregabalin (150–
300 mg), gabapentin (600–1,200 mg), and thioctic acid (225–600 mg). Other medications used included NSAIDs (51.66%) and tricyclic antidepressants (40%). No patient was taking morphine (Table 2). No significant differences in medication was found among the three groups.
Improvement in VAS pain score after tDCS treatment Results from the mixed model showed a significant interaction in time versus group for pain reduction
(F
(6,57)=8.96, p<0.001). Post-hoc comparisons showed that
the M1 group had greater pain reduction than the sham (t=6.46, p<0.001) and DLPFC (t=5.39, p<0.001) groups after tDCS sessions. Furthermore, the M1 group showed greater pain reduction than the sham group after 2 weeks (t=4.07, p<0.001) and 4 weeks (t=3.17, p=0.007) of the follow-up period (Fig. 3). Likewise, the M1 group showed greater pain reduction than the DLPFC group (t=3.64,
p=0.002) after 2 weeks.
Baseline VAS scores for pain in the M1 group decreased from 5.750±0.716 to 3.800±0.523, and 33.91% (20%–50%) of maximal pain reduction occurred after the fifth tDCS session. In the sham group, the baseline VAS score for pain was 5.550±0.759 and pain decreased after the tDCS sessions to 4.800±0.615; 13.51% (0%–33.3%) of pain re- duction was reported after tDCS sessions. In the DLPFC group, the baseline VAS score for pain was 5.700±0.732 and it decreased after tDCS sessions to 4.450±0.759;
21.93% (0%–33.3%) of pain reduction compared with baseline was reported. At the time of the fifth tDCS ses-
Fig. 3. After 5 consecutive days of tDCS sessions over M1, pain reduction was significantly greater compared with the sham and DLPFC groups (***p<0.001) and compared with the sham group, its analgesic effect was sustained after 2 weeks (***p<0.001) and 4 weeks (**p<0.01) of follow-up. Likewise, the M1 group showed greater pain reduction than the DLPFC group (**p<0.01) after 2 weeks.
tDCS, transcranial direct current stimulation; M1, pri- mary motor cortex; DLPFC, left dorsolateral prefrontal cortex; VAS, visual analog scale.
Table 2. Medications used in the study
Drug M1 tDCS Sham tDCS DLPFC tDCS
No. (%) Dose No. (%) Mean dose No. (%) Dose
Gabapentin 0 (0) - 2 (10) 1,050.00±212.10 2 (10) 600.00±0
Thioctic acid 4 (20) 550.00±100 4 (20) 506.25±187.50 4 (20) 600.00±0
Pregabalin 6 (30) 162.50±30.62 5 (25) 210.00±62.75 5 (25) 175.00±38.73
Amitriptyline 4 (20) 10.00±0 5 (25) 10.00±0 5 (25) 10.00±0
Nortriptyline 4 (20) 10.00±0 3 (15) 10.00±0 4 (20) 10.00±0
Values are presented as mean±standard deviation.
tDCS, transcranial direct current stimulation; M1, primary motor cortex; DLPFC, dorsolateral prefrontal cortex.
sion, 13/20 (65%) subjects in the M1 group, but only one patient (5%) in the sham group and seven (35%) in the DLPFC group, reported ≥30% pain reduction. This differ- ence across the three groups was statistically significant (p<0.001).
We analyzed whether the effect of pain reduction was related to age, pain duration, body mass index, baseline PT, and/or baseline BDI, anxiety, and CGI scores. We divided all patients into two categories: >30% and <30%
reduction in VAS score for pain (n=21 and n=39, respec- tively). Pain reduction did not differ significantly accord- ing to baseline characteristics (p>0.05).
CGI scale
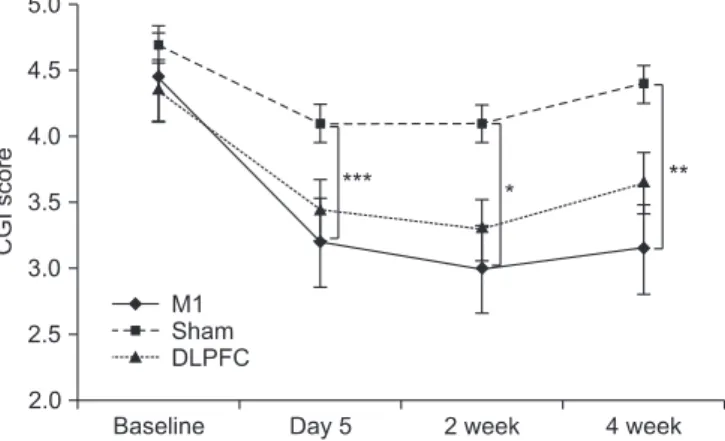
The baseline CGI score in the M1 group was 4.45±0.99;
after five sessions of tDCS, the CGI score decreased to 3.05±0.99. The CGI score decreased compared with base- line by about 31.46% (0%–80%) in the M1 group. In the sham group, the baseline CGI score was 4.7±1.13 and this score decreased to 4.35±0.74 after the tDCS sessions. A 7.45% (0%–20%) change in the CGI score from baseline was observed. In the DLPFC group, the baseline CGI score was 4.35±1.09 and this score decreased to 3.45±1.05 after the tDCS sessions, representing a 20.68% (0%–40%) reduction from baseline. A significant time versus group
interaction was observed for CGI change (F
(6,57)=2.96, p=0.01). Post-hoc comparison showed that the M1 group had a significantly greater CGI score reduction after tDCS sessions (t=4.01, p<0.001), and at 2 weeks (t=2.87, p=0.02) and 4 weeks (t=3.16, p=0.008) in the follow-up period, versus the sham group. No significant difference in the change in CGI score was noted between the M1 and DLP- FC or the sham and DLPFC groups (Fig. 4).
PT to pressure
The baseline PT in the M1 group was 3.19±0.70 lb/s and PT increased to 3.41±0.73 lb/s after five sessions of tDCS.
PT increased about 6.44% (0%–11.53%) relative to base- line. In the sham group, baseline PT was 3.27±0.59 lb/s and PT increased to 3.36±0.56 lb/s after tDCS sessions, a 2.67% (-2.32% to 7.40%) PT change relative to baseline.
In the DLPFC group, baseline PT was 3.44±0.52 lb/s and it increased to 3.55±0.52 lb/s after the tDCS sessions, a 2.25% (-2.77% to 8.57%) change relative to baseline. Re- sults from the mixed model showed a significant time versus group interaction for change in PT (F
(2,57)=15.44, p<0.001). Post-hoc comparisons showed a significantly greater increase in PT in the M1 group than in the DLPFC group (t=5.41, p<0.001) or the sham group (t=-3.81, p<0.001) after the tDCS sessions (Fig. 5).
Anxiety, sleep characteristics, and BDI score
Although significant anxiety score changes were ob- served among the three groups over time (F
(6,57)=2.84,
Fig. 4. After 5 consecutive days of tDCS sessions, the M1 group exhibited a significantly greater reduction in CGI score (***p<0.001), which was decreased significantly af- ter 2 and 4 weeks of follow-up compared with the sham group (*p=0.02, **p=0.008). CGI is rated on a 7-point scale: 1, normal, not ill at all; 2, borderline mentally ill; 3, mildly ill; 4, moderately ill; 5, markedly ill; 6, severely ill; 7, most severely ill. tDCS, transcranial direct current stimu- lation; M1, primary motor cortex; DLPFC, left dorsolat- eral prefrontal cortex; CGI, Clinical Global Impression.
Fig. 5. After 5 consecutive days of tDCS sessions, the M1
group exhibited a significantly greater increase in pain
threshold compared with the sham and DLPFC groups
(***p<0.001). tDCS, transcranial direct current stimula-
tion; M1, primary motor cortex; DLPFC, left dorsolateral
prefrontal cortex.
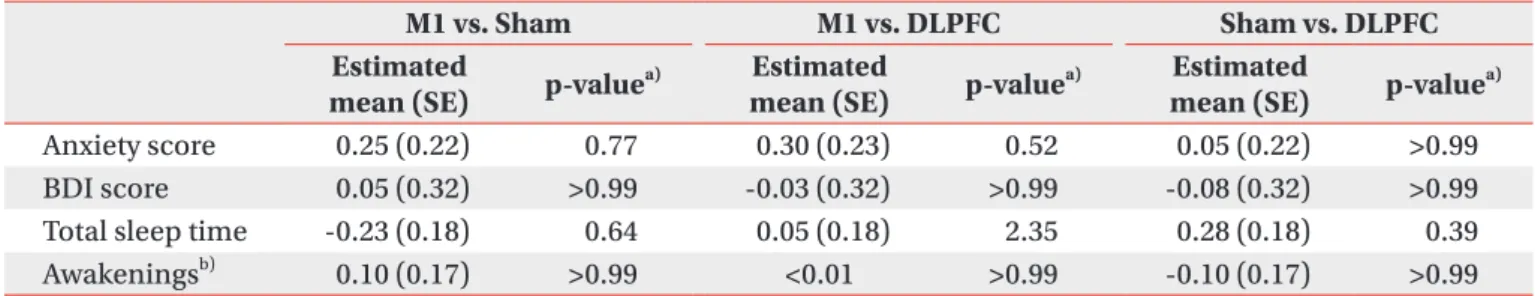
interaction p=0.02), post-hoc comparisons revealed no difference in the immediate change in anxiety score after five tDCS sessions between the M1 and sham (t=1.15, p=0.77) or M1 and DLPFC (t=1.37, p=0.52) groups (Table 3). The M1 group showed significantly greater reductions in anxiety scores than did the sham group after 2 and 4 weeks during the follow-up period (p=0.005, t=3.28;
p=0.03, t=2.62).
Changes in sleep quality were assessing by total sleep time and number of awakenings. No significant change in total sleep time (F
(6,57)=0.86, interaction p=0.53) or number of awakenings (F
(6,57)=0.85, interaction p=0.54) was observed among the three groups over time (Table 3).
We assessed BDI scores in all subjects before tDCS and after five sessions of tDCS. In the M1 group, baseline BDI was 10.60±2.94 and it was 9.55±2.35 after tDCS. In the sham group, baseline BDI was 11.10±3.55 and it was 10.10±3.12 after tDCS. In the DLPFC group, baseline BDI was 8.75±1.94 and it was 7.75±1.65 after tDCS. After 5 days of tDCS sessions, changes in BDI score did not differ significantly among the three groups (F
(2,57)=0.03, interac- tion p=0.97) (Table 3).
Adverse effects
All participants tolerated tDCS well without experienc- ing any significant adverse effects. Six incidents of ad- verse events occurred in the three groups. The adverse events were headache (three patients: two in the M1 group and one in the DLPFC group) and itching under the electrodes (three patients: one in each group).
DISCUSSION
The results presented here show that in patients with
PDPN, anodal tDCS at the M1 significantly improved pain and PT to pressure versus DLPFC and sham stimu- lation. This effect was specific to the stimulation site and lasted for up to 4 weeks after treatment stopped. In addition, pain reduction was not associated with base- line characteristics including age, pain duration, BMI, baseline BDI score, baseline anxiety score, baseline CGI score, or baseline PT (p>0.05).
Potential analgesic effects of tDCS at M1 were evident in patients with PDPN. The findings are consistent with studies that showed that anodal tDCS effectively im- proves pain in patients with other types of chronic pain syndrome, such as those from spinal cord injury, mul- tiple sclerosis, or trigeminal neuralgia [13-15,20]. The ef- fects of tDCS on the pain processing network system are poorly understood in patients with chronic neuropathic pain, and the present study provides no direct evidence to clarify these effects. In patients with chronic central pain, increased local excitability at M1 may be associated with pain control. Motor cortex stimulation has been a treatment option for patients with chronic neuropathic pain for more than 15 years [28]. Furthermore, an ani- mal study indicated that excitatory electrical stimulation over M1 may directly or indirectly modulate the activity of the thalamus and convey an inhibitory influence from the M1 [29]. Functional magnetic resonance imaging has revealed that high-frequency rTMS over M1 induces sig- nificant deactivation in remote nociceptive brain struc- tures and increases the sensory perception threshold in healthy volunteers [30]. Modulation of M1 with high- frequency rTMS or anodal tDCS has been proposed to result in the inhibition of hyperactivity in areas that un- derlie chronic pain including the medial thalamus, ante- rior cingulate cortex, and upper brain stem [31]. Further
Table 3. Comparison of anxiety, depression, and sleep quality after five sessions of tDCS
M1 vs. Sham M1 vs. DLPFC Sham vs. DLPFC
Estimated
mean (SE) p-value
a)Estimated
mean (SE) p-value
a)Estimated
mean (SE) p-value
a)Anxiety score 0.25 (0.22) >0.77 0.30 (0.23) >0.52 0.05 (0.22) >0.99 BDI score 0.05 (0.32) >0.99 -0.03 (0.32) >0.99 -0.08 (0.32) >0.99 Total sleep time -0.23 (0.18) >0.64 0.05 (0.18) >2.35 0.28 (0.18) >0.39 Awakenings
b)0.10 (0.17) >0.99 <0.01 >0.99 -0.10 (0.17) >0.99 tDCS, transcranial direct current stimulation; M1, primary motor cortex; DLPFC, dorsolateral prefrontal cortex; BDI, Beck Depression Inventory; SE, standard error.
a)