* 본 논문은 환경부 차세대에코이노베이션 환경기술개발사업(과제번호 : 416-111-013)과 국립환경과학원 국립습지 센터의 지원으로 수행된 연구의 일부입니다.
First author:Hyun-Chul Park, Department of Landscape Architecture, Kangwon National University, 1 Kangwondaehark-ro, Chuncheon-si, Gwangwon-do 24341, Republic of Korea,
Tel : +82-33-250-7319, Email : [email protected]
Corresponding author:Jung-Hwan Lee, Director, National Wetlands Center, Isan-gil Ibang-myeon, Changnyeonggun, Gyeongsangnam-do, 50303, Republic of Korea,
Tel : +82-55-530-5501, Email : [email protected]
Received:12 October, 2016. Revised:23 February, 2017. Accepted:21 February, 2017.
- 1 -
위성영상과 Maxent를 활용한 생태계교란생물 분포지역 예측 : DMZ의 단풍잎돼지풀을 대상으로*
박현철1)․임정철2)․이정환2)․이관규3)
1)강원대학교 대학원 조경학과, 2)국립습지센터, 3)(前)강원대학교 조경학과
Predicting the Potential Distributions of Invasive Species Using the Landsat Imagery and Maxent :
Focused on “ Ambrosia trifida L. var. trifida ” in Korean Demilitarized Zone*
Park Hyun-Chul1)․Lim Jeong-Cheol2)․Lee Jung-Hwan2) and Lee Gwan-Gyu3)
1)Department of Landscape Architecture, Graduate School, Kangwon National University,
2)National Wetlands Center,
3)(前)Department of Landscape Architecture, Kangwon National University.
ABSTRACT
This study has been carried out for the purpose of predicting the potential habitat sites of invasive alien plants in the DMZ and providing the basic data for decision-making in managing the future DMZ natural environment. From 2007 to 2015, this study collected the data for the advent ofAmbrosia trifida var. trifida through fieldwork around the DMZ area, and simulated the potential distribution area of Ambrosia trifida var. trifida using Maxent model among the models of species distributions. As a result, it showed that the potential distribution area of the Ambrosia trifida var. trifida was concentrated in the western DMZ with relatively low altitude and scanty in the central east regions with relatively high elevation and forest cover rate. Because the invasive alien vegetation is a significant threatening factor
2 박현철․임정철․이정환․이관규
in the agriculture and restoration of ecology and it costs a lot to restore the area already invaded by invasive alien vegetation, advance precautions are necessary to prevent biological invasions. It is ex- pected that it is possible to predict the disturbed ecosystems through this study for the efficient land use within DMZ in the future and to apply this study in setting up the areas for the development and conservation within the DMZ.
Key Words : Species distribution models, Maxent, Invasive species, Landsat 8
I.서 론
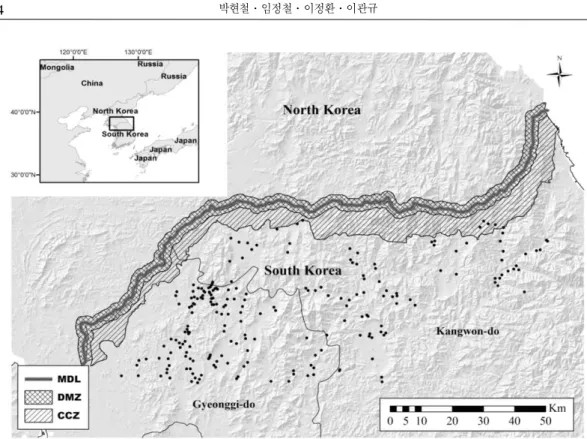
한반도는 한국전쟁으로 인해 남한과 북한으 로 분단되었으며, 군사분계선(MDL, Military Demarcation Line)을 기준으로 한 폭 4km, 연장 248km의 비무장지대(DMZ, Demilitarized Zone) 가 설정되었다(Shin, 2013). DMZ를 기준으로 남방 5∼20km 범위 내에는 민간인 통제선 (CCZ, the Civilian Control Zone)이 설정되었으 며(Figure 1), 전쟁 이후 군사적 목적 이외에는 사람의 출입이 거의 없어 사실상 원시상태의 자 연생태계가 보전되어 있다(Kim, 1997). DMZ는 생물다양성의 우수성으로 인해 보전가치가 높 은 지역이며(Jeon, 2007), 한반도 통일 이후 다 양한 활용이 예상되는 지역 중 하나이기도 하다 (Kim, 2011).
DMZ 내에서는 군사적 목적의 벌채, 제초 등 으로 인한 생태교란이 일부 발생하나 개발 행위 에 의한 서식지 축소나 단절 등은 발생하지 않 는다. D’Antonio et al.(2004)와 Forman and Alexander(1998)는 DMZ와 같이 사람의 출입의 거의 없는 지역에서 발생되는 생태교란은 생태 계교란생물과 같은 외래종 유입에 의해 주로 발 생한다고 보고한 바 있다. DMZ 생태평화공원 조성 등 향후 DMZ 생태계 보전 및 관리를 위해 서는 DMZ 지역에서의 생태계교란생물에 대한 분포현황 및 예측이 필수적이라 할 수 있다. 그 러나 민간인 출입제한과 지뢰 매설지역(Kam and Kim, 2008)으로 인해 DMZ의 현장조사는
극히 제한적으로 이루어지고 있기 때문에 현재 까지 관련 정보를 활용한 정책 및 제도의 개발 은 제한적인 실정이다.
학계에서는 DMZ와 같이 현장조사가 불가능 하거나 광범위한 지역을 대상으로 한 연구에 종 분포모형(Species distribution models, SDMs)을 주로 사용하고 있다(Elith and Leathwick, 2009).
종분포모형은 생물종의 출현위치와 서식지 환 경요소를 통계적으로 분석하여 잠재적인 서식 지를 예측할 수 있는 도구이다(Franklin, 2010).
그러나 종분포모형의 입력자료인 공간변수가 생물종의 서식지 특성을 명확히 반영하지 않을 경우 서식지 예측이 과적용(Over-fit)되며 모형 의 불확실성(Uncertainty)은 관련 연구에 걸림돌 이 되어왔다(Elith and Leathwick, 2009; Park, 2016). 이러한 한계를 극복하기 위해 다양한 종 분포모형을 결합한 앙상블모형(Ensemble mod- el)이나 원격탐사 관측자료와 종분포모형을 결 합한 SAHM(Software for Assisted Habitat Mo- deling) 등 통합모형에 관한 연구가 활발히 진행 되고 있다(Kwon, 2014; West et al., 2016).
본 연구에서는 국내 종분포 모형의 공간변수 에 일반적이며 지엽적으로 사용되는 지형요소 (해발고도, 향방향, 경사도 등)의 한계를 극복하 기 위해 원격탐사 측정 자료인 Landsat 위성영 상을 공간변수로 사용하여 DMZ 지역에서의 생 물종 서식지를 예측하고자 하였다. 본 연구의 시도는 SAHM과 같은 통합모형의 기초자료가 될 것으로 예상되며, 향후 DMZ 자연환경관리
Figure 1. The field Photos of Giant ragweed. (A): Individuals Giant ragweed (B): Black arrows, Giant ragweed flowers. It’s generates an allergy pollen. (C): Plants in the white dotted line, Giant ragweed. that form a community along the riverside.
를 위한 다양한 의사결정 방법론 연구에도 기여 할 수 있기를 기대한다.
II. 연구방법 1. 대상종 선정
본 연구는 현장 조사가 불가능한 지역의 생물 종 탐사에 관한 방법론을 제안하는 연구로 세부 적으로 원격탐사에 사용되는 Landsat 위성영상 을 종분포모형의 공간변수로 사용하였다. 따라 서 생태계교란생물 중에서 Landsat 위성영상의 공간 해상도 최소단위 이상의 면적으로 군락을 형성하는 식물을 연구 대상종으로 선정하였다.
생태계교란생물중 식물은 2016년 기준 돼지풀, 단풍잎돼지풀, 갯줄풀, 영국갯끈풀 등 14종이며, 이중 본 연구에서는 단풍잎돼지풀(Ambrosia tri- fida L. var. trifida, Giant ragweed)을 선정하였
다(Figure 1). 단풍잎돼지풀은 전국적으로 분포 하고 있으나 DMZ 인근 지역에 집중적으로 분 포하고 있고 Landsat 위성영상의 공간해상도 (900㎡) 이상의 면적에 캐노피를 형성하기 때문 에 본 연구의 대상종으로 선정하였다(Choi et al., 2007; Park et al., 2015).
단풍잎돼지풀은 북미 원산의 초본식물로 미 국 및 캐나다에 광범위하게 분포하고 있으며, 매우 빠르게 성장하여 황폐지의 선구식생을 형 성하며(Abul-Fatih and Bazzaz, 1979), 꽃가루는 아토피성 피부질환의 알러지 단백질을 포함하 고 있어 인간의 건강에도 유해하기 때문에 관리 가 필요한 외래종이기도 하다(Wopfner et al., 2005; Diekmann et al., 2013).
2. 단풍잎돼지풀 분포지역 예측
SDMs는 생물종이 분포하는 위치와 환경, 지리
4 박현철․임정철․이정환․이관규
Figure 2. Map of the DMZ and surrounding areas and occurrence point(black points) of Giant ragweed.
적 요소를 통계적으로 분석하여 잠재적인 분포지 역을 예측하며, 환경계획, 생물지리학, 보전생물 학, 생태학에서 다양한 목적으로 사용되고 있다 (Elith and Leathwick, 2009; Franklin, 2010).
SDMs는 알고리즘에 따라 다양한 종류가 있으며, 본 연구에서는 가장 대중적(Merow et al., 2013)이 며, 예측의 정확도가 높은 Maxent(Phillips and Dudík, 2008)를 사용하였다. Maximum Entropy 접근 원리는 종 분포가 알려지지 않은 지역을 적 은 수의 샘플로 통계적 근사치에 접근하도록 평 가하는 것이며(Jaynes, 1957), Maxent는 기계학습 기반으로 생물종의 출현자료와 공간변수를 이용 하여 최대 엔트로피에 접근하는 지역을 잠재 서 식처로 예측한다(Phillips et al., 2004).
Maxent에 의해 예측된 종 분포 지역은 실제 종이 분포하거나 잠재적인 분포 지역이다. 종 분 포 확률은 0∼1범위로 예측되며, 이 확률 범위에 서 종 출현 지역으로 판단할 수 있는 지역은 확률
의 임계값(Threshold value) 이상 지역이다(Bean et al., 2012; Cao et al., 2013; Kramer-Schadt et al., 2013). 단풍잎돼지풀의 잠재분포지역은 종 분포 확률에서 임계값 이상 지역을 선정하였으 며 임계값은 모형의 민감도와 특이도의 합이 최 대가 되는 확률을 기준으로 하였다(Liu et al.
2013).
3. Maxent 입력자료
Maxent 입력자료는 연구대상 생물종이 출현 한 지역의 경위도 좌표인 출현자료(Present data) 와 생물종의 서식지 특성을 반영할 수 있는 공 간변수(Spatial data)가 필요하며 각 자료의 수집 방법 및 전처리 과정은 다음과 같다.
1) 출현자료(Present data)
단풍잎돼지풀의 출현자료는 2007년부터 2015 년까지 DMZ인근지역인 경기, 강원북부 지역을
Variable Description Sources
dem A digital elevation model is a digital model of a terrain's
surface USGS(http://earthexplorer.usgs.gov/)
slope A surface of which one end or side is at a higher level than
another Derived from dem using Qgis
Band 2 Bathymetric mapping, distinguishing soil from vegetation and
deciduous from coniferous vegetation The landsat 8 OLI/TIRS data obtained from the website http://earthexplorer.usgs.gov
Entity ID:
LC81160332015265LNG00(Path:116 , Row:33,34 Acquisition data:
22.Sep.2015)
LC81150342015258LGN00(Path:115 , Row:33, 34, Acquisition data:
15.Sep.2015) Cell resolution : 900 ㎡ Band 3 Emphasizes peak vegetation, which is useful for assessing
plant vigor
Band 4 Discriminates vegetation slopes
Band 5 Emphasizes biomass content and shorelines
Band 6 Discriminates moisture content of soil and vegetation;
penetrates thin clouds
Band 7 Improved moisture content of soil and vegetation and thin cloud penetration
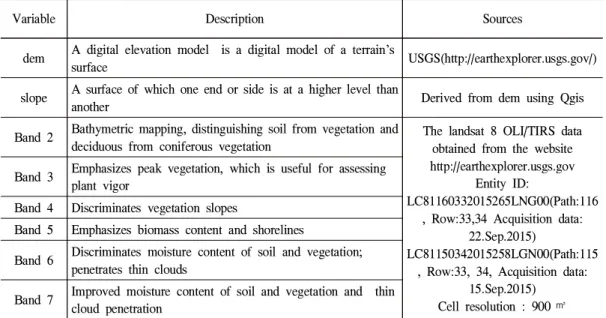
Table 1. Spatial input variables for potential invasive distributions of giant ragweed.
대상으로 현지조사를 통해 수집하였다. 단풍잎 돼지풀 출현지역의 경위도 좌표를 GPS에 POI (Point of Interest)로 기록하고 누적된 POI를 Esri 의 ArcGIS(ver. 10.1)을 이용하여 shp형태로 변환 하였다. 현장에서 기록한 POI는 특정 지역에 몰 려있거나 중복될 가능성이 있다. 이런 경우 공간 적 자기상관(Spatially autocorrelated occurrence points)으로 종분포 확률이 왜곡될 수 있다 (Warren and Seifert, 2011; Naimi et al., 2011).
따라서 표본편향(Sampling bias)에 의한 공간적 자기상관을 제거하기 위해 공간변수의 1개 Cell 에 1개의 출현자료만 입력되도록 전처리하였다.
출현자료의 전처리는 SDMtoolbox(Brown, 2014) 를 사용하였다.
2) 공간변수(Spatial variable)
본 연구에서 사용한 공간변수는 해발고도, 경 사 등의 지형과 원격탐사에 사용되는 Landsat 8 OLI/TIRS의 위성영상이다. 해발고도 데이터와 Landsat 위성영상는 USGS의 EarthExplore(http:
//earthexplorer.usgs.gov/)에서 다운로드 하였고, 경사는 DEM을 분석하여 분석하였다. 단풍잎돼
지풀은 대부분 군락을 형성하므로 위성영상 중 에서 식생과 관련된 band 2, 3, 4, 5, 6, 7을 변수로 사용하였다(Everitt and Deloach, 1990; Lass et al., 1996; Lass and Callihan, 1997; Evangelista et al., 2009). Landsat 위성영상은 DMZ와 출현자 료를 수집한 지역이 포함된 2개의 scenes을 활용 하였으며, 촬영일은 단풍잎돼지풀이 주변 식생 과 구분되는 개화기에 해당하는 9월에 촬영한 영 상을 사용하였다. 위성영상 scenes의 세부 속성 및 영상 위치를 나타내는 Entity ID는 Table. 1과 같다.
3) 모형 정확도 검증
Maxent는 회귀분석 기반이므로 공간변수의 기여도를 평가할 수 있다. 공간변수 기여도 (Percent contribution)란 모형이 실측자료를 이 용한 학습과정 중, 각 공간변수가 종 분포확률 의 최적 결과 도출에 기여하는 정도를 의미하 며, 모형 알고리즘에 따라 달라질 수 있는 변수 간의 상대적인 기여도를 말한다(Phillips et al., 2004).
Maxent는 제한된 공간변수를 이용한 확률모
6 박현철․임정철․이정환․이관규
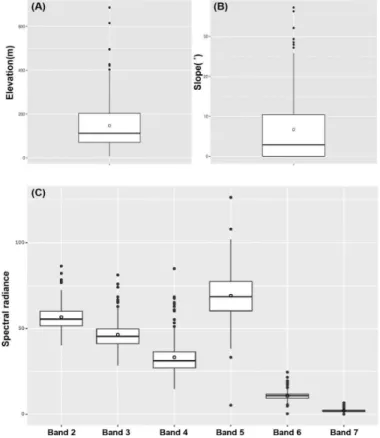
Figure 3. Box plots displaying the median, inter quartile range, maximum and minimum values of spatial input variables.
형이기 때문에 모형의 정확성을 진단하여 연구 에 활용 여부를 결정할 필요가 있다. 본 연구의 모형 정확도는 ROC(Receiver Operating Charac- teristic)의 AUC(Area Under Curve)로 측정하였 다(Swets, 1988). ROC의 AUC는 모형 결과의 효율성을 판단하는 방법으로 보편적으로 사용 되며, 일반적으로 AUC가 1일 경우 모형은 완벽 하며, 0.7이상이면 모형이 예측한 결과가 적절 하다고 판단한다(Phillips and Dudík, 2008). 또 한, Maxent는 기계학습에 필요한 샘플을 훈련 자료(training data)와 테스트 자료(test data)만을 이용한다. 학습에 필요한 샘플이 많다면 모형의 정확도를 높이는 데 유리하겠지만, 현실적으로 샘플이 무한적으로 제공될 수 없다. 따라서 모 형의 통계적 신뢰도를 높이기 위해 재샘플링
(resamplig) 방법인 10회 교차 검증(10-fold cross validation)을 실시하였다(Merow et al., 2013).
III. 결과 및 고찰 1. 단풍잎돼지풀 출현 지역의 환경특성
현지조사 결과, 단풍잎돼지풀 출현 지역의 최 고 해발고도는 686m이며 평균 해발고도는 147.2m로 나타났다(Figure 3의 A). 경사는 0∼
37.2° 범위에 분포하였고 평균 6.6°의 비교적 평 지에 분포하였다(Figure 3의 B).
Landsat band 값은 16-bit unsigned integer format이기 때문에 Multispectral image 분석을 위해서는 Top Of Atmosphere (TOA) Radiance (units=Watts/(m2×srad×μm))으로 변환해야 한다
Variable % contribution
DEM 23.3
Slope 0.7
Band 2 13.1
Band 3 10.2
Band 4 40.7
Band 5 2.1
Band 6 5.4
Band 7 4.5
Table 3. Modeling content for potential distribution ofAmbrosia trifida L.
AUC Threshold value Potential distribution area(㎢)
0.854 0.35 93.69
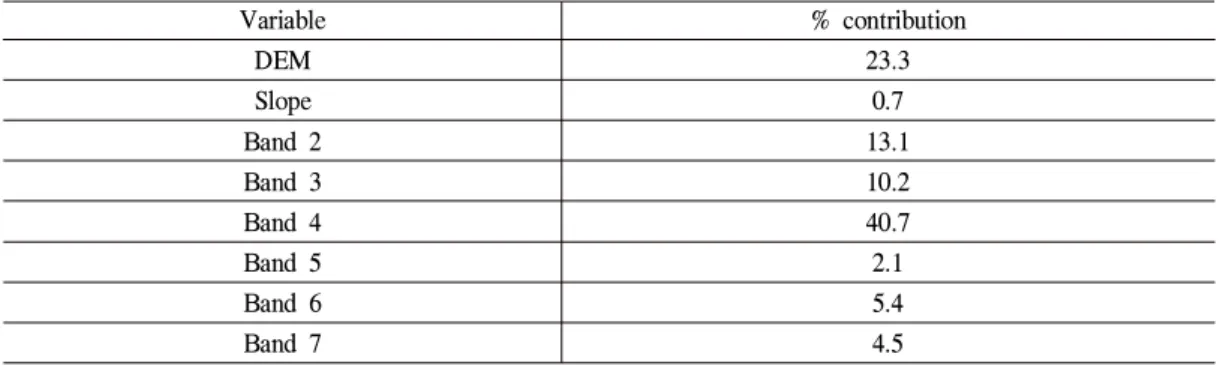
Table 2. Estimates of percent contributions of the spatial variables to the Maxent model
(USGS, 2015). 단풍잎돼지풀 출현 지역의 band 2 Radiance는 40.2∼86.4(평균 56.6), band 3은 28.5∼81.2(평균 46.4), band 4는 14.8∼84.9(평 균 33.2), band 5는 5.2∼126.5(평균 69.1), band 6은 0.3∼24.5(평균 10.7), band7은 0.06∼6.65 (평균 2.09)로 분석되었다(Figure 3의 C).
2. 잠재 분포지 모형분석
DMZ 내 단풍잎돼지풀 잠재 분포 예측에 사 용된 공간변수는 총 8개 이며, 이중 단풍잎돼지 풀 잠재 분포 예측에 기여도가 가장 높은 변수 는 band 4로 확인되었으며 기여도는 40.7로 나 타났다. 지형 변수에서는 해발고도의 기여도가 23.3으로 가장 높았으며, 경사의 기여도는 0.7로 분석되었다(Table 2).
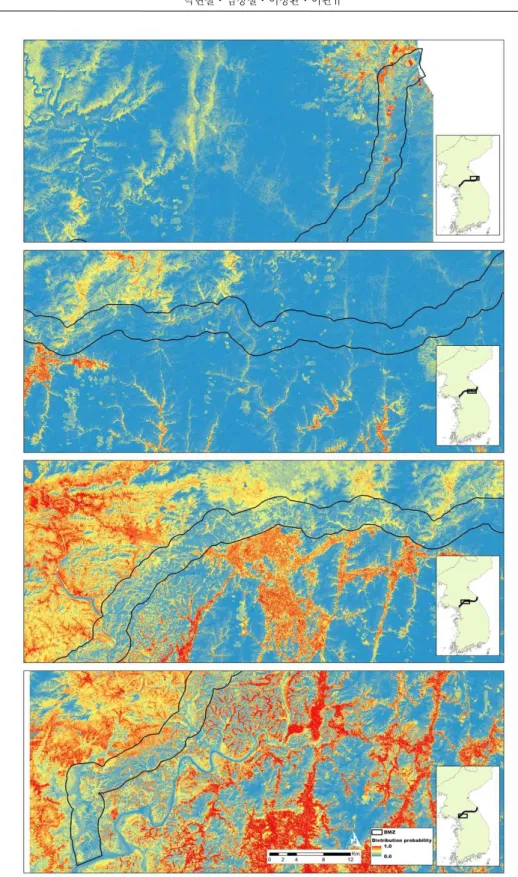
모형의 AUC는 0.854로 우수한 정확도를 나 타내었다. 연구대상지의 단풍잎돼지풀 분포 확 률은 0∼0.89이며(Figure 4), 잠재 분포 지역으 로 선정 가능한 임계값은 0.35이다(Table 3). 임 계값에 의해 구분된 단풍잎돼지풀의 잠재 분포 면적은 93.6km2이다. DMZ전체 면적이 약 903.3km2이므로 DMZ의 약 10.3%가 단풍잎돼 지풀의 잠재적인 분포 지역이다. 단풍잎돼지풀 의 잠재 분포 지역은 비교적 해발고도가 낮은
DMZ 서부지역에 집중되어 있으며, 해발고도가 상대적으로 높고 숲의 피복율이 높은 중동부 지 역에서의 잠재 분포 지역은 빈약한 것으로 예측 되었다(Figure 4.).
3. 고 찰
최근 무인항공기(Unmanned aerial vehicle) 기 술의 발달로 국지적인 고해상도 항공영상 및 다 양한 센서를 활용한 결과물의 수집이 용이해졌 다. 본 연구와 같이 종 분포 예측과 관련된 연구 에 무인항공기 영상을 활용하면 보다 정밀한 결 과 예측이 가능하다. 그러나 Landsat 위성영상 이나 무인항공기 영상을 활용한 연구는 캐노피 를 형성하는 식생에만 적용 가능하다는 한계점 이 있다. 즉, 캐노피 하부에 형성된 식생 또는 군집을 형성하지 못하고 산발적으로 분포하는 식생의 경우에는 상기 기술한 방법론의 적용이 불가능하다.
Landsat 위성영상을 Maxent의 공간변수로 사 용할 경우 군락의 크기가 위성영상의 공간해상 도 이상이거나, 연구대상 식생이 주변 식생과 확연히 구분 되어야 사용 가능하다(Peterson, 2005). 또한 종분포모형의 공간변수는 변수 간 상관관계에 의한 다중공선성(Multicollinearity)
8 박현철․임정철․이정환․이관규
Figure 4. Predicted potential distribution of Giant ragweed
에 의해 예측의 왜곡이 발생할 수 있다(Park, 2016). 예를 들어 종분포모형을 활용한 기후변 화 연구에서는 변수 간 상관분석 또는 PCA분석 을 통해 최적의 변수를 선정하고 있다(Watling et al., 2012; Guo et al., 2013; Khanum et al., 2013). 반면, Landsat 위성영상은 식생활력 (Vegetation vigor)을 측정한 것으로 각 band의 독립성을 고려하여야 한다. landsat 위성영상과
종분포모형을 활용한 해외의 기존연구
(Evangelista et al., 2009; Lahoz-Monfort et al., 2010)의 경우 연구대상종의 분포에 관여하는 band를 조합하여 변수를 생성하기도 하였으나 국내에는 정규식생지수(NDVI)외에 특정 식생 을 탐색하기 위한 연구가 미미한 실정이다. 향 후 특정식생의 최적 단일 식생지수 산출에 관한 연구가 시행된다면 식물 개화 등의 생물계절 모 니터링, 캐노피 하부 식생의 분포 예측 등 다양 한 모의가 가능할 것으로 판단된다.
IV. 결 론
본 연구는 DMZ의 단풍잎돼지풀 분포지역을 예측하기 위해 원격탐사에 사용되는 Landsat 위 성영상을 Maxent의 공간변수로 사용하였으며 미래 DMZ 자연환경 관리에 필요한 의사결정 기초자료 제공을 목적으로 진행되었다. 주요 연 구결과는 다음과 같다.
1) 본 연구에서 강조한 것은 Maxent의 공간변수 로 위성영상을 활용한 것이며 모형의 정확도 (AUC)가 0.854로 정확도는 우수한 것으로 판단된다.
2) 모형 결과에 의하면 단풍잎돼지풀의 잠재 분 포 지역은 DMZ 서부지역에 집중되어 있으 며, 해발고도와 숲의 피복율이 비교적 높은 중동부 지역에서의 출현 확률은 상대적으로 낮았다. 이는 기존 연구결과(Park et al., 2015)에 부합하는 것으로 단풍잎돼지풀은 산
림내부에 분포하지 않고 초지 등의 오픈스페 이스가 주 서식처임을 시사한다. 따라서 단 풍잎돼지풀은 산림보다 도시팽창에 의한 개 발압력 지역, 군사 목적에 의한 벌채지역 등 이 잠재적인 분포지로 예상되기 때문에 향후 DMZ 생태계 관리를 위한 기초 배경으로 활 용할 수 있을 것이다.
3) 기존 종분포모형 연구의 공간변수는 해발고 도, 경사, 향방향 등의 지형에 관련된 변수를 주로 활용했다면, 본 연구는 식생분포를 반 영하는 Landsat 위성영상을 공간변수로 활용 하는 새로운 방법론을 제시하였다. 이는 인 간의 접근이 제한된 지역의 종분포 예측에 광범위하게 활용될 수 있다.
생태계교란생물은 기존 생태계 내에서 서식 처, 종다양성 감소의 주요한 원인이며, 최근 생 태계교란생물의 침입은 증가하는 추세이다 (Wil- cove et al., 1998; CBD, 2008; IUCN, 2011). 생태계교란생물은 농업 및 자연생태계의 상당한 위협 요인이며, 생태계교란생물이 침입 한 지역을 복원하기 위해서는 많이 비용이 소요 되기 때문에 침입 예방을 위한 사전 대책이 필 요하다. 본 연구를 통해 미래 DMZ의 효율적인 토지이용을 위한 생태계교란생물의 잠재 서식 지를 예측할 수 있었으며, DMZ의 개발 및 보전 지역 설정을 위한 연구에 응용할 수 있을 것으 로 기대된다. 또한 국내 생태계교란생물은 단풍 잎돼지풀 등 식물 외에 포유류, 곤충, 어류 등 다양한 생물군이 지정되어 있다. 따라서 전체 생태계교란생물의 잠재 분포지역 예측을 통한 취약지역 평가가 시행된다면 DMZ의 통합적 생 태계관리를 위한 정책적 의사 결정 도구로 유용 하게 사용될 것이다.
References
Abul-Fatih HA and Bazzaz FA. 1979. The
10 박현철․임정철․이정환․이관규
Biology Of Ambrosia Trifida L.. I. Influence Of Species Removal On The Organization Of The Plant Community. New Phytol 83:
813-816.
Bean WT․Stafford R and Brashares JS. 2012.
The effects of small sample size and sam- ple bias on threshold selection and accuracy assessment of species distribution models.
Ecography 35: 250-258.
Brown JL. 2014. SDMtoolbox: a python-based GIS toolkit for landscape genetic, biogeo- graphic and species distribution model analyses. Methods in Ecology and Evolu- tion. 5(7): 694-700.
Cao Y․DeWalt RE․Robinson JL․Tweddale T․Hinz L and Pessino M. 2013. Using Maxent to model the historic distributions of stonefly species in Illinois streams: The effects of regularization and threshold se- lections. Ecol Model 259: 30-39.
CBD. 2008. CBD-Convention on Biological Diversity. Alien Species that Threaten Ecosystems, Habitats or Species [Article 8(h)]. United Nations.
Choi HJ․Lim SH․Kim KH and Kim S. 2007.
Distribution of Giant Ragweed(Ambrosia trifida L.) at Northwest of Gangwon, Korea. Korean J Weed Sci 27: 241-247.
D’Antonio CM․Jackson NE · Horvitz CC and Hedberg R. 2004. Invasive plants in wild- land ecosystems: merging the study of in- vasion processes with management needs.
Front Ecol Environ 2: 513-521.
Diekmann F․Ford RA · Harrison SK · Regnier EE and Venkatesh R. 2013. Bibliometric Analysis of the Literature on Giant Ragweed (Ambrosia trifida L.). J Agric Food Inf 14: 290-320.
Elith J and Leathwick JR. 2009. Species dis- tribution models: ecological explanation and prediction across space and time. Annu Rev Ecol Evol Syst 40: 677.
Evangelista PH․Stohlgren TJ․Morisette JT and Kumar S. 2009. Mapping invasive tamarisk (Tamarix): a comparison of single-scene and time-series analyses of remotely sensed data.
Remote Sensing. 1(3): 519-533.
Everitt JH and Deloach CJ. 1990. Remote sensing of Chinese tamarisk (Tamarix chinensis) and associated vegetation. Weed Sci: 273-278.
Forman RTT and Alexander LE. 1998. Roads and Their Major Ecological Effects. Annu Rev Ecol Syst 29: 207.
Franklin J. 2010. Mapping species distributions:
spatial inference and prediction. Cambridge University Press.
Guo WY · Lambertini C · Li XZ · Meyerson LA and Brix H. 2013. Invasion of Old World Phragmites australis in the New World: precipitation and temperature pat- terns combined with human influences re- design the invasive niche. Global Change Biology. 19(11): 3406-3422.
IUCN. 2011. IUCN-International Union for Con- servation of Nature. Invasive Species.
Jaynes ET. 1957. Information theory and stat- istical mechanics. Phys Rev 106: 620.
Jeon SW. 2007. Policies on Conservation of the DMZ District Ecosystem. Environ Policy Bull 5.
Kam K and Kim K. 2008. Detection of buried objects using ultra-wideband radar: Newly launched mine detection project in South Korea. Pages 695308-695308 in SPIE Defense and Security Symposium. Interna- tional Society for Optics and Photonics.
Kim JH. 2011. DMZ Control and Utilities for the Preparation of a Basis for Peaceful Unification. The Journal of Northeast Asia Research. 26(2): 31-49.
Kim KC. 1997. Preserving Biodiversity in Korea’s Demilitarized Zone. Science 278:
242-243.
Khanum R․Mumtaz AS and Kumar S. 2013.
Predicting impacts of climate change on me- dicinal asclepiads of Pakistan using Maxent modeling. Acta Oecologica. 49: 23-31.
Kramer-Schadt S․Niedballa J․Pilgrim JD․
Schröder B․Lindenborn J․Reinfelder V․Stillfried M, Heckmann I․Scharf AK
․Augeri DM and others. 2013. The im- portance of correcting for sampling bias in Maxent species distribution models. Divers Distrib 19: 1366-1379.
Kwon HS. 2014. Applying Ensemble Model for Identifying Uncertainty in the Species Dis- tribution Models. Journal of Korean Society for Geospatial Information System. 22(4):
47-52 (In Korean).
Lahoz-Monfort JJ․Guillera‐Arroita G․Milner Gulland EJ․Young RP and Nicholson E.
2010. Satellite imagery as a single source of predictor variables for habitat suitability mod- elling: how Landsat can inform the con- servation of a critically endangered lemur.
Journal of Applied Ecology. 47(5): 1094- 1102.
Lass LW and Callihan RH. 1997. The effect of phenological stage on detectability of yel- low hawkweed (Hieracium pratense) and oxeye daisy (Chrysanthemum leucanthe- mum) with remote multispectral digital imagery. Weed Technol: 248-256.
Lass LW․Carson HW and Callihan RH. 1996.
Detection of yellow starthistle (Centaurea solstitialis) and common St. Johnswort (Hypericum perforatum) with multispectral digital imagery. Weed Technol: 466-474.
Liu C․White M and Newell G. 2013. Selecting thresholds for the prediction of species occur- rence with presence-only data. J Biogeogr 40:
778-789.
Merow C․Smith MJ and Silander JA. 2013. A practical guide to Maxent for modeling spe- cies’ distributions: what it does, and why inputs and settings matter. Ecography 36:
1058-1069.
Naimi B․Skidmore AK · Groen TA and Hamm NA. 2011. Spatial autocorrelation in pre- dictors reduces the impact of positional un- certainty in occurrence data on species dis- tribution modelling. Journal of Biogeography 38(8): 1497-1509.
Park HC․Lee GG and Lee JH. 2015. Regional vulnerability assessment of invasive alien plants in Seoul and Gyeonggi Province. J.
Korean Env. Res. Tech. 18(6): 1-13 (In Korean).
Park HC. 2016. Development and application of climate change sensitivity assessment meth- od for plants using the species distribution models. Ph.D. dissertation. Kanwon National University (In Korean).
Peterson EB. 2005. Estimating cover of an in- vasive grass (Bromus tectorum) using tobit regression and phenology derived from two dates of Landsat ETM+ data. International Journal of Remote Sensing. 26(12): 2491- 2507.
Phillips SJ and Dudík M. 2008. Modeling of species distributions with Maxent: new ex- tensions and a comprehensive evaluation.
12 박현철․임정철․이정환․이관규
Ecography. 31: 161-175.
Phillips SJ․Dudík M and Schapire RE. 2004. A maximum entropy approach to species dis- tribution modeling. Page 83in Proceedings of the twenty-first international conference on Machine learning. ACM.
Shin D. 2013. The potential impact of a bota- nical garden in the Korean Demilitarized Zone. Thesis. Master’s Theses, University of Delaware.
Swets JA. 1988. Measuring the accuracy of diag- nostic systems. Science 240: 1285-1293.
Watling JI․Romañach SS․Bucklin DN․ Speroterra C․Brandt LA․Pearlstine LG and Mazzotti FJ. 2012. Do bioclimate vari- ables improve performance of climate enve- lope models? Ecological Modelling. 246:
79-85.
Warren DL and Seifert SN. 2011. Ecological ni- che modeling in Maxent: the importance of
model complexity and the performance of model selection criteria. Ecological Appli- cations 21(2): 335-342.
West AM․Evangelista PH․Jarnevich CS․
Young NE․Stohlgren TJ․Talbert C and Anderson R. 2016 Integrating Remote Sensing with Species Distribution Models;
Mapping Tamarisk Invasions Using the Software for Assisted Habitat Modeling (SAHM). Journal of Visualized Experi- ments: JoVE. (116).
Wilcove DS․Rothstein D․Dubow J․Phillips A and E. 1998. Quantifying threats to im- periled species in the United States. Bio- Science. 48(8): 607-615.
Wopfner N․Gadermaier G․Egger M․Asero R․Ebner C․Jahn-Schmid B and Ferreira F. 2005. The Spectrum of Allergens in Ragweed and Mugwort Pollen. Int Arch Allergy Immunol 138: 337-346.