INTRODUCTION
MELAS (mitochondrial myopathy, encephalopathy, lactic acidosis, and a stroke-like episode) is a mitochondrial disorder that is characterized by delayed growth, episodic vomiting, seizures, muscle weakness, and recurrent cerebral
injuries that resemble strokes. Although the neurological defi cits in MELAS resemble features of ischemic stroke and multifocal cerebral infarct-like lesions are seen on the CT and MR images, they differ with a vascular stroke; MELAS lesions do not follow vascular territories or a border zone and the cerebral angiography fails to demonstrate any steno-occlusive lesion. Therefore, we can assume that the underlying mechanism of MELAS is different from that of an ischemic infarction (1). The main hypothesis explaining the pathophysiology of the infarct-like lesions of MELAS syndrome is angiopathy leading to ischemia (2) and the energy failure from defective oxidative metabolic pathways of energy production or the increased energy demand due to neuronal hyperexcitability (3).
Diffusion-weighted MR imaging (DWI) is expected to determine the nature of the edema during the acute stage
Diffusion and Perfusion Characteristics of MELAS (Mitochondrial Myopathy, Encephalopathy, Lactic
Acidosis, and Stroke-Like Episode) in Thirteen Patients
Ji Hye Kim, MD
1, Myung Kwan Lim, MD
2, Tae Yeon Jeon, MD
1, Jung Ho Rha, MD
3, Hong Eo, MD
1, So-Young Yoo, MD
1, Chang Hae Shu, MD
21Department of Radiology and Center for Imaging Science, Samsung Medical Center, Sungkyunkwan University, School of Medicine, Seoul 135-710, Korea; Departments of 2Radiology and 3Neurology, Inha University Hospital, Incheon 400-103, Korea
pISSN 1229-6929 · eISSN 2005-8330
Objective: We analyzed the diffusion and perfusion characteristics of acute MELAS (mitochondrial myopathy, encephalopathy, lactic acidosis, and stroke-like episode) lesions in a large series to investigate the controversial changes of the apparent diffusion coeffi cient (ADC) that were reported in prior studies.
Materials and Methods: We analyzed 44 newly appearing lesions during 28 stroke-like episodes in 13 patients with MELAS.
We performed a visual assessment of the MR images including the ADC and perfusion maps, comparison of the ADC between the normal and abnormal areas, comparison of % ADC between the 44 MELAS lesions and the 30 acute ischemic infarcts. In addition, the patterns of evolution on follow-up MR images were analyzed.
Results: Decreased, increased, and normal ADCs were noted in 16 (36%), 16 (36%), and 12 (27%) lesions, respectively.
The mean % ADC was 102 ± 40.9% in the MELAS and 64 ± 17.8% in the acute vascular infarcts (p < 0.001), while perfusion imaging demonstrated hyper-perfusion in six acute MELAS lesions. On follow-up images, resolution, progression, and tissue loss were noted in 10, 4, and 17 lesions, respectively.
Conclusion: The cytotoxic edema gradually evolves following an acute stroke-like episode in patients with MELAS, and this may overlap with hyper-perfusion and vasogenic edema. The edematous swelling may be reversible or it may evolve to encephalomalacia, suggesting irreversible damage.
Index terms: Mitochondrial encephalopathy; Diffusion weighted imaging; Perfusion MR imaging; Stroke
Received August 2, 2010; accepted after revision October 5, 2010.
This work was supported by INHA UNIVERSITY Research Grant.
Corresponding author: Myung Kwan Lim, MD, Department of Radiology, Inha University Hospital, 7-206, 3rd St, Shinheung- dong, Choong-gu, Incheon 400-103, Korea.
• Tel: (8232) 890-2769 • Fax: (8232) 890-2743
• E-mail: [email protected]
This is an Open Access article distributed under the terms of the Creative Commons Attribution Non-Commercial License (http://creativecommons.org/licenses/by-nc/3.0) which permits unrestricted non-commercial use, distribution, and reproduction in any medium, provided the original work is properly cited.
Korean J Radiol 2011;12(1):15-24
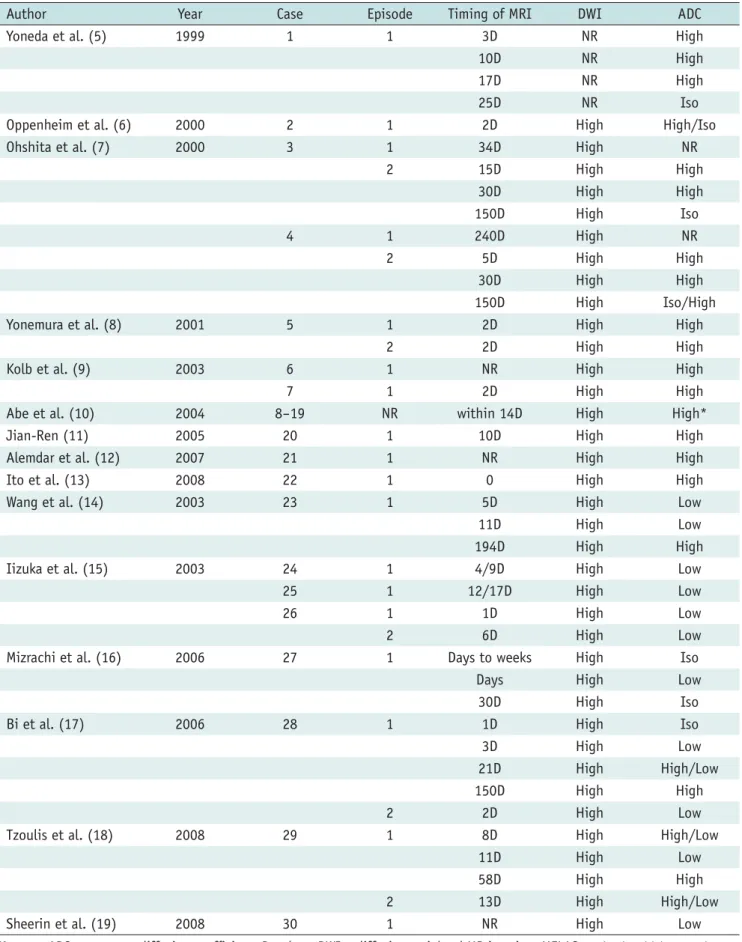
of a stroke-like episode as to whether it is vasogenic or cytotoxic in origin (4). There are confl icting reports regarding the diffusion characteristics of the infarct-like lesions of MELAS. Several reports (5-13) have described a normal or increased apparent diffusion coeffi cient (ADC), indicating the presence of vasogenic edema. These studies even suggested an increased ADC as a differential point from the cytotoxic edema of an ischemic origin. On the other hand, other studies (14-19) have described that ADC declines during an acute episode, suggesting the presence of cytotoxic edema even though the proposed pathophysiology was different from that of an ischemic stroke.
Because MELAS is a rare metabolic disorder, the majority of the previous studies have described only a small number of cases or the ADC description was not adequate. Therefore, a comprehensive analysis of the diffusion characteristics of acute MELAS lesions linked with a perfusion study in a large number of patients is necessary for a better understanding of the nature of edema in patients with MELAS, which might be different from that of acute ischemic stroke.
We analyzed serial MR images, including DWI and perfusion images in 13 MELAS patients, with a particular emphasis on the changes of the ADC as compared with that of ischemic stroke, to investigate the controversy concerning the nature of the edematous lesions seen during acute episodes of MELAS.
MATERIALS AND METHODS
Our Institutional Review Board approved this retrospective study and informed consent was waived.
Subjects
We evaluated 13 patients with MELAS syndrome confi rmed by gene analysis, which demonstrated the presence of a point mutation in the mitochondrial DNA (3243A>G).
The subjects included fi ve male and eight female patients ranging in age between 10 and 57 years (mean age: 32 years). The presenting symptoms included gaze deviation, mental state changes, tremors, seizures, motor weakness, aphasia, sensory change, and visual or hearing disturbance.
We reviewed a total of 43 sets of MR images and medical records over a 13 year period and we identifi ed 48 acute brain lesions which appeared during 31 stroke-like episodes.
Among them, four lesions that developed after three stroke-like events were excluded from the analysis since
the corresponding DWI was not obtained. Ultimately, a total of 44 lesions that occurred over 28 stroke-like events were analyzed. The time interval between the acute onset of symptoms and the MRI scan ranged from 0-18 days (mean: 4.2 ± 3.6 days). Details of the individual lesions are summarized in Table 1. Perfusion MR imaging was performed in three patients (patients 5, 10, and 11) during fi ve episodes and in one institution. The interval between symptom onset and perfusion imaging ranged between 0-3 days (mean: 0.8 ± 1.3 days).
Image Acquisition
The MRI examinations, including DWI, were subjected to 1.5- or 3.0-Tesla MRI units (Siemens, Erlangen, Germany/
General Electric Medical Systems, Milwaukee, WI/Philips Medical Systems, Best, The Netherlands) in 13 patients from three institutions. A quadrature head coil was used as a receiver and transducer. The spin-echo T1-weighted axial and sagittal images, the fast spin-echo T2-weighted axial images and the fast fl uid attenuated inversion recovery (FLAIR) axial images were obtained following the acquisition of diffusion-weighted axial images. A DWI was performed using a multi-slice, single shot, echo planar, spin echo pulse sequence. Two or three sets of images with different b-values (0, 500, and 1000 sec/mm2) were acquired and the ADC maps were created with the obtained signal.
Perfusion imaging was performed using an EPI spin-echo sequence (repetition time 2000 msec, echo time 60 msec), which targeted the central region of infarct-like lesions.
Seven axial slices (slice thickness, 5 mm; interslice gap, 2 mm; fi eld of view 260 mm; matrix size 128 x 128) were acquired. The positions of the slices were selected to match the acute lesions on DWI. Ten slices were imaged 50 times per 2 second, with a total imaging time of 1 minute and 40 seconds. Four sets of baseline images were collected before gadopentetate dimeglumine (0.2 mmol/kg) was injected at a speed of 3 mL/s using a MRI-compatible power injector.
The signal intensity-time curves were obtained from the area of acute lesion and the contralateral unaffected area.
In addition, the maps for regional cerebral blood fl ow (CBF), cerebral blood volume (CBV), time to peak enhancement, and mean transit time were generated.
Image Analysis
Visual assessment of the cortical and white matter involvement in conventional MR images and the signal
changes on DWI, ADC, and the perfusion maps, were performed for each new edematous lesion by two radiologists (with 15 years and 16 years of neuroimaging interpretation experience, respectively) in consensus.
To quantify the changes of ADCs independent of the tissue, three regions of interest (ROIs) were positioned in each of the affected areas and in the control regions in the contralateral hemisphere (Fig. 1D). In addition, the mean ADC of the lesions and the control area were compared using paired t-tests. The size of the ROIs positioned at the lesion and control area were the similar, ranging from 5-15 mm2 according to the size of the involved area. The ROI measurement was performed by one radiologist who did not participate in the visual assessment. In the cases with bilateral lesions, the corresponding gray or white matter of the normal appearing parenchyma was selected as a control.
In addition, the % ADC ([the mean ADC in the infarct-
like lesion/the mean ADC in the control area] x 100) was calculated for each lesion. To compare the decline of the ADC between the MELAS lesions and the ischemic infarct, we selected 30 acute vascular infarcts that were detected on the MR images obtained from 0 to 18 days after a stroke (mean: 2.2 ± 4.2 days) in 25 patients, and their mean % ADCs were compared with those of the MELAS lesions by way of independent t-tests. In addition, scatterplots of the
% ADC values versus time were drawn up to evaluate all the lesions in the patients with MELAS and ischemic stroke.
The changes of each newly identifi ed acute lesion seen on the follow-up MR images were reviewed and we evaluated whether there was any signifi cant difference in the patterns of evolution between the lesions with a decreased ADC and the lesions with a normal or increased ADC by performing the Fisher’s exact test.
Statistical analyses were performed with the SPSS
A B
D E
C
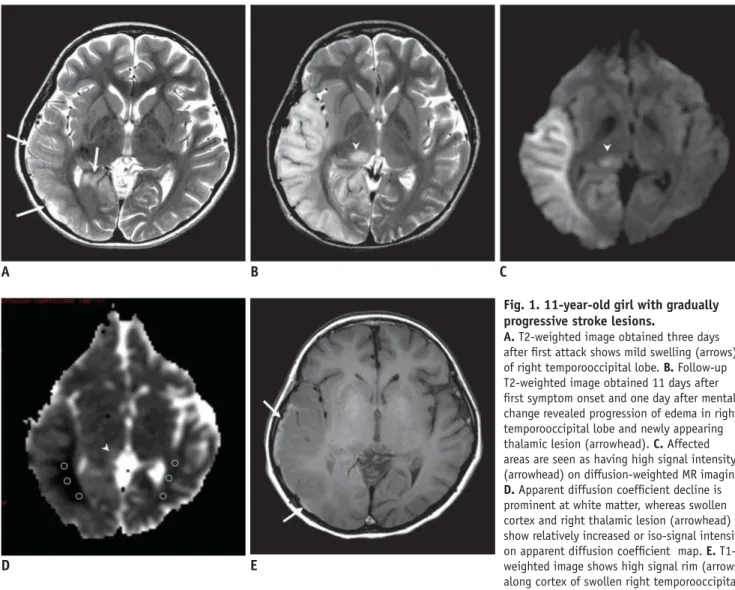
Fig. 1. 11-year-old girl with gradually progressive stroke lesions.
A. T2-weighted image obtained three days after fi rst attack shows mild swelling (arrows) of right temporooccipital lobe. B. Follow-up T2-weighted image obtained 11 days after fi rst symptom onset and one day after mental change revealed progression of edema in right temporooccipital lobe and newly appearing thalamic lesion (arrowhead). C. Affected areas are seen as having high signal intensity (arrowhead) on diffusion-weighted MR imaging.
D. Apparent diffusion coeffi cient decline is prominent at white matter, whereas swollen cortex and right thalamic lesion (arrowhead) show relatively increased or iso-signal intensity on apparent diffusion coeffi cient map. E. T1- weighted image shows high signal rim (arrows) along cortex of swollen right temporooccipital lobe, suggesting cortical laminar necrosis.
software (SPSS, version 17.0; Chicago, IL) and all of the statistical evaluations were considered signifi cant for p values less than 0.05.
RESULTS
Visual Assessment
The newly affected lesions appeared as infarct-like gyral swelling (Figs. 1-3) in all the hemispheric lesions (n = 40) except in the case of a small separated white matter lesion and adjacent white matter involvement in 24 of the 40 (60%) cortical lesions. The three remaining lesions were noted in the thalamus (n = 2) and putamen (n = 1).
Diffusion weighted MR imaging revealed the presence of hyperintense edema in 37 lesions (84%, Figs. 1C, 2D) and iso-signal intensity in seven lesions (16%). The ADC maps revealed a dark area within the infarct-like lesion in 16 (36%, Figs. 1D, 3C) lesions and a bright area in 16 (36%) lesions (Fig. 2E). The remaining 12 (27%) lesions exhibited iso-signal intensity compared to the control area. The MRI fi ndings, including the diffusion characteristics of each lesion, are summarized in Table 1.
A total of 11 lesions were identifi ed on perfusion images obtained during fi ve episodes in three patients. Perfusion imaging demonstrated increased CBF (Figs. 2B, 3D, 3E) and CBV in six newly appearing lesions, and this suggested a hyper-perfused state regardless of the ADC fi ndings (the
ADC was increased in four, decreased in one, and not changed in one), while the fi ve chronic lesions exhibited decreased perfusion (Fig. 3E).
Quantitative Analysis
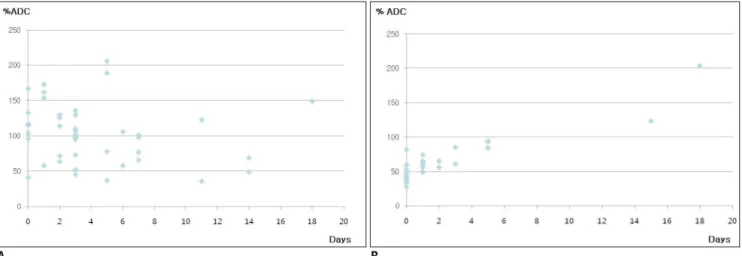
The mean ADC in the acutely affected areas and the normal control regions were 0.733 ± 0.32 and 0.758 ± 0.16 x 103 mm2/s, respectively (p = 0.596). Each mean % ADC at the lesions exhibiting different signal intensities on DWI and ADC map are summarized in Table 2. The mean % ADC was 103 ± 41.2% in the acute lesions of MELAS, compared to 65 ± 33.3% in the acute vascular infarct (p < 0.001). The distribution of the % ADC according to the elapsed time since the onset of acute symptoms in the MELAS lesions (Fig.
4A) showed a random distribution, below or above 100%, with the majority being more than 50% until the 18th day after the onset of acute symptoms. However, many of the
% ADCs in the vascular infarcts were less than 50% at the stroke onset and then gradually increased to remain less than 100% until the 5th day (Fig. 4B).
Evolution of the Lesions
The follow-up MR images were available for 31 of the 44 lesions (70%) and the total follow-up period ranged between eight days and 67 months (mean: 11 ± 16 months). On the follow-up MR images, complete resolution or regression with a small area of altered signal intensity
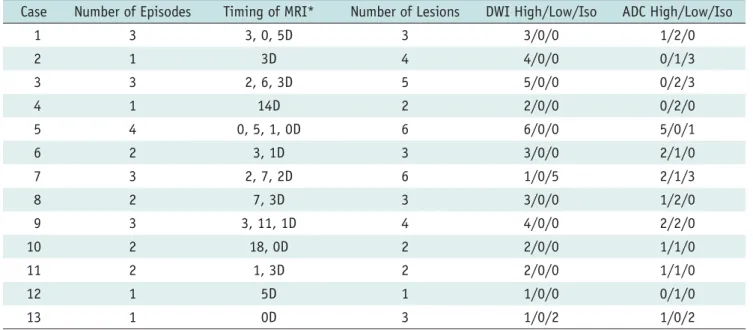
Table 1. Summary of the MRI Findings in 44 Acute Edematous Lesions
Case Number of Episodes Timing of MRI* Number of Lesions DWI High/Low/Iso ADC High/Low/Iso
1 3 3, 0, 5D 3 3/0/0 1/2/0
2 1 3D 4 4/0/0 0/1/3
3 3 2, 6, 3D 5 5/0/0 0/2/3
4 1 14D 2 2/0/0 0/2/0
5 4 0, 5, 1, 0D 6 6/0/0 5/0/1
6 2 3, 1D 3 3/0/0 2/1/0
7 3 2, 7, 2D 6 1/0/5 2/1/3
8 2 7, 3D 3 3/0/0 1/2/0
9 3 3, 11, 1D 4 4/0/0 2/2/0
10 2 18, 0D 2 2/0/0 1/1/0
11 2 1, 3D 2 2/0/0 1/1/0
12 1 5D 1 1/0/0 0/1/0
13 1 0D 3 1/0/2 1/0/2
Note.— *Time interval between acute symptom onset and MRI scan.
High, low, and iso indicate increased, decreased, and iso-signal intensity as compared to normal control region.
ADC = apparent diffusion coeffi cient, D = day(s), DWI = diffusion-weighted MR imaging
was seen in 10 lesions (32%), whereas 17 lesions (55%) evolved to encephalomalacia with or without residual abnormal signal intensity (Fig. 2F). For three lesions, the progressive spread of the edema occurred over 5-8 days, which eventually evolved to atrophy on the later follow-up images (Figs. 1, 2). An apparently progressive extent of the edematous lesion was seen in the remaining patient (patient 11) who underwent a second MR imaging 17 months after the initial scan. However, the different diffusion and perfusion characteristics within the lesion (ADC decline and hyper-perfusion at the posterior acute lesion, increased ADC
B
E
C
F A
D
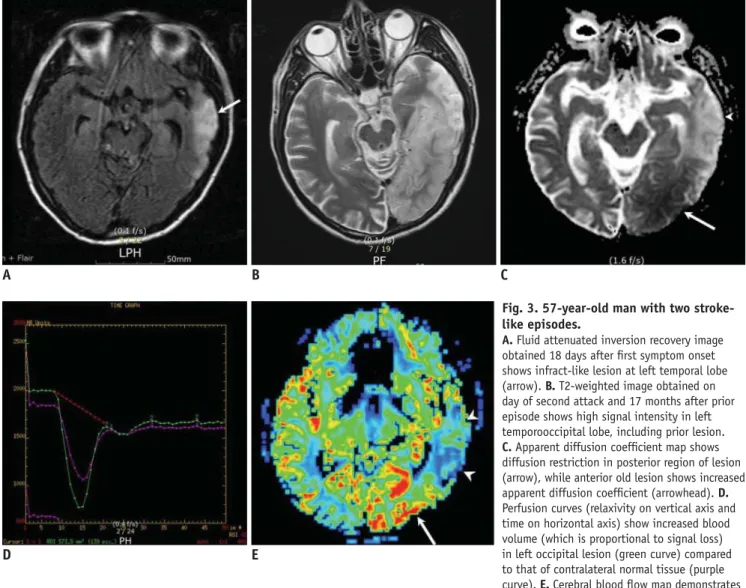
Fig. 2. Serial MR images in 50-year-old woman with four stroke-like episodes.
A, B. T2-weighted image (A) and cerebral blood fl ow map (B) obtained on same day as fi rst attack show subtle hyperintensity (arrows in A) and hyperperfusion (arrows in B) in both temporal lobes. C. Five days later, swelling worsened in both temporooccipital lobes as noted on T2- weighted image. D. Diffusion-weighted MR imaging shows cortical bright signal intensity that corresponds to iso or slightly dark cortical area on apparent diffusion coeffi cient map (E), while white matter of affected areas shows increase in apparent diffusion coeffi cient. F. Follow-up fl uid attenuated inversion recovery image obtained 20 months later shows localized atrophy of both temporooccipital lobes associated with residual high signal intensity.
Table 2. ADC Findings in 44 Acute Lesions on DWI SI* on
ADC map
Number of Lesions (%)
Mean % ADC ± SD
Low 16 (36) 61 ± 16.7
Iso 12 (27) 102 ± 5.3
High 16 (36) 145 ± 28
Total 44 (100) 103 ± 41.2
Note.— *SI means signal intensity. Low, iso, and high indicate increased, decreased, and iso-signal intensity as compared to normal control region. ADC = apparent diffusion coeffi cient, SD
= standard deviation.
translational motion of water molecules and it is sensitive to changes in the biological environment associated with various pathophysiological processes. Increased ADC values and hypo-perfusion at the anterior old lesion) suggested that
the newly appearing acute lesion overlapped with a chronic lesion (Fig. 3). Cortical laminar necrosis was seen in four lesions (Fig. 1E). On the follow-up MR images, the majority of the lesions became faint or disappeared on DWI, and exhibited increased ADC except for three progressive lesions that exhibited a further decrease in ADC over the short-term follow-up period. There was no signifi cant difference in the patterns of evolution (resolved, tissue loss, or progressed) of the edematous lesions according to the ADC profi le (high, low, or iso-signal intensity compared to the control area) during the acute stage (p = 0.44) (Table 3).
DISCUSSION
Diffusion-weighted MR imaging refl ects the random
Table 3. Evolution of Edematous Lesions according to Initial Apparent Diffusion Coeffi cient Findings
Low Iso High Total
Resolved 4 3 3 10
Progressed edema 1 1 24
Cortical laminar necrosis 4 0 0 4
Residual lesion and tissue loss 10 3 4 17 Note.— Some of lesions exhibited more than one evolution pattern on follow-up images.
Low, iso, and high indicate increased, decreased, and iso-signal intensity as compared to normal control region respectively.
A B
D E
C
Fig. 3. 57-year-old man with two stroke- like episodes.
A. Fluid attenuated inversion recovery image obtained 18 days after fi rst symptom onset shows infract-like lesion at left temporal lobe (arrow). B. T2-weighted image obtained on day of second attack and 17 months after prior episode shows high signal intensity in left temporooccipital lobe, including prior lesion.
C. Apparent diffusion coeffi cient map shows diffusion restriction in posterior region of lesion (arrow), while anterior old lesion shows increased apparent diffusion coeffi cient (arrowhead). D.
Perfusion curves (relaxivity on vertical axis and time on horizontal axis) show increased blood volume (which is proportional to signal loss) in left occipital lesion (green curve) compared to that of contralateral normal tissue (purple curve). E. Cerebral blood fl ow map demonstrates hyper-perfusion at newly appearing left occipital lesion (arrow), while anterior chronic lesion shows decreased perfusion (arrowheads).
correspond to increased extracellular space in vasogenic edema while cytotoxic edema in acute ischemic stroke causes reduced ADC values (4). The decline in ADC was also described to occur in association with severe hypoglycemia (20), status epilepticus (21), and cortical spreading depression (22).
In this study, the acute infarct-like lesions frequently exhibited a decrease in ADC, and although there were many reversible lesions, a large proportion of the edematous lesions eventually evolved to localized tissue loss, suggesting irreversible damage. Indeed, we increasingly observed areas of restricted diffusion during the early stage of MELAS (Table 4), and cytotoxic edema is the most likely cause of the apparent diffusion restriction. Prolonged mitochondrial energy failure may lead to ion pump failure and then cytotoxic edema will eventually develop.
However, an increase in ADC during the early phase also occurred in our study as well as in many prior reports (Table 4). In these settings, the occurrence of vasogenic edema due to a breakdown of the blood-brain barrier has been implicated as a cause of stroke-like lesions. The presence of vasogenic edema is supported by hyper-perfusion foci in the acute lesions of MELAS on the perfusion MR imaging in our study, which was also demonstrated in a recent study (23), which contrasts with the typical hypo-perfusion in acute vascular stroke. We can speculate that the increased regional lactate level might cause a change of the local vascular permeability or auto-regulation at the beginning of a stroke-like episode, and eventually leads to vasogenic edema and increased perfusion. This theory is also supported by the hyper-perfusion of the affected area on SPECT (single photon emission computed tomography) (3),
abnormal mitochondria within the vascular smooth muscle and endothelial cells (suggesting impaired auto-regulation) (24), and vasodilation seen on angiography or dynamic CT (25).
In addition, we can assume that those patients exhibiting a normal or increased ADC during the early period of a stroke-like event were possibly examined after the time point of pseudonormalization of the cytotoxic edema because the symptoms in MELAS are often nonspecifi c or they are not suffi ciently severe or acute enough to receive medical attention. The described confl icting fi ndings may also refl ect the observation that some of the lesions disappear after a couple of weeks, whereas others are newly developed or persist.
Although the lack of diffusion restriction is not the criteria to differentiate MELAS from the classic ischemic stroke anymore, there are several different patterns of ADC decline in MELAS compared to that of ischemic stroke. Our data indicates that the % ADC was signifi cantly higher in MELAS compared to the observed % ADC reduction in acute ischemic stroke. Iizuka et al. (15) also reported only a slight difference in ADC values between the stroke- like lesions and the non-affected area, which suggests concomitant vasogenic edema. The initial neuronal injury may cause cytotoxic edema and a low ADC, while the subsequent hyperperfusion causes increased blood in the voxels, and the extracellular edema may gradually increase the ADC. As the lesions evolve and new areas get involved, both processes overlap temporally, which leads to a mixture of cytotoxic and vasogenic edema (18).
Another different pattern of ADC reduction in MELAS is manifested as the time point of ADC decline being much
A B
Fig. 4. Scatter plots of the % apparent diffusion coeffi cient (vertical axis) according to elapsed time (days) after symptom onset (horizontal axis) in mitochondrial myopathy, encephalopathy, lactic acidosis, and stroke-like episode lesions (A) and lesions of ischemic infarcts (B).
Table 4. Published DWI Findings During Stroke-Like Events in MELAS
Author Year Case Episode Timing of MRI DWI ADC
Yoneda et al. (5) 1999 1 1 3D NR High
10D NR High
17D NR High
25D NR Iso
Oppenheim et al. (6) 2000 2 1 2D High High/Iso
Ohshita et al. (7) 2000 3 1 34D High NR
2 15D High High
30D High High
150D High Iso
4 1 240D High NR
2 5D High High
30D High High
150D High Iso/High
Yonemura et al. (8) 2001 5 1 2D High High
2 2D High High
Kolb et al. (9) 2003 6 1 NR High High
7 1 2D High High
Abe et al. (10) 2004 8-19 NR within 14D High High*
Jian-Ren (11) 2005 20 1 10D High High
Alemdar et al. (12) 2007 21 1 NR High High
Ito et al. (13) 2008 22 1 0 High High
Wang et al. (14) 2003 23 1 5D High Low
11D High Low
194D High High
Iizuka et al. (15) 2003 24 1 4/9D High Low
25 1 12/17D High Low
26 1 1D High Low
2 6D High Low
Mizrachi et al. (16) 2006 27 1 Days to weeks High Iso
Days High Low
30D High Iso
Bi et al. (17) 2006 28 1 1D High Iso
3D High Low
21D High High/Low
150D High High
2 2D High Low
Tzoulis et al. (18) 2008 29 1 8D High High/Low
11D High Low
58D High High
2 13D High High/Low
Sheerin et al. (19) 2008 30 1 NR High Low
Note.— ADC = apparent diffusion coeffi cient, D = days, DWI = diffusion-weighted MR imaging, MELAS = mitochondrial myopathy, encephalopathy, lactic acidosis, and stroke-like episode, NR = not reported.
delayed and prolonged compared to that of ischemic stroke.
The DWI changes in the MELAS syndrome did not appear until two days after the acute attack in a large series study (10), while restricted diffusion was seen after several days or even weeks after the event in previously published studies (Table 4) as well as in our study. Conversely, the DWI shows diffusion changes within hours following the vascular stroke, which is followed by a gradual increase in ADC up to reach a normal value (pseudonormalization) at about a week after the ischemic event. Therefore, it is postulated that unlike the acute ischemia of a vascular infarct, the cytotoxic edema of MELAS perhaps comes from gradually evolving metabolic cell death associated with mitochondrial dysfunction (15, 17).
Another important feature of the ADC change of MELAS is the gradual spread of the core of the edematous lesion, which is another reason for the delayed manifestation of a declined ADC. Several reports have demonstrated a slowly progressive and spreading pattern of this infarct-like lesion (14, 15, 17, 18), which was also observed in our series (Figs.
1, 2). Such a slowly progressive and spreading pattern has never been described for ischemic stroke.
Slow progression of the edema can be also seen from the cortical gray matter to the adjacent white matter. The gray matter of the cortex is particularly sensitive to changes in energy balance with its large energy demand (19) and the majority of the infarct-like lesions in MELAS preferentially involve the gray matter, with or without white matter extension as a function of the severity and acuity of the injury. Such a temporal progression can be seen both on the serial conventional MR images and DWI, and is evidenced by a shift in the declining ADC to the white matter, while the fully swollen cortical grey matter shows normal or increased ADC on short-term follow-up images (Fig. 1).
The limitations of this retrospective study included the variable timing of the MR imaging after symptom onset and the irregular follow-up time. Moreover, the technique of DWI was not uniform because the data was collected from three institutions for a long time period. To overcome this limitation, we used the % ADC rather than the absolute ADC value for comparison. Another limitation is that the perfusion imaging was performed in only fi ve of the 28 episodes. Further study on both diffusion and perfusion analysis during acute MELAS lesions in a large series may provide more generalized information.
In conclusion, diverse ADC changes suggesting the gradual evolution of the cytotoxic edema that overlapped
with hyper-perfusion and vasogenic edema following a stroke-like episode are the distinguishable features of MELAS, as compared with the features of an ischemic stroke. Although there are some reversible lesions, the edematous swelling may evolve to the progressive expansion of extensive cortical laminar necrosis and eventually to irreversible encephalomalacia with chronic abnormal signal intensity. This ultimately suggests the presence of irreversible damage, regardless of the initial ADC changes.
REFERENCES
1. Kim IO, Kim JH, Kim WS, Hwang YS, Yeon KM, Han MC.
Mitochondrial myopathy-encephalopathy-lactic acidosis-and strokelike episodes (MELAS) syndrome: CT and MR fi ndings in seven children. AJR Am J Roentgenol 1996;166:641-645 2. Ohama E, Ohara S, Ikuta F, Tanaka K, Nishizawa M, Miyatake
T. Mitochondrial angiopathy in cerebral blood vessels of mitochondrial encephalomyopathy. Acta Neuropathol 1987;74:226-233
3. Iizuka T, Sakai F, Suzuki N, Hata T, Tsukahara S, Fukuda M, et al. Neuronal hyperexcitability in stroke-like episodes of MELAS syndrome. Neurology 2002;59:816-824
4. Schaefer PW, Buonanno FS, Gonzalez RG, Schwamm LH.
Diffusion-weighted imaging discriminates between cytotoxic and vasogenic edema in a patient with eclampsia. Stroke 1997;28:1082-1085
5. Yoneda M, Maeda M, Kimura H, Fujii A, Katayama K, Kuriyama M. Vasogenic edema on MELAS: a serial study with diffusion- weighted MR imaging. Neurology 1999;53:2182-2184 6. Oppenheim C, Galanaud D, Samson Y, Sahel M, Dormont D,
Wechsler B, et al. Can diffusion weighted magnetic resonance imaging help differentiate stroke from stroke-like events in MELAS? J Neurol Neurosurg Psychiatry 2000;69:248-250 7. Ohshita T, Oka M, Imon Y, Watanabe C, Katayama S,
Yamaguchi S, et al. Serial diffusion-weighted imaging in MELAS. Neuroradiology 2000;42:651-656
8. Yonemura K, Hasegawa Y, Kimura K, Minematsu K, Yamaguchi T. Diffusion-weighted MR imaging in a case of mitochondrial myopathy, encephalopathy, lactic acidosis, and strokelike episodes. AJNR Am J Neuroradiol 2001;22:269-272
9. Kolb SJ, Costello F, Lee AG, White M, Wong S, Schwartz ED, et al. Distinguishing ischemic stroke from the stroke-like lesions of MELAS using apparent diffusion coeffi cient mapping. J Neurol Sci 2003;216:11-15
10. Abe K, Yoshimura H, Tanaka H, Fujita N, Hikita T, Sakoda S. Comparison of conventional and diffusion-weighted MRI and proton MR spectroscopy in patients with mitochondrial encephalomyopathy, lactic acidosis, and stroke-like events.
Neuroradiology 2004;46:113-117
11. Jian-Ren L. Precipitation of stroke-like event by chickenpox in a child with MELAS syndrome. Neurol India 2005;53:323-325 12. Alemdar M, Iseri P, Selekler M, Budak F, Demirci A, Komsuoglu
SS. MELAS presented with status epilepticus and Anton- Babinski syndrome; value of ADC mapping in MELAS. J Neuropsychiatry Clin Neurosci 2007;19:482-483
13. Ito H, Mori K, Harada M, Minato M, Naito E, Takeuchi M, et al.
Serial brain imaging analysis of stroke-like episodes in MELAS.
Brain Dev 2008;30:483-488
14. Wang XY, Noguchi K, Takashima S, Hayashi N, Ogawa S, Seto H. Serial diffusion-weighted imaging in a patient with MELAS and presumed cytotoxic oedema. Neuroradiology 2003;45:640- 643
15. Iizuka T, Sakai F, Kan S, Suzuki N. Slowly progressive spread of the stroke-like lesions in MELAS. Neurology 2003;61:1238- 1244
16. Mizrachi IB, Gomez-Hassan D, Blaivas M, Trobe JD. Pitfalls in the diagnosis of mitochondrial encephalopathy with lactic acidosis and stroke-like episodes. J Neuroophthalmol 2006;26:38-43
17. Bi WL, Baehring JM, Lesser RL. Evolution of brain imaging abnormalities in mitochondrial encephalomyopathy with lactic acidosis and stroke-like episodes. J Neuroophthalmol 2006;26:251-256
18. Tzoulis C, Bindoff LA. Serial diffusion imaging in a case of mitochondrial encephalomyopathy, lactic acidosis, and stroke- like episodes. Stroke 2009;40:e15-e17
19. Sheerin F, Pretorius PM, Briley D, Meagher T. Differential diagnosis of restricted diffusion confi ned to the cerebral
cortex. Clin Radiol 2008;63:1245-1253
20. Hasegawa Y, Formato JE, Latour LL, Gutierrez JA, Liu KF, Garcia JH, et al. Severe transient hypoglycemia causes reversible change in the apparent diffusion coeffi cient of water. Stroke 1996;27:1648-1655
21. Hasegawa D, Orima H, Fujita M, Nakamura S, Takahashi K, Ohkubo S, et al. Diffusion-weighted imaging in kainic acid- induced complex partial status epilepticus in dogs. Brain Res 2003;983:115-127
22. Bradley DP, Smith JM, Smith MI, Bockhorst KH, Papadakis NG, Hall LD, et al. Cortical spreading depression in the feline brain following sustained and transient stimuli studied using diffusion-weighted imaging. J Physiol 2002;544:39-56 23. Tsujikawa T, Yoneda M, Shimizu Y, Uematsu H, Toyooka M,
Ikawa M, et al. Pathophysiologic evaluation of MELAS strokes by serially quantifi ed MRS and CASL perfusion images. Brain Dev 2010;32:143-149
24. Clark JM, Marks MP, Adalsteinsson E, Spielman DM, Shuster D, Horoupian D, et al. MELAS: Clinical and pathologic correlations with MRI, xenon/CT, and MR spectroscopy.
Neurology 1996;46:223-227
25. Ooiwa Y, Uematsu Y, Terada T, Nakai K, Itakura T, Komai N, et al. Cerebral blood fl ow in mitochondrial myopathy, encephalopathy, lactic acidosis, and strokelike episodes.
Stroke 1993;24:304-309