Three-dimensional evaluation of midfacial
asymmetry in patients with nonsyndromic unilateral cleft lip and palate by cone-beam computed
tomography
Objective: To compare three-dimensionally the midfacial hard- and soft-tissue
asymmetries between the affected and the unaffected sides and determine the relationship between the hard tissue and the overlying soft tissue in patients with nonsyndromic complete unilateral cleft lip and palate (UCLP) by cone- beam computed tomography (CBCT) analysis.
Methods: The maxillofacialregions of 26 adults (18 men, 8 women) with nonsyndromic UCLP were scanned by CBCT and reconstructed by three-dimensional dental imaging. The frontal- view midfacial analysis was based on a 3 × 3 grid of vertical and horizontal lines and their intersecting points. Two additional points were used for assessing the dentoalveolar area. Linear and surface measurements from three reference planes (Basion-perpendicular, midsagittal reference, and Frankfurt horizontal planes) to the intersecting points were used to evaluate the anteroposterior, trans verse, and vertical asymmetries as well as convexity or concavity. Results:
Anteroposteriorly, the soft tissue in the nasolabial and dentoalveolar regions was significantly thicker and positioned more anteriorly on the affected side than on the unaffected side (p < 0.05). The hard tissue in the dentoalveolar region was significantly retruded on the affected side compared with the unaffected side (p < 0.05). The other midfacial regions showed no significant differences.
Conclusions: With the exception of the nasolabial and dentoalveolar regions,
no distinctive midfacial hard- and soft-tissue asymmetries exist between the affected and the unaffected sides in patients with nonsyndromic UCLP.
[Korean J Orthod 2013;43(3):113-119]
Key words: Computed tomography, Cleft lip and palate, Asymmetry, Soft tissue Youn-Kyung Choia
Soo-Byung Parka Yong-Il Kimb,c Woo-Sung Sona
aDepartment of Orthodontics, Pusan National University Dental Hospital, Yangsan, Korea
bDepartment of Orthodontics, School of Dentistry, Pusan National University, Busan, Korea
cBiomedical Research Institute, Pusan National University Hospital, Busan, Korea
Received September 10, 2012; Revised November 13, 2012; Accepted November 14, 2012.
Corresponding author: Yong-Il Kim.
Assistant Professor, Department of Orthodontics, Pusan National University, Biomedical Research Institute, Pusan National University Hospital, Gudeok-ro 137, Seo-gu, Busan 626-731, Korea.
Tel +82-51-240-7432 e-mail [email protected]
*This work was supported by a 2-Year Research Grant of Pusan National University.
Choi YK and Park SB were equally contributed to this article.
©
2013 The Korean Association of Orthodontists.The authors report no commercial, proprietary, or financial interest in the products or companies described in this article.
This is an Open Access article distributed under the terms of the Creative Commons Attribution Non-Commercial License (http://creativecommons.org/licenses/by-nc/3.0) which permits unrestricted non-commercial use, distribution, and reproduction in any medium, provided the original work is properly cited.
pISSN 2234-7518 • eISSN 2005-372X http://dx.doi.org/10.4041/kjod.2013.43.3.113
INTRODUCTION
Cleft lip, palate, or both are the most frequently occur- ring congenital facial deformities, having an incidence rate of 0.65% among newborns, with ethnic and geo- graphic variations.
1,2The typical manifestations of cleft lip and/or palate include midfacial deficiency related to retruded maxilla, contralaterally deviated anterior nasal spine, distorted nasal septum, collapsed piriform rim, and subsided nasal base.
3,4In the unilateral cleft, asymmetrical maxillary bone defects and distortions are common.
3,5-11Even after primary corrective surgery to improve the appearance, patients with unilateral cleft lip and palate (UCLP) show a distinct facial asymmetry.
12,13Numerous studies of the asymmetry of the cranial base, nasolabial region, and mandible of patients with UCLP have been conducted.
6,8-11,14-16In the nasolabial region, nasal septum distortion and deviation toward the affected side have been reported.
6,8-11However, the
mandibular asymmetry is controversial.
8,14-16Some au- thors reported significant differences in the lower face, especially in the mandible,
14,15whereas others offered contradictory data.
8,16Nevertheless, midfacial analysis to distinguish areas of obvious asymmetry has rarely been conducted.
This lacuna of research is attributable to the serious limitations of lateral cephalometric radiographs: speci- fically, their two-dimensional nature, superimposition of bony structures in the craniofacial and midfacial regions, and incomplete assessment of soft tissue.
17Kim et al.
18suggested grid-based cone-beam computed tomography (CBCT) analysis of hard- and soft-tissue changes, and Meyer-Marcotty et al.
7recommended registration of the original and mirrored data by using three-dimensional surface scans to analyze facial asymmetry. CBCT is a good tool for quantitative analysis of hard and soft tissues in the midface.
19,20Nonetheless, only a few reports on the use of CBCT for measuring superficial
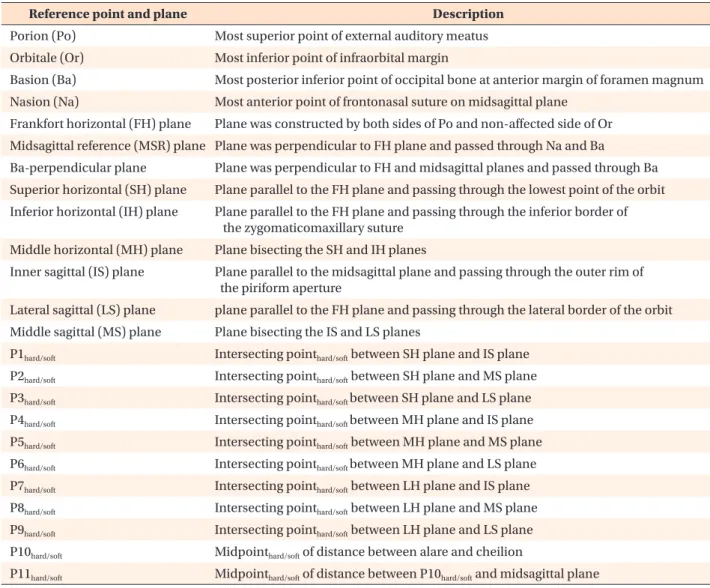
Table 1. Reference points and planes
Reference point and plane Description
Porion (Po) Most superior point of external auditory meatus Orbitale (Or) Most inferior point of infraorbital margin
Basion (Ba) Most posterior inferior point of occipital bone at anterior margin of foramen magnum Nasion (Na) Most anterior point of frontonasal suture on midsagittal plane
Frankfort horizontal (FH) plane Plane was constructed by both sides of Po and non-affected side of Or Midsagittal reference (MSR) plane Plane was perpendicular to FH plane and passed through Na and Ba
Ba-perpendicular plane Plane was perpendicular to FH and midsagittal planes and passed through Ba Superior horizontal (SH) plane Plane parallel to the FH plane and passing through the lowest point of the orbit Inferior horizontal (IH) plane Plane parallel to the FH plane and passing through the inferior border of
the zygomaticomaxillary suture Middle horizontal (MH) plane Plane bisecting the SH and IH planes
Inner sagittal (IS) plane Plane parallel to the midsagittal plane and passing through the outer rim of the piriform aperture
Lateral sagittal (LS) plane plane parallel to the FH plane and passing through the lateral border of the orbit Middle sagittal (MS) plane Plane bisecting the IS and LS planes
P1hard/soft Intersecting pointhard/soft between SH plane and IS plane
P2hard/soft Intersecting pointhard/soft between SH plane and MS plane
P3hard/soft Intersecting pointhard/soft between SH plane and LS plane
P4hard/soft Intersecting pointhard/soft between MH plane and IS plane
P5hard/soft Intersecting pointhard/soft between MH plane and MS plane
P6hard/soft Intersecting pointhard/soft between MH plane and LS plane
P7hard/soft Intersecting pointhard/soft between LH plane and IS plane
P8hard/soft Intersecting pointhard/soft between LH plane and MS plane
P9hard/soft Intersecting pointhard/soft between LH plane and LS plane
P10hard/soft Midpointhard/soft of distance between alare and cheilion
P11hard/soft Midpointhard/soft of distance between P10hard/soft and midsagittal plane
midfacial asymmetry in UCLP exist.
The aims of this study were to compare three-dimen- sionally the midfacial hard- and soft-tissue asymmetries between the affected and the unaffected sides and determine the relationship between the hard tissue and the overlying soft tissue in patients with complete UCLP by CBCT analysis. The null hypothesis was that no significant midfacial hard- and soft-tissue differences would exist between the affected and the unaffected sides in complete UCLP.
MATERIALS AND METHODS
Subjects
Twenty-six adults (18 men, 8 women; mean age, 22.79
± 6.38 years; range, 19 - 43 years) who had undergone complete UCLP correction were selected from the Depart ment of Orthodontics, Pusan National University Dental Hospital (Busan, Korea). The inclusion criteria were (1) availability of birth and treatment records, (2) surgical correction of the cleft in infancy (primary lip correction within 1 year; primary palate correction before 2 years), and (3) no orthognathic surgery. The exclusion criteria were (1) diagnosis of a syndrome, (2) either growth or mental retardation, and (3) maxillary distraction osteogenesis in adolescence. This study was reviewed and approved by the Ethics Committee of Pusan National University Hospital (E-2011040).
Data acquisition
Before the orthodontic treatment, CBCT scans (PaX- Zenith 3D; Vatech Co., Gyeonggi-Do, Korea) were recorded, with the subject in an upright position for maximum intercuspation. The Frankfurt horizontal (FH) plane was parallel to the floor. The maxillofacial regions were scanned by using a field of view of 20 × 19 cm, tube voltage of 90 kVp, tube current of 4.0 mA, and scan time of 24 s. The scans were reconstructed by using three-dimensional dental imaging software (Ez3D2009; E-WOO Technology Co., Ltd., Gyeonggi-Do, Korea). Then, the cranio facial structures in the three- dimensional images were re-orientated according to reference planes: the Basion-per pendicular, midsagittal reference (MSR), and FH planes (Table 1).
One operator performed all the measurements twice with an interval of 2 weeks. Under the same conditions, the linear and surface measurements of the hard and soft tissues were obtained (window width: 4,000; win- dow level: 1,000).
Linear measurements
The analytical method involved the use of a 3 × 3 grid of vertical and horizontal planes to divide the mid facial region unilaterally. The vertical planes were the inner
sagittal (IS), middle sagittal (MS), and lateral sagittal (LS) planes and the horizontal planes were the superior horizontal (SH), middle horizontal (MH), and inferior horizontal (IH) planes (Table 1, Figure 1). Their intersecting points were P1
hard/softto P9
hard/soft. Two additional points were used unilaterally to assess the dentoalveolar area:
P10
hard/soft, midpoint of the distance between the alare
and the cheilion, and P11
hard/soft, midpoint of the distance between P10
hard/softand the MSR plane (Table 1, Figure 1).
We obtained 22, five, and two linear measurements for assessing anteroposterior, transverse, and vertical hard- and soft-tissue asymmetries, respectively, in the midfacial and dentoalveolar areas on each side. To evaluate the anteroposterior asymmetry, the distances from the Ba-perpendicular plane to the corresponding hard- and soft-tissue points (P1
hard/softto P11
hard/soft) on the affected and unaffected sides were measured (Figure 2A). To evaluate the transverse asymmetry, the distances from the MSR plane to the IS and LS planes, along with the most lateral soft-tissue point on each of the vertical lines, were measured (Figure 2B). Finally, the vertical asymmetry was calculated by measuring the distances from the FH plane to the SH and IH planes. The SH plane on the unaffected side, referred to as the FH plane, was used as the reference line (Figure 2C).
Surface measurements
To evaluate the midfacial asymmetry in terms of con vexity or concavity between the affected and the unaf fected sides, the surface areas of the maxilla and Figure 1. Planes parallel to the reference planes and their intersecting points. SH, Superior horizontal; MH, middle horizontal; IH, inferior horizontal; LS, lateral sagittal; MS, middle sagittal; IS, inner sagittal.
See Table 1 for the definitions.
zygo matic bone on each of the horizontal planes were measured. The superior area was between the anterior surface of the maxilla and the line from P1
hardto P3
hard, the middle area was between the anterior surface of the maxilla and the line from P4
hardto P6
hard, and the inferior area was between the anterior surface of maxilla and the line from P7
hardto P9
hard. Negative values indicated concavity and positive values indicated convexity (Figure 2D).
Statistical analysis
To assess the intraobserver variability and reproduci- bility, the measurements were checked twice with an interval of 14 days. A paired t-test was used for all the comparisons. The differences were considered significant at p < 0.05. PASW Statistics version 18.0 for Windows (IBM Co., Armonk, NY, USA) was used for the statistical analyses.
RESULTS
The intraobserver agreement of the measurements was ex cellent (intraclass correlation coefficient range: 0.966 - 0.998).
Anteroposterior asymmetry
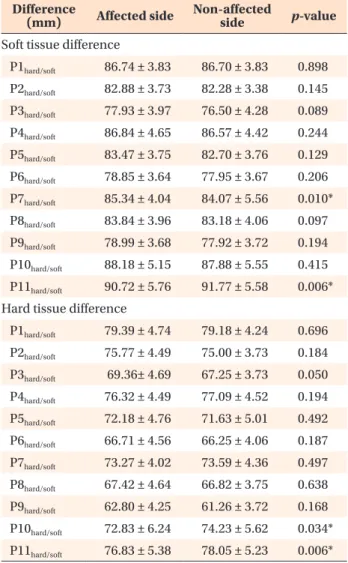
In the soft-tissue analysis, the distances from the Ba- perpendicular plane to P7
softon the unaffected side (p
= 0.010) and P11
softon the affected side (p = 0.006) were significantly decreased (Table 2). In the hard-tissue analysis, the distances from the Ba-perpendicular plane to P10
hard(p = 0.034) and P11
hard(p = 0.006) on the affected side showed a significant reduction. None of the other midfacial measurements showed significant differences (p > 0.05).
Figure 2. Linear and surface measurements. A, Distance between the Ba-perpendicular plane and the corresponding hard- and soft-tissue points. B, Distance between the midsagittal reference (MSR) plane and the inner sagittal (IS) and lateral sagittal (LS) planes as well as the most lateral soft-tissue point on each of the vertical lines. C, Distance between the Frankfurt horizontal (FH) plane and the superior horizontal (SH) and inferior horizontal (IH) planes. D, Surface measurements between IS plane and line from inner measurement point to lateral measurement point. See Table 1 for the abbreviations.
Table 2. Results of the CBCT analysis of the sagittal hard- and soft-tissue differences
Difference
(mm) Affected side Non-affected
side p-value Soft tissue difference
P1hard/soft 86.74 ± 3.83 86.70 ± 3.83 0.898
P2hard/soft 82.88 ± 3.73 82.28 ± 3.38 0.145
P3hard/soft 77.93 ± 3.97 76.50 ± 4.28 0.089
P4hard/soft 86.84 ± 4.65 86.57 ± 4.42 0.244
P5hard/soft 83.47 ± 3.75 82.70 ± 3.76 0.129
P6hard/soft 78.85 ± 3.64 77.95 ± 3.67 0.206
P7hard/soft 85.34 ± 4.04 84.07 ± 5.56 0.010*
P8hard/soft 83.84 ± 3.96 83.18 ± 4.06 0.097
P9hard/soft 78.99 ± 3.68 77.92 ± 3.72 0.194
P10hard/soft 88.18 ± 5.15 87.88 ± 5.55 0.415
P11hard/soft 90.72 ± 5.76 91.77 ± 5.58 0.006*
Hard tissue difference
P1hard/soft 79.39 ± 4.74 79.18 ± 4.24 0.696
P2hard/soft 75.77 ± 4.49 75.00 ± 3.73 0.184
P3hard/soft 69.36± 4.69 67.25 ± 3.73 0.050
P4hard/soft 76.32 ± 4.49 77.09 ± 4.52 0.194
P5hard/soft 72.18 ± 4.76 71.63 ± 5.01 0.492
P6hard/soft 66.71 ± 4.56 66.25 ± 4.06 0.187
P7hard/soft 73.27 ± 4.02 73.59 ± 4.36 0.497
P8hard/soft 67.42 ± 4.64 66.82 ± 3.75 0.638
P9hard/soft 62.80 ± 4.25 61.26 ± 3.72 0.168
P10hard/soft 72.83 ± 6.24 74.23 ± 5.62 0.034*
P11hard/soft 76.83 ± 5.38 78.05 ± 5.23 0.006*
Values are presented as mean ± standard deviation.
*Significant difference by the paired t-test (p < 0.05).
See Table 1 for the definitions of landmarks.
Transverse and vertical asymmetries
In terms of the transverse asymmetry, only the distance from the MSR plane to the IS plane was significantly different (p < 0.05): it was greater on the affected side than on the unaffected side. None of the soft-tissue measurements showed significant differences (p >
0.05). Further, neither of the measurements for vertical asymmetry were significant (p > 0.05).
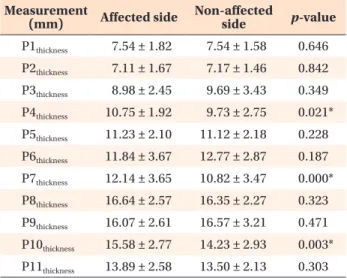
Soft tissue thickness
In terms of the soft-tissue thickness, P4
thickness(p = 0.021), P7
thickness(p = 0.000), and P10
thickness(p = 0.003) showed significant differences on the affected side (Table 3). The middle and lateral regions of the midface showed no significant differences between the sides (p >
0.05).
Surface measurements
No significant differences in the surface measurements were noted (p > 0.05; Table 4).
DISCUSSION
Although much research on asymmetry in patients with UCLP has been conducted, conclusions remain elusive.
6,7,17,21,22Simply, the midfacial hard- and soft- tissue asymmetries in adults have not been sufficiently evaluated. In the present study, CBCT, with the use of established reference lines and grid planes,
18,22enabled effective simultaneous analysis of hard- and soft-tissue asymmetries of the midface in adults with nonsyndromic UCLP. As these patients show midfacial defects and
variations, a cranial structure manifesting a relatively small variation was used as the basis for the reference planes. The FH and MSR planes, given the previous research showing the porion to be an adequately stable structure for use as a reference point,
17,23were considered acceptable for evaluating midfacial asymmetry caused by a relatively small variation of the cleft.
17Tissue defects and scar tissue resulting from early sur- gery in patients with UCLP can impede normal growth and induce anteroposterior and transverse asymmetries.
Nasal asymmetry is a long-recognized stigma of these patients.
9,11,21,24,25Even so, the midfacial area has rarely been the focus of study.
The results showed that no significant differences existed between the affected and the unaffected sides or between the hard and the soft tissues at most sites (p >
0.05). Similarly, previous research has shown significant differences between the affected and the unaffected sides only in the nasolabial and dentoalveolar areas.
8,17Suri et al.
17observed no significant differences in bila- teral measurements of the craniofacial structures far from the cleft, indicating the absence of major transverse and sagittal asymmetries of the deeper midfacial struc- tures in their study sample. The maxillary sinuses on both sides of the face were similar to the reference in size and lateromedial and anteroposterior locations.
Further, Suzuki et al.
24reported that the size of the sinus associated with UCLP is not dependent on the cleft side.
However, others have reported contradictory results, showing asymmetry in the midfacial region, especially of the orbital, maxillary, and nasal regions, by using three- dimensional skull models. Lateral dislocation of the maxilla on the affected side has been noted, and mean retrograde movement has been shown in 52% of the patients.
22,26,27With regard to the hard-tissue measurements, only those in the dentoalveolar area were significantly dif- ferent (p < 0.05): the tissue on the affected side was Table 4. Results of the CBCT analysis of the surface measurements
Measurement
(mm2) Affected side Non-affected side p-value S-area 56.88 ± 28.16 50.11 ± 26.83 0.516 M-area 13.79 ± 34.96 10.05 ± 32.60 0.225 I-area 11.25 ± 49.47 −0.61 ± 64.62 0.872 Values are presented as mean ± standard deviation. Negative and positive values represent concavity and convexity, respectively.
*Significant difference by the paired t-test (p < 0.05).
S-area, Superior area; M-area, middle area; I-area, inferior area.
See Table 1 for the definitions of landmarks.
Table 3. Results of the CBCT analysis of the soft-tissue thickness at the intersecting points
Measurement
(mm) Affected side Non-affected
side p-value
P1thickness 7.54 ± 1.82 7.54 ± 1.58 0.646
P2thickness 7.11 ± 1.67 7.17 ± 1.46 0.842
P3thickness 8.98 ± 2.45 9.69 ± 3.43 0.349
P4thickness 10.75 ± 1.92 9.73 ± 2.75 0.021*
P5thickness 11.23 ± 2.10 11.12 ± 2.18 0.228
P6thickness 11.84 ± 3.67 12.77 ± 2.87 0.187
P7thickness 12.14 ± 3.65 10.82 ± 3.47 0.000*
P8thickness 16.64 ± 2.57 16.35 ± 2.27 0.323
P9thickness 16.07 ± 2.61 16.57 ± 3.21 0.471
P10thickness 15.58 ± 2.77 14.23 ± 2.93 0.003*
P11thickness 13.89 ± 2.58 13.50 ± 2.13 0.303
Values are presented as mean ± standard deviation.
*Significant difference by the paired t-test (p < 0.05).
See Table 1 for the definitions of landmarks.