동질성 문턱 값 기반 영상분할에서 과분할 영역 축소 방법 55
A Reduction Method of Over-Segmented Regions at Image Segmentation based on Homogeneity Threshold
Gi-Tae Han†
ABSTRACT
In this paper, we propose a novel method to solve the problem of excessive segmentation out of the method of segmenting regions from an image using Homogeneity Threshold().
The algorithm of the previous image segmentation based on was carried out region growth by using only the center pixel of selected window. Therefore it was caused resulting in excessive segmented regions. However, before carrying region growth, the proposed method first of all finds out whether the selected window is homogeneity or not. Subsequently, if the selected window is homogeneity it carries out region growth using the total pixels of selected window. But if the selected window is not homogeneity, it carries out region growth using only the center pixel of selected window. So, the method can reduce remarkably the number of excessive segmented regions of image segmentation based on .
In order to show the validity of the proposed method, we carried out multiple experiments to compare the proposed method with previous method in same environment and conditions. As the results, the proposed method can reduce the number of segmented regions above 40% and doesn't make any difference in the quality of visual image when we compare with previous method.
Especially, when we compare the image united with regions of descending order by size of segmented regions in experimentation with the previous method, even though the united image has regions more than 1,000, we can't recognize what the image means. However, in the proposed method, even though image is united by segmented regions less than 10, we can recognize what the image is. For these reason, we expect that the proposed method will be utilized in various fields, such as the extraction of objects, the retrieval of informations from the image, research for anatomy, biology, image visualization, and animation and so on.
Keywords : Image Segmentation, Homogeneity Threshold, Region Growth, Center Pixel, Selected Window
1. 서 론1)
영상은 인간에게 시각적 정보를 전달하는 중요한 수단이 며, 오늘날 많은 산업분야에서 영상의 분석 결과가 의사결 정의 결정적인 기준이 되기도 한다. 특히 내용기반 영상검 색이나 영상 내 객체인식 혹은 영상 시각화 연구 등에서는 영상을 분할하여 여러 개의 동질성영역으로 나누거나 여러 개의 동질성 영역을 하나의 영역으로 모으는 병합과 같은 영상처리 과정이 필요며, 특히 의료분야나 바이오 인포믹스 분야에서 요구되는 해부학적 구조의 분석을 위해서는 하나 의 영상을 객체(objects)나 영역(region)으로 나누는 2D 혹 은 3D 영상분할 기술이 필요하다[2, 3, 4, 5, 6, 7, 9].
현재까지 영상분할에 관한 연구는 꾸준히 진행되었으며, Otsu의 방법[1]을 확장한 영상분할 기술[3, 4, 10, 11]이 많 은 영역에서 활용되어 왔다. 특히 최근에 발표된 동질성 문 턱 값 기반 영상 분할 방법은 영상을 분할할 임계 값을 분 할대상 영상으로부터 자동으로 추출하고, 그 임계 값을 가 지고 영상을 자동으로 분할하는 방법이다[11]. 이 방법은 하
※ 이 연구는 2012년 가천대학교 지원에 의한 결과임.
†정 회 원 : 가천대학교 IT대학 인터랙티브미디어학과 교수 논문접수 : 2012년 8월 9일
심사완료 : 2012년 8월 30일
* Corresponding Author : Gi-Tae Han([email protected])
나의 영상에서 여러 개의 영역을 분할하는데 필요한 분리 기준인 동질성 문턱 값(:Homogeneity Threshold)을 자 동으로 계산한다.
계산은 분할대상 영상에 대하여 × 윈도우로 슬 라이딩하면서 국소(local)영역마다 단일 Otsu 방법을 적용하 여 두 클래스에 대한 각각의 표준편차 와 및 각 클 래스간의 최대분산 을 구한다. 이때 ≤ 이 면 해당영역이 동질성영역으로 판단하고, 그렇지 않으면 동 질성영역이 아닌 것으로 간주한다. 여기서 윈도우가 동질성 영역으로 분류되면 동질성 영역 윈도우(: Window of Homogeneous region)의 모든 화소들에 대하여 동일영역으 로 영역번호를 부여한다. 한편, 동질성이 아닌 영역 중에서
인 경우에 대하여는 동질성 영역 문턱 값 를 계산하기 위한 원소로 를 저장하고, 전체 영상 을 윈도우로 분할한 모든 국소 영역들에서 구한 들을 가 지고 식(1)로 평균값 를 구한다.
(1)
(단, m은 계산을 위해 참여하는 의 수)
http://dx.doi.org/10.3745/KTSDE.2012.1.1.055
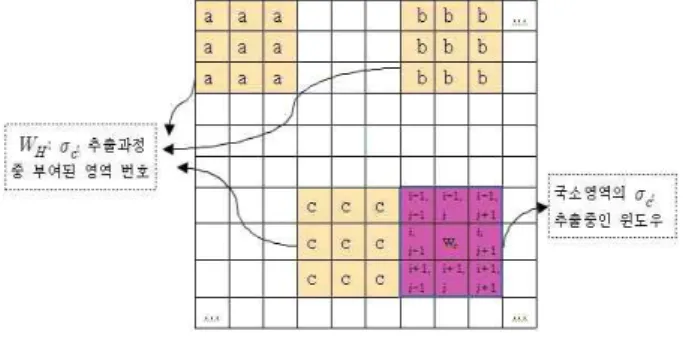
Fig. 1. Region of homogeneous window() 장(Region Growing)은 를 이용하여 × 윈도우를 슬
라이딩 하면서 선택된 윈도우 내 중심화소 의 명암도와 윈도우 안에 포함된 기 분할된 각 영역에서의 화소들의 평 균 화소 값과의 차이를 계산하여 그 차이가 가장 작은 값이
이하이면 중심화소 를 해당영역으로 병합하는 방식 이다. 그러나 이 방법은 영상분할 과정 중에 분할대상 영역 의 중심화소 와 윈도우내 기 분할된 영역들의 평균 명 암도 차를 와 비교할 때 선택 윈도우의 중심화소 만을 가지고 처리하기 때문에 영역의 개수가 과분할 된 상태로 존재하는 경향을 볼 수 있었다[11].
본 논문에서는 이러한 문제를 해결하기 위하여 기존 동질 성 문턱 값 기반 영상분할과정 중에 × 선택 윈도우가 동질성을 만족할 경우에 윈도우의 화소 전부를 윈도우 주변 영역과의 영역병합 과정에 참여시키고, 윈도우가 동질성 조 건을 만족하지 않을 경우에는 윈도우의 중심화소 만을 주변 영역과의 영역병합 과정에 참여시키는 개선된 병합알고리듬 을 제안한다. 이 방법을 통하여 기존 동질성 문턱 값 방법에 서 나타났던 과분할 영역의 개수를 줄일 수 있으며, 분할된 영역들 중 소수 영역들의 결합만으로도 영상의 내용을 충분 히 표현할 수 있음을 보인다. 본 논문의 구성은 Ⅱ 장에서 제안한 방법을 알고리듬을 통하여 살펴보고, Ⅲ 장에서는 실 험 및 결과를 가지고 타당성 및 우수성을 보이며, 그리고 Ⅳ 장에서는 결론과 향후 연구방향에 대하여 기술한다.
2. 제안한 방법
기존에 제안한 기반의 방법[11]은 영역의 분할과정에 서 3×3 윈도우의 중심화소 와 윈도우내 기 분할된 영역 의 평균 명암도를 비교하여, 그 차가 가장 작으면서 이 하 조건을 만족하는 기 분할 영역이 존재하면 해당 영역에
를 할당하는 방식의 영역성장(Region Growth)을 수행한 다. 이것은 윈도우의 중심화소 와 주변 기 분할 영역간 의 명암도를 비교하는 방식으로 현재 작업수행 중인 윈도우 영역과 윈도우 주변의 기 분할된 영역 간에 동질성 조건이 존재하더라도 영역병합은 이루어지지 않는다. 왜냐하면 이 것은 비교 대상을 중심화소 와 기 분할영역으로 국한하 였기 때문이며, 윈도우 영역과 기 분할된 주변영역 간에 명 암도의 차가 이하인 영역이 존재하더라도 영역간의 병 합이 이루어지지 않아 분할상태로 존재하게 된다. 이러한 문제는 영상분할의 신뢰성을 저하시킬 수 있으며, 분할된 결과 영역을 응용분야에 사용해야 하는 경우에 영역별 크기
2.1 동질성 윈도우() 기반 영역병합
동질성 윈도우 는 × 크기의 동질성 영역을 갖는 윈도우를 말하며, Fig. 1에서는 a, b, c의 동일한 영역번호를 가진 윈도우 영역이 이에 해당된다. 기존 Han의 방법[11]에 서는 추출을 위한 과정에서 동질성 영역으로 간주되는 영역 에 대하여 사전에 영역번호를 할당하고, 를 기 반으로 영역분할과정을 수행할 때는 동질성 윈도우영역
를 기 분할된 영역으로 간주하여 작업영역에서 제외하 는데, 이것이 과 분할을 초래하는 원인중의 하나가 되었다.
따라서 제안한 방법에서는 과분할 영역을 줄이기 위하여 영 역분할 알고리즘에서 동질성 윈도우 를 조건을 만 족하는 윈도우 주변의 동질성 영역에 병합시키는 방법을 제 안한다. Fig. 1은 계산 중에 부연된 의 영역번호와
를 추출중인 윈도우를 나타내고 있다.
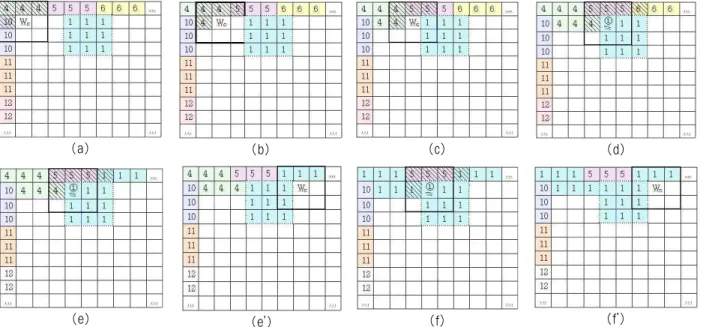
한편, 동질성 문턱 값 를 계산하는 과정에서 동질성을 갖지 않은 × 윈도우 영역에는 영역번호가 부여되지 않 으며, 계산에 필요한 원소 를 구하는 영역으로 활용 된다. 또한, 이 영역은 영역번호가 없는 미분할 영역이기 때 문에 기반 영상분할과정에서 실질적인 영역분할의 대 상영역이 된다. 다음 Fig. 2는 동질성 문턱 값 기반의 영상 분할과정을 나타내고 있으며, Fig. 2의 (a)가 영상분할의 초 기상태이고 (a)에 표시된 점선영역인 영역번호 1의 × 영 역이 동질성 윈도우 이다. 여기서 번호 4,5,6,10,11,12는 가장자리만을 대상으로 를 적용하여 미리 영역번호를 부여하여 놓은 것으로 × 윈도우의 슬라이딩을 위해 필 요한 사전 작업의 결과이다.
Fig. 2의 (a)단계에서 (f)단계를 가지고 동질성 윈도우
와 기 분할 영역 간 병합방법을 살펴보면 Fig. 2의 (a):
(a) (b) (c) (d)
(e) (e') (f) (f')
Fig. 2. Merging process between homogeneous window and surround regions
약어설명
: 분할대상 원본영상
: 계산 과정에서 동질성 윈도우의 영역번호가 부여된 메모리상의 영상
: 영역 병합(merge of region)과정의 영상으로 현 위치까지
의 병합이 반영된 메모리상의 영상
: 동질성 윈도우
: 윈도우의 중앙 화소
,: 의 주변 화소가 포함된 영역,
: 의 주변 화소가 포함된 영역
: 동질성영역 문턱 값
를 계산하는 과정에서 영역분할이 이루어져 영역번호가 부여된 화소들과 × 윈도우를 가지고 슬라이딩하기 위 한 첫 단계를 보여주고 있다. 번호 1로 부여된 × 윈도 우 영역이 동질성 윈도우 영역 이고, 가 윈도우의 중심 화소이다.
Fig. 2의 (b): 최초 × 윈도우를 한 화소 우측으로 슬 라이딩 하였으며, (a)의 중심화소 가 영역 4로 병합되었 음을 보인다. × 윈도우에서 빗금처진 영역은 영역번호를 가지고 있는 기 분할된 영역을 나타낸다.
Fig. 2의 (c): × 윈도우내에 가 들어 왔으나 윈 도우의 중심화소 가 의 원소가 아니므로 를 동 질성 영역병합 과정에 이용한다.
여기서 Fig. 2의 (a)~(c)의 과정은 기존의 동질성 문턱 값 기반 영역확장(Region Growth) 방법의 단계와 동일하다
Fig. 2의 (d): 윈도우의 중심화소 의 위치에 동질성 윈도우 의 화소(①)가 들어왔으므로, 동질성 윈도우
의 주변 화소(빗금처진 화소)가 속한 각 영역들(4, 5, 6 영역)의 평균 명암도와 동질성 윈도우 의 평균 명암도 와 차를 비교하여 그 차 값을 동질성 문턱 값 와 비교 한다.
이때 그 차 값이 이하인 영역이 존재하면 Fig. 2의 (e)(f): 동질성 윈도우 와 병합하되 병합 전 두 영역 중 에 영역번호가 작은 번호를 병합영역에 부여한다. (e)의 경 우는 1개의 병합 영역이 발생한 경우이고, (f)의 경우는 2개 의 병합 영역이 발생한 경우이다.
예를 들어 동질성 윈도우 에 1번의 번호가 부여되어 있고 (e)에서처럼 동질성 윈도우 의 평균명암도와 그
주변 영역의 평균명암도의 차이가 이하인 영역이 6번 영역만 해당된다면 6번 영역을 모두 1번으로 부여하게 된다.
또한 (f)에서처럼 조건을 만족하는 영역이 2개 이상 일 때 해당 영역 모두를 동질성 윈도우 에 병합한다. 여기서 병합영역에 사용할 영역번호는 와 조건을 만족하는 주 변의 영역에 부여된 영역번호 중에서 가장 작은 번호를 선 택한다. 예를 들어 4와 6의 영역이 이하의 영역이라면 1 과 4와 6영역 모두가 1의 영역이 된다. 이와 같은 작업이 이루어진 후에 슬라이딩했을 때 기 영역 분할영역(여기서는 1번 영역)의 화소가 에 위치한다면 영역분할이 되지 않 은 영역이 나올 때까지 (e')과 (f')처럼 윈도우를 슬라이드 시킨다. 다음은 동질성 윈도우 와 주변 동질성 영역과 의 병합 알고리듬이다.
[알고리듬: 와 주변영역 그리고와 주변영역의 병합]
[알고리듬_SUB_01]: 가 의 원소일 때 동질성 윈도우와 주변영역의 병합방법
[알고리듬_SUB_02]: 의 화소위치에 영역번호가 존재하지 않거나 혹은 가 의 원소가 아닐 때
와 주변영역 병합방법
(a)
(b) (b')
(c) (c')
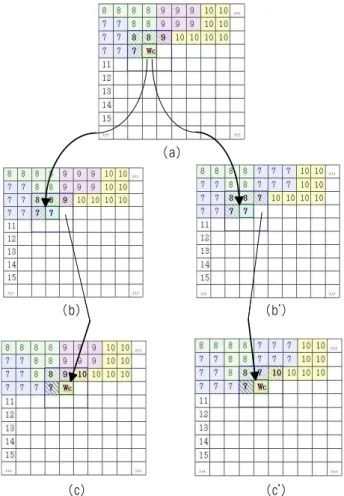
Fig. 3. Merging process of surround regions by algorithm SUB-2
2.2 윈도우 중심화소() 기반 영역병합
앞 절에서는 가 동질성 윈도우 의 원소일 때와 아닐 때를 구분하여 영역병합 방법에 대한 알고리듬을 제시 하였다. 이 절에서는 영역분할과정에서 윈도우 중심화소
에 의하여 연결된 두개 이상의 영역이 병합 될 수 있음 을 예를 통하여 보이고자 한다. Fig. 3과 같이 의 화소위치에 영역번호가 존재하지 않을 때 알고리듬 SUB_2 를 통하여 영역병합여부를 결정하고, 윈도우내 명암도 와 의 주변화소가 속한 기 분할된 영역들(7, 8, 9번 영 역)과 평균명암도 값을 비교하여 그 차이가 보다 작거나 같다면 알고리듬 SUB_2 에 정의한 조건에 따라 영역병합을 진행한다. Fig. 3을 가지고 설명하자면 평균명암도 값의 차 이가 보다 작거나 같은 영역 7번 영역만이 존재한다면
는 영역번호 7로 영역이 병합되고 다음 단계로 Fig. 3의 (c)와 같이 계속 작업이 진행된다. 하지만 7번 영역 외에 9 번 영역 또한 평균명암도와 의 명암도의 차이가 보 다 작거나 같다면, 에 의해 7번 영역과 9번영역의 연결 이 Fig. 3의 (b′)와 같이 일어나고 Fig. 3의 (c′)와 같이 다음 윈도우에 의하여 계속 작업을 진행한다. 이때 영역번 호 7번과 9번 중에서 7번의 영역번호를 택한 것은 앞의 알
고리듬을 설계할 때 영역번호가 작은 영역번호를 부여하기 로 정하였기 때문이다.
Fig. 3은 3×3 윈도우의 중심 화소인 에 의해 주변영 역들을 병합으로 연결하는 유형을 보여주고 있다. Fig. 3의 (a)->Fig. 3의 (b)->Fig. 3의 (c)는 가 1개의영역으로 병 합되는 내용을 보여주고 있고, Fig. 3의 (a)->Fig. 3의 (b')->Fig. 3의 (c')는 가 2개 이상의 영역을 연결하여 병합되는 내용을 보여주고 있다.
3. 실험 및 결과
본 논문에서는 기존에 제안한 동질성 문턱 값 기반 영상 분할 방법[11]에서 과 분할영역의 개수를 줄이기 위하여 동 질성 윈도우 와 의 주변영역간의 병합 및 와
주변 영역간의 병합 알고리듬을 제안하고 실험을 통하 여 제안한 방법의 우수성을 보인다. 실험은 Citrus, Peppers, Human Brain, Spine, Pollution, Scenery, Semiconductor, Lena 등 다양한 영상을 가지고 기존방법과 제안한 방법에 대한 영역분할 결과를 비교하되, 동질성 영역으로 분할된 결과 영상들을 시각화하기 위하여 기존방법[11]에서 제시한 것과 같이 분할된 영역 중에서 영역이 가장 큰 것부터 1개, 5개, 10개, 50개, 100개, 500개, 1000개, 그리고 전체영역을 결합한 영상을 Fig. 4와 Fig. 5부터 Fig. 18과 Fig. 19까지 쌍을 이루어 시각적으로 비교하기 수월하도록 나타내었다.
기존방법을 사용하여 영상 분할한 결과를 영역의 크기순 으로 나타낸 Fig. 4, Fig. 6, Fig. 8, Fig. 10, Fig. 12, Fig.
14, Fig. 16, Fig. 18을 보았을 때, 1,000개 이상의 영역을 결 합하여도 어떠한 영상인지 구분하기가 어려운데, 이것은 동 질성 영역을 가진 영역들이 서로 병합되지 않은 채 남아있 는 영역이 있어서 과 분할을 초래했기 때문이다. 그러나 제 안한 방법의 결과인 Fig. 5, Fig. 7, Fig. 9, Fig. 11, Fig. 13, Fig. 15, Fig. 17, Fig. 19에서는 10개 내외의 영역만 결합하 여도 그 영상이 어떤 영상인지를 식별할 수 있음을 확인할 수 있는데, 이것은 영역분할 과정에서 동질성 윈도우 와 주변 영역 간에 병합이 이루어지고, 또한 윈도의 중심화 소 를 통하여 주변의 동질성영역들이 이어져서 병합되 었기 때문이다.
또한 원 영상에 유입된 노이즈를 처리한 상태에서 제안한 방법을 적용하였을 때에는 영역의 분할개수가 노이즈 처리 전 영상의 절반수준으로 줄어드는 것을 볼 수 있었다. Fig.
20은 각 실험영상에 대하여 분할된 영역들로 결합한 영상을 나타내는데, 각 영상에 대하여 (A)는 기존방법[11]을 적용하 여 영상분할 한 결과 영상, (B)는 본 논문에서 제안한 방법 1(노이즈 포함 영상을 실험)을 사용한 경우의 결과 영상, 그 리고 마지막으로 (C)는 본 논문에서 제안한 방법 2(노이즈 제거 영상을 실험)를 사용한 경우의 결과영상을 비교하고 있다. Fig. 20은 결과적으로 시각적인 차이는 없지만 (A)에 서 (C)로 갈수로 과분할 영역의 개수를 줄일 수 있는 방법 임을 보이고 있다.
(a) The number of regions: 1
(b) The number of regions: 5
(c) The number of regions: 10
(d) The number of regions: 50
(e) The number of regions: 100
(f) The number of regions: 500
(g) The number of regions: 1,000
(h) The number of regions: 8,468(total) Fig. 4. Segmentation of citrus image by previous method[11]
(a) The number of regions: 1
(b) The number of regions: 5
(c) The number of regions: 10
(d) The number of regions: 50
(e) The number of regions: 100
(f) The number of regions: 500
(g) The number of regions:1,000
(h) The number of regions: 4,607(total) Fig. 5. Segmentation of citrus image by proposed method
(a) The number of regions: 1
(b) The number of regions: 5
(c) The number of regions: 10
(d) The number of regions: 50
(e) The number of regions: 100
(f) The number of regions: 500
(g) The number of regions: 1,000
(h) The number of regions: 8,241(total) Fig. 6. Segmentation of peppers image by previous method[11]
(a) The number of regions: 1
(b) The number of regions: 5
(c) The number of regions:10
(d) The number of regions: 50
(e) The number of regions: 100
(f) The number of regions: 500
(g) The number of regions: 1,000
(h) The number of regions: 4,856(total) Fig. 7. Segmentation of peppers image by proposed method
(a) The number of
regions: 1 (b) The number of
regions: 5 (c) The number of
regions: 10 (d) The number of regions: 50
(e) The number of regions: 100
(f) The number of regions: 500
(g) The number of regions: 1,000
(h) The number of regions: 6,927(total) Fig. 8. Segmentation of human brain image by previous method[11]
(a) The number of regions: 1
(b) The number of regions: 5
(c) The number of regions: 10
(d) The number of regions: 50
(e) The number of regions: 100
(f) The number of regions: 500
(g) The number of regions: 1,000
(h) The number of regions: 4,229(total) Fig. 9. Segmentation of human brain image by proposed method
(a) The number of
regions: 1 (b) The number of
regions: 5 (c) The number of
regions: 10 (d) The number of regions: 50
(e) The number of regions: 100
(f) The number of regions: 500
(g) The number of regions: 1,000
(h) The number of regions: 7,174(total) Fig. 10. Segmentation of spine image by previous method[11]
(a) The number of regions: 1
(b) The number of regions: 5
(c) The number of regions: 10
(d) The number of regions: 50
(e) The number of
regions: 100 (f) The number of
regions: 500 (g) The number of
regions: 1,000 (h) The number of regions: 4,608(total) Fig. 11. Segmentation of spine image by proposed method
(a) The number of regions: 1
(b) The number of regions: 5
(c) The number of regions: 10
(d) The number of regions: 50
(e) The number of
regions: 100 (f) The number of
regions: 500 (g) The number of
regions: 1,000 (h) The number of regions: 6,488(total) Fig. 12. Segmentation of pollution image by previous method[11]
(a) The number of regions: 1
(b) The number of regions: 5
(c) The number of regions: 10
(d) The number of regions: 50
(e) The number of regions: 100
(f) The number of regions: 500
(g) The number of regions: 1,000
(h) The number of regions: 2,325(total) Fig. 13. Segmentation of pollution image by proposed method
(a) The number of regions: 1
(b) The number of regions: 5
(c) The number of regions: 10
(d) The number of regions: 50
(e) The number of
regions: 100 (f) The number of
regions: 500 (g) The number of
regions: 1,000 (h) The number of regions: 7,063(total) Fig. 14. Segmentation of scenery image by previous method[11]
(a) The number of
regions: 1 (b) The number of
regions: 5 (c) The number of
regions: 10 (d) The number of regions:50
(e) The number of
regions: 100 (f) The number of
regions: 500 (g) The number of
regions: 1,000 (h) The number of regions: 3,360(total) Fig. 15. Segmentation of scenery image by proposed method
(a) The number of
regions: 1 (b) The number of
regions: 5 (c) The number of
regions: 10 (d) The number of regions: 50
(e) The number of
regions: 100 (f) The number of
regions: 500 (g) The number of
regions: 1,000 (h) The number of regions: 8,046(total) Fig. 16. Segmentation of semiconductor image by previous method[11]
(a) The number of regions: 1
(b) The number of regions: 5
(c) The number of regions: 10
(d) The number of regions: 50
(e) The number of
regions: 100 (f) The number of
regions: 500 (g) The number of
regions: 1,000 (h) The number of regions: 5,732(total) Fig. 17. Segmentation of semiconductor image by proposed method
(a) The number of regions: 1
(b) The number of regions: 5
(c) The number of regions: 10
(d)The number of regions: 50
(e) The number of
regions: 100 (f) The number of
regions: 500 (g) The number of
regions: 1,000 (h)The number of regions: 7,319(total) Fig. 18. Segmentation of lena image by previous method[11]
(a) The number of
regions: 1 (b) The number of
regions: 5 (c) The number of
regions: 10 (d) The number of regions: 50
(e) The number of regions: 100
(f) The number of regions: 500
(g) The number of regions: 1,000
(h) The number of regions: 5,335(total) Fig. 19. Segmentation of lena image by proposed method
(1) Peppers
The number of regions:
8,241
The number of regions:
4,856
The number of regions:
2,327 original image (A) previous method (B) proposed method 1 (C) proposed method 2
(2) Human Brain
The number of regions:
6,927 The number of regions:
4,229 The number of regions:
2,447 original image (A) previous method (B) proposed method 1 (C) proposed method 2
(3) Spine
The number of regions:
7,174
The number of regions:
4,608
The number of regions:
1,632 original image (A) previous method (B) proposed method 1 (C) proposed method 2
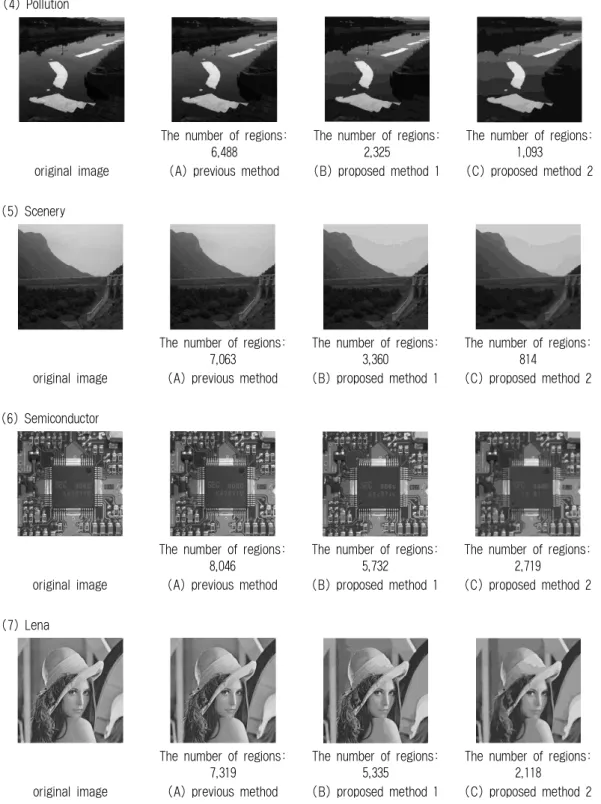
The number of regions:
6,488 The number of regions:
2,325 The number of regions:
1,093 original image (A) previous method (B) proposed method 1 (C) proposed method 2
(5) Scenery
The number of regions:
7,063
The number of regions:
3,360
The number of regions:
814
original image (A) previous method (B) proposed method 1 (C) proposed method 2
(6) Semiconductor
The number of regions:
8,046
The number of regions:
5,732
The number of regions:
2,719 original image (A) previous method (B) proposed method 1 (C) proposed method 2
(7) Lena
The number of regions:
7,319
The number of regions:
5,335
The number of regions:
2,118 original image (A) previous method (B) proposed method 1 (C) proposed method 2
Fig. 20. Result of segmentation for several experimentations
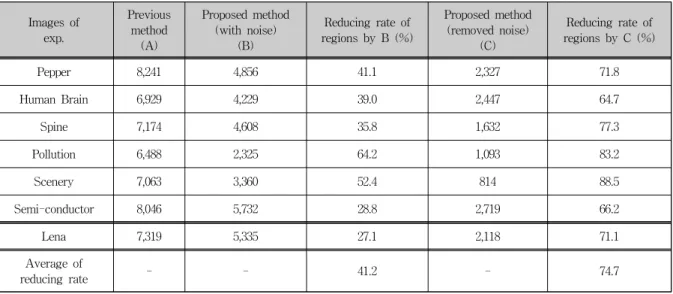
기존 방법과 제안한 방법을 비교할 때 Table 1에서 보는 바와 같이 분할된 전체영역의 개수에 있어서 노이즈가 포함 된 실험영상에 대하여는 평균 41.2%의 감소율을 보였고, 노 이즈가 제거된 실험영상에 대하여는 평균 74.7%의 감소율을 보였다. Table 1에서 제안한 방법 B의 분할영역 개수에 대한 감소율 계산은 (1-B/A)×100, 제안한 방법인 C의 분할영역 개수에 대한 감소율 계산은 (1-C/A)×100로 계산한 결과이다.
4. 결론 및 향후 연구방향
본 논문에서는 기존의 동질성 문턱 값 기반 영상분할 방 법[11]에서 나타났던 과분할 현상을 개선하기 위한 알고리듬 을 제안하였다. 제안한 방법은 동질성 문턱 값 를 기반 으로 영상을 분할하는 개념에 있어서는 기존 방법과 동일하 지만, 기존에 하나의 독립된 영역으로 간주했던 동질성 윈
Images of exp.
Previous method
(A)
Proposed method (with noise)
(B)
Reducing rate of regions by B (%)
Proposed method (removed noise)
(C)
Reducing rate of regions by C (%)
Pepper 8,241 4,856 41.1 2,327 71.8
Human Brain 6,929 4,229 39.0 2,447 64.7
Spine 7,174 4,608 35.8 1,632 77.3
Pollution 6,488 2,325 64.2 1,093 83.2
Scenery 7,063 3,360 52.4 814 88.5
Semi-conductor 8,046 5,732 28.8 2,719 66.2
Lena 7,319 5,335 27.1 2,118 71.1
Average of
reducing rate - - 41.2 - 74.7
Table 1. Decreasing rate for segmented regions of proposed method against previous method
도우 영역과 주변영역과의 영역 병합 알고리듬 및 윈도우의 중심화소 를 기반으로 주변의 영역들 을 연결하여 병합하는 알고리듬을 구현하여 삽입함으로써 기존 방법 보다 과분할 현상을 현저하게 줄일 수 있었다.
영상의 분할결과를 기존 방법과 비교하였을 때 제안한 방법 은 실험영상에 따라 차이는 있지만 노이즈가 포함된 실험영 상에 대하여는 평균 41.2%정도의 분할 영역수를 줄 일 수 있었고, 노이즈가 제거된 실험 영상에 대하여는 평균 74.7%
정도의 분할 영역수를 줄 일 수 있었다. 분할된 영역의 크 기순으로 조합하여 나타낸 영상의 결과는 기존 방법에 있어 서는 1,000여개 정도의 영역을 조합하여도 영상이 포함하고 있는 객체를 시각적으로 분별하기 어려웠지만 제안한 방법 에서는 10개미만의 영역만을 가지고도 시각적으로 포함된 객체를 분별 할 수 있었다. 이로써 동질성 문턱 값 기반 영 상분할 방법에 본 논문에서 제안한 알고리듬을 적용할 경우 에는 영상의 분할 영역수를 현저하게 줄 일 수 있을 뿐만 아니라 분할된 영역들 중에서 몇 개의 영역만을 가지고도 영상의 내용을 간단하게 파악할 수 있기 때문에 내용기반 영상 검색 혹은 의료와 바이오 과학 분야 및 영상 애니메이 션 분야 등에서 널리 이용할 수 있을 것으로 기대한다.
향후 연구과제로는 분할된 결과 영역들을 토대로 분할 영 역에 대한 화소들의 군집 모양기술자를 개발하고 이를 내용 기반 영상 검색에 적용하는 연구와 제안한 방법을 통한 3D 볼륨 영상의 분할 및 분할 영역 객체를 시각화하는 연구 등 을 진행할 예정이다.
참 고 문 헌
[1] NOBUYUKI OTSU, “A Threshold Selection Method from Gray-Level Histograms,” IEEE TRANSACTION ON SYSTEM, MAN, AND CYBERNETICS, Vol.SMC-9, No.1, pp.62-66, 1979.
[2] Hui-Fuang Ng, “Automatic thresholding for defect detection,”
Pattern Recognition Letters, Vol.27, Issue 14, pp.1644-1649, 2006.
[3] Ch.Hima Bindu, QISCET and Ongole, “AN IMPROVED MEDICAL IMAGE SEGMENTATION ALGORITHM USING OTSU METHOD,” SHORT PAPER Internal Journal of Recent Trends in Engineering, Vol2, No.3, pp.88-90, 2009.
[4] PING-SUNG LIAO, TSE-SHENG CHEN and PAU-CHOO CHUNG, “A Fast Algorithm for Multilevel Thresholding,”
JOURNAL OF INFORMATION SCIENCE AND ENGINEERING 17, pp.713-727, 2001.
[5] Octavio Gomez, Jesus A. Gonzalez, and Eduardo F. Morales,
“Image Segmentation Using Automatic Seeded Region Growing and Instance-based Learning,” Lecture Notes In Computer Science archive Proceedings of the Congress on pattern recognition 12th Iberoamerican conference on Progress in pattern recognition, image analysis and applications, 2007, pp.192-201.
[6] Zheng Lin, Jesse Jin and Hugues Tabot, “Unseeded region growing for 3D image segmentation,” inACM International Conference Proceeding Series Vol.9, Selected papers from the Pan-Sydney workshop on Visualisation Vol.2, 2000, pp.31-37.
[7] Soumya Dutta, Bidyut B. Chaudhuri, “Homogeneous Region based Color Image Segmentation,” in Proceedings of the World Congress on Engineering and Computer Science, Vol.2, 2009, WCECS 2009, San Francisco, USA.
[8] Chantal Revol-Muller, Francoise Peyrin, Yannick Carrillon, and Christophe Odet, “Automated 3D region growing algorithm based on an assessment function”, Pattern Recognition Letters 23, pp.137-150, 2002.
동질성 문턱 값 기반 영상분할에서 과분할 영역 축소 방법
한 기 태†
요 약
본 논문에서는 영상의 동질성 문턱 값(Homogeneity Threshold:)을 이용한 영상분할방법에서 영상의 과분할 발생을 해결하기 위한 개선 된 영상분할 방법을 제안한다.
을 기반으로 한 영역성장(Region Growth) 알고리듬은 선택된 윈도우의 중심화소만을 사용하기 때문에 과 분할이 발생하였으나, 제안한 방법에서는 선택된 윈도우에 대한 동질성 여부를 조사하여 동질성을 만족할 경우 선택된 윈도우 화소전체를 영역병합에 사용하고 선택 윈도우 가 동질성 윈도우를 만족하지 않을 때에는 윈도우의 중심화소를 사용함으로써 영역의 과 분할을 현저하게 줄일 수 있었다.
제안한 방법의 타당성을 보이기 위하여 기존방법과 동일한 영상을 동일한 조건으로 실험하였으며, 그 결과 제안한 방법은 기존 방법에 비해 영역의 개수를 40% 이상 줄이면서도 시각적으로 영상의 품질에 차이가 없음을 볼 수 있었다. 특히 분할된 영역의 크기순으로 결합한 영상을 가지고 비교 했을 때, 기존방법에서는 분할된 영역의 큰 영역으로부터 1,000개 이상의 영역을 결합하여도 어떠한 영상인지 구분하기가 힘들었 으나, 제안한 방법에서는 10개 내외의 영역만 결합하여도 어떠한 이미지인지 식별할 수 있음을 확인할 수 있었다. 따라서 제안한 방법은 특정 영상으로부터의 객체 추출이나 정보검색 혹은 해부학이나 생물학 분야의 연구 및 영상 시각화와 애니메이션 등 다양한 분야에서 활용될 수 있 을 것으로 기대한다.
키워드 : 영상분할, 동질성 문턱 값, 영역성장, 중심화소, 선택 윈도우 [11] Gi-Tae Han, “Automatic Method for Extracting Homogeneity
Threshold and Segmenting Homogeneous Regions in Image”, The KIPS Transactions: Part B, Vol.17-B, No.5, pp.363-374, 2010.
2009년~2010년 University of Texas at Austin, Researching professor 1992년~현 재 가천대학교 IT대학 인터랙티브미디어학과 교수 관심분야 : 컴퓨터비전, 영상처리, 스마트객체 응용기술, 모바일
컨텐츠 등